
Lesson 27: Better than what? Picking a benchmark that matches what you actually own
A plain-English guide to benchmarks: why a return figure means nothing until you set it beside something else, why the S&P 500 is a poor yardstick for a diversified account, and how to pick a comparison that matches what you hold.

Six percent.
That is what your account earned last year, and for most beginners the number is where the thinking stops. It looks like a result. It is half of one.
Six percent against what?
The missing half of that sentence is what this lesson is about. A return arrives with no built-in sense of whether it is strong, weak, or ordinary, because a return is a comparison waiting for its other side. To judge yours you need a standard — published, agreed on by the whole market, and built for the kind of investing you are doing. Investors call that standard a benchmark.
Education only: This lesson explains how investment returns are compared, for general learning. It is not individualized investment or tax advice, and nothing named here is a recommendation to buy or sell anything. Every figure below is a hypothetical illustration. Past performance does not predict future results.
A tape measure in the drawer
Pull a tape measure out of a kitchen drawer and run it along your counter. Six feet. That answer is useful the instant you say it, and the reason is easy to overlook. The marks on the tape are a shared standard, so everyone's foot is the same foot. Say six feet and anyone can check the measurement or compare it with their own kitchen.
Now keep the number and drop the standard. Six. Six what, measured against what, a large kitchen or a small one? The number turns into noise. That is the state your return figure arrives in. Your broker can tell you the account made 6 percent, and the percentage will be real and correctly calculated and still only half a sentence.
The tape measure is the benchmark, and its whole job is to be that second number.
What a benchmark is made of
A benchmark is usually a market index or an average that tracks one market or one slice of it. FINRA's list for stocks runs from the Dow Jones Industrial Average and the S&P 500 to the Russell 2000, with benchmarks such as the Bloomberg U.S. Aggregate Bond Index covering bonds. 1
An index is a basket of securities chosen to stand in for a slice of the market. The S&P 500, the Russell 2000, and the Wilshire 5000 are three baskets that index funds are built to follow. 2 That definition carries a practical consequence: an index is a measurement, and you cannot buy it directly. The only way to hold one is through a fund designed to track it. 2
Funds come in two shapes here, and the difference matters when you read a performance table. An index fund sets out to achieve roughly the return of a particular index before fees, while an actively managed fund is measured against the benchmark it has chosen. 3
Now watch a benchmark decide a verdict. FINRA's own example: a fund you own returned 10 percent a year over five years. That sounds strong. If a comparable benchmark returned 12 percent a year over the same period, your fund lagged it. If the benchmark returned 8 percent, your fund beat it. 1 The same 10 percent, two opposite readings, and the benchmark is what picks between them.
Why one index is the wrong tape measure
The most familiar benchmark in the United States is the S&P 500, and it is the one most often pressed into service as "the market." Schwab's education desk points out what goes wrong with that. The S&P 500 measures a single market segment — US large-cap stocks — and only a subset of that segment. For a portfolio diversified across international stocks, bonds, commodities, and cash, it offers little guidance. 4
A mismatched benchmark does more than miss the point: it produces a conclusion that looks like information. Fidelity puts it plainly: choosing the wrong benchmark can lead to a flawed analysis and a mistaken read on how a portfolio is doing. 5
Schwab shows both directions of the distortion in one example. In the second quarter of 2020, the strongest quarter in US stock market history, a diversified example portfolio trailed the S&P 500 — the result you would expect when large US stocks soar and a mix holds other things too. In the fourth quarter of 2018, when stocks pulled back, the same kind of portfolio fell less than the S&P 500, because its bond holdings gained while stocks dropped. 4 One index tells one story about one kind of year.
Choosing a yardstick that fits what you hold
The rule for picking a benchmark is short. Schwab's guidance is that an appropriate one should reflect your portfolio's risk level and allocation. 4
FINRA states it as a matter of comparing like with like. A large-cap US stock fund can fairly be set against the S&P 500, which tracks large US stocks; a small-cap US fund belongs beside the Russell 2000, which measures the small-company segment; and a single stock is often best compared with an index covering its own industry. Whatever you pick, review what assets the benchmark actually holds. 1
You rarely have to invent this from nothing. A fund's quarterly report usually names the specific index it is benchmarked against and shows how it stacks up. 1 A fund prospectus prints a table comparing the fund's performance over the past ten years with a broad-based market index, and sometimes with a narrower index the fund calls a better benchmark for the comparison. 6
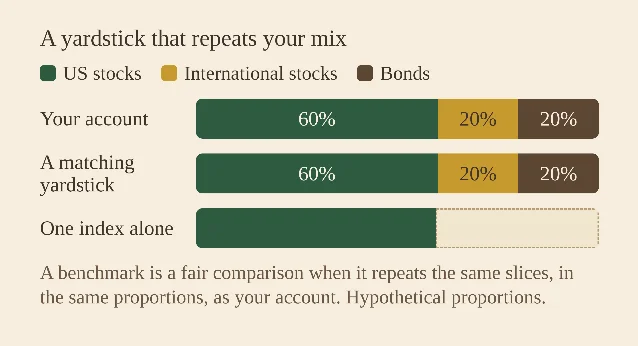
When no single index fits, Fidelity suggests two routes: track the portfolio against a few indexes to get a general idea, or build a custom benchmark by blending indexes in the proportions you actually hold. 5
| What you hold | A yardstick that matches it | What that yardstick covers |
|---|---|---|
| US large-company stocks | S&P 500 | The largest US companies 1 |
| US small-company stocks | Russell 2000 | The small-company segment of US stocks 1 |
| International stocks | MSCI EAFE | Large-company stocks outside the US 4 |
| US investment-grade bonds | Bloomberg U.S. Aggregate Bond Index | The US dollar investment-grade bond market 5 |
| A mix of the above | A blend of the matching indexes | One reference whose weights repeat your own 5 |
Naming these indexes is for comparison. Which investments suit you is a separate question.
Reading the comparison honestly
Give the comparison several years. FINRA advises doing the comparison across several years rather than a single quarter or even a full year, because one-time events can skew a short window. 1
Treat the result as history. A benchmark comparison shows how something measured up in the past, and FINRA is clear that neither the benchmark nor the investment is guaranteed to behave the same way next time. 1
Weigh risk alongside return. If a fund trails its benchmark because it is taking on less risk, FINRA notes it may still fit a portfolio; performance data often pairs returns with a measure of how much they swing. 1
Know what each figure leaves out. FINRA's guidance is to include the fees you paid when you work out your own return, and to factor in taxes and inflation for anything you hold for a long time, since what you keep is smaller than what is printed. 7
One mismatch is allowed on purpose. If you are weighing a change of strategy, FINRA suggests comparing your current portfolio against a benchmark that mirrors the strategy you are considering, so you can see the two side by side. 1
Schwab makes one further point worth holding onto. For many people the decisive question is whether they are on track toward a goal they set, and no index measures that. 4
Quick recap
- A return figure on its own is half a sentence; a benchmark is the standard you set it beside, and it changes the verdict while the return stays the same. 1
- A benchmark is an index or average tracking one market or one slice of it, and an index is a measurement you cannot buy directly. 2
- The S&P 500 is one segment, US large-company stocks; an appropriate benchmark should reflect your portfolio's risk level and allocation. 4
- A fund usually names its own benchmark in its quarterly report or prospectus, and a blended benchmark can mirror a mixed portfolio. 15
- Compare over several years, read risk alongside return, and remember that fees sit inside the printed figure while taxes and inflation do not. 7
Next lesson: asset allocation — why the mix of things you own shapes your results more than any single pick does.
References
- 1
- 2Index Funds — Investor.gov
investor.gov
- 3Mutual Funds — Investor.gov
investor.gov
- 4
- 5What is a benchmark? — Fidelity
fidelity.com
- 6
- 7Evaluating Performance — FINRA
finra.org
This story was produced automatically by a channel. One sentence is all it takes for Neodrop to keep producing for you.