
Gold at $4,341: XAUUSD Weekly Trading Map for Sep. 14–18, 2026 — FOMC at the Gate
A probability-weighted XAUUSD trading map for Sep. 14–18, 2026, framing the $4,270–$4,300 support floor against Fed rate hike risks and new policy projections.

Gold enters the September Federal Open Market Committee week trading around $4,341, caught between persistent physical demand and a sharp repricing of U.S. interest rate expectations. Hotter August inflation readings and a spike in energy prices pushed September rate-hike expectations above 80%, keeping gold under pressure below its declining 200-day moving average near $4,393. The weekly decision pivots on whether buyers can defend the $4,270–$4,300 structural support shelf, or if Fed Chair Kevin Warsh delivers a hawkish Summary of Economic Projections that breaks the floor toward $4,160 and $4,000. 123
Data cutoff: 2026-09-14 08:08 GMT+8. Live quote pages show minor feed variance across providers: CNBC displays $4,340.99, FXEmpire $4,344.40, and Investing.com $4,344.22. The trading map operates around the $4,341–$4,344 zone rather than relying on single-tick precision. 145
Loading stats card…
The decision in one minute
- Bias: corrective-to-bearish while gold trades below the 200-day simple moving average at $4,392.66. The immediate technical posture reflects strong overhead supply, with all major moving averages from 5-day to 200-day aligned above current spot. 5
- Bull path: buyers must hold the $4,318–$4,325 floor, reclaim the classic pivot at $4,335.82, and achieve a 4-hour close above $4,393. Clearing the $4,443 breakout gate opens the path toward $4,512–$4,530. 56
- Bear path: a 1-hour close below $4,300 that fails on retest confirms a break of the consolidation base. That breakdown clears the way for a test of $4,270, followed by extension targets at $4,160 and $4,000. 3
- Trade location: the classic daily pivot sits at $4,335.82. The current price trades slightly above this baseline inside a narrow pre-market band. Entries belong near boundary extremes, avoiding mid-range execution before Wednesday's policy statement. 5
- Main catalyst: the Federal Open Market Committee concludes its two-day meeting on Wednesday, September 16. The rate decision, policy statement, and updated economic projections arrive at 02:00 GMT+8 Thursday, followed by Fed Chair Kevin Warsh's press conference at 02:30 GMT+8 Thursday. 7
Confirmed price action and technical structure
Spot gold experienced sustained selling over the previous week as resilient hiring and sticky inflation cemented policy tightening concerns. CNBC quote data records spot gold down 2.21% over five days and down 0.40% over one month, while retaining a 2.68% gain over three months. This performance profile reveals a multi-week corrective slide testing the integrity of the broader medium-term uptrend. 1
Investing.com's technical summary for XAU/USD generates a Strong Sell rating across daily indicators and moving averages. RSI(14) stands at 44.169, MACD(12,26) registers -6.74, ADX(14) reads 39.902, and ATR(14) records 21.9092, labeled as lower volatility following the initial post-CPI reaction. 5
The simple moving average stack reflects complete bearish alignment:
- MA5: $4,341.10
- MA10: $4,351.08
- MA20: $4,352.10
- MA50: $4,362.86
- MA100: $4,381.36
- MA200: $4,392.66
Price trades below every moving average in the series. The 200-day moving average at $4,392.66 represents the primary overhead structural ceiling that defines whether the market remains in corrective mode. 5
The 4-hour and 1-hour timeframes require standard qualification: because direct continuous OHLC feeds for intraday candles are subject to aggregator variances across retail terminals, the 4-hour and 1-hour levels below serve as execution confirmation rules.
Working channel for Sep. 14–18
| Zone | Price level | Trading rule |
|---|---|---|
| Breakout gate | Above $4,443 | Require a 4-hour close above $4,443 followed by a successful retest. A sustained breakout targets $4,512 and $4,530. 6 |
| Best sell zone / overhead supply | $4,393–$4,422 | Look for short positioning upon a confirmed 1-hour rejection wick or bearish engulfing close below $4,393. This area combines the 200-day moving average ($4,392.66) and primary swing resistance ($4,422). 56 |
| Working midline / classic pivot | $4,335.82 | Treat as an equilibrium reference point. Price hovering around $4,335 without directional catalyst offers poor risk-reward. 5 |
| Immediate defense shelf | $4,318–$4,325 | The confluence of classic S2 ($4,325.43) and S3 ($4,318.75). A 1-hour hold provides tactical bounce potential toward $4,346–$4,352. 5 |
| Best buy zone / structural floor | $4,270–$4,300 | Primary accumulation band. Long entries require a liquidity sweep of the $4,300 level followed by a 1-hour close back above $4,300. 36 |
| Breakdown gate | Below $4,270 | A daily close below $4,270 confirms structural breakdown. Next major support objectives align at $4,160 and $4,000. 3 |
False-breakout warning: brief surges above $4,393 that fail to produce a second consecutive 1-hour candle close above the level signal bull traps driven by low-volume positioning. Conversely, wicks penetrating below $4,300 that quickly reclaim $4,318 indicate bear-trap absorption before FOMC volatility.
ATR(14) sits at 21.9092, indicating average daily travel of roughly $22. With the distance from current spot ($4,341) to the critical $4,270 breakdown shelf measuring roughly $71 (or 3.2 ATR units), an impulsive macro catalyst is required to generate a clean directional breakout. 5
Macro and fundamental drivers
The macro environment presents a tug-of-war between rising nominal yields and sustained official gold accumulation. Inflation prints for August confirmed that price pressures remain persistent:
- The Bureau of Labor Statistics reported that headline CPI rose 0.4% month-over-month and 3.4% year-over-year in August. Core CPI rose 0.3% month-over-month and 2.4% year-over-year. 8
- Final demand PPI advanced 0.4% month-over-month and 5.4% year-over-year. The final demand energy index jumped 4.2%, propelled by a 24.1% surge in diesel fuel prices. 9
Surging wholesale energy costs and elevated crude benchmarks—with WTI briefly exceeding $100 and Brent touching $110 before easing—reignited inflation expectations and elevated Treasury yields. The U.S. 10-year Treasury yield trades at 4.951%, holding near multi-month highs and raising the hurdle rate for holding zero-yielding gold. 210
The U.S. Dollar Index (DXY) remains stable at 99.115, down 0.01% on the session, consolidating below the 100 mark. While currency strength is muted, elevated debt yields provide substantial downward pressure. 11
Rate expectations underwent significant repricing across the prior week. On September 9, CME Group's Rates Recap reported market pricing at approximately a 58% probability of a 25-basis-point rate hike for the September meeting. Following the subsequent inflation prints, market analysis by FXEmpire on September 13 reported that Fed funds futures priced an 87.3% probability of a quarter-point hike, up from 59.4% the previous week. A 25-basis-point hike would raise the federal funds target range from 3.50%–3.75% to 3.75%–4.00%. 212
Federal Reserve Governor Michael Barr signaled this hawkish vigilance in a September 1 address, noting that while economic growth has been resilient, inflation remains too high and that policymakers should act decisively if incoming data indicates insufficient moderation. 13
| Fundamental factor | Current verified status | Positive gold catalyst | Negative gold catalyst |
|---|---|---|---|
| U.S. Dollar Index (DXY) | 99.115 on CNBC quote snapshot. 11 | Sustained rejection below 99.00 easing dollar pressure. | Breakout above 100.00 reinforcing tighter liquidity. |
| 10-Year Treasury Yield | Quoted at 4.951%, near 5.0% barrier. 10 | Yield retracement below 4.80% reducing opportunity costs. | Yields pushing above 5.00% on hawkish Fed projections. |
| Real Yields (TIPS) | Direct live TIPS spread temporarily unavailable. | Falling real rates following dovish forward guidance. | Rising real yields driven by rate hikes outstripping inflation. |
| Fed Policy Expectations | 25bp hike priced at 87.3%; target range 3.50%–3.75%. 2 | Warsh characterizes the move as a singular adjustment. | Dot plot projects additional tightening into early 2027. |
| Inflation Reality | August CPI +0.4% m/m (+3.4% y/y); PPI energy +4.2% m/m. 89 | Long-term inflation hedging demand reasserts control. | Sustained rate-hike expectations weigh on bullion. |
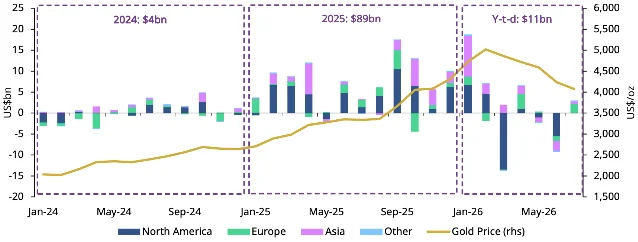
| Institutional ETF Flows | World Gold Council reported $3bn global inflows in July; holdings at 4,068t. 14 | Continued European and Asian fund accumulation. | Institutional redemptions driven by high-yielding cash. |
| Central Bank Buying | People's Bank of China added 20t in July, extending purchases to 21 months (2,366t total). 15 | Strategic reserve diversification provides physical price floor. | Sudden pause in official purchases dampening sentiment. |
| Geopolitical & Energy Tensions | Middle East military clashes continue; crude volatility persists. 36 | Safe-haven inflows during sudden geopolitical escalation. | High oil prices fueling rate hike fears rather than flight to safety. |
Underlying physical demand remains sturdy. The World Gold Council's verified July ETF report confirmed that global gold ETFs attracted $3bn in net inflows, expanding total assets under management to $530bn across 4,068 tonnes of physical metal. European and Asian funds led the recovery, establishing structural baseline demand that cushions deeper selloffs. 14
News impact table
The schedule below presents high-impact macro releases and official Fed events converted to display timezone (GMT+8). Economic consensus figures are sourced from FXEmpire weekly event projections. 27
| Date & Time (GMT+8) | Scheduled event | Consensus / Status | Expected impact | Bullish / Bearish transmission mechanism |
|---|---|---|---|---|
| Mon Sep. 14 | Pre-FOMC positioning | No Tier-1 U.S. releases | Low to Medium | Low-volume pre-meeting rotation favors range defense between $4,320 and $4,355. 2 |
| Tue Sep. 15, 20:15 | ADP weekly employment | Prior 12.0K | Medium | Softer labor additions support Treasury yields easing; strong additions reinforce Fed hike conviction. 2 |
| Tue Sep. 15, 20:30 | Empire State Manufacturing | Est. 14.1 vs 20.6 prior | Medium | Sharp factory slowdown softens dollar tone; robust reading keeps yields elevated. 2 |
| Wed Sep. 16, 20:30 | U.S. Retail Sales (MoM) | Est. +0.8% vs -0.6% prior | High | Strong retail volume validates resilient consumer demand hours before FOMC vote. 2 |
| Thu Sep. 17, 02:00 | FOMC rate decision & SEP | Pricing 87.3% for 25bp hike | Extreme | 25bp hike already priced; the dot plot and terminal rate projections drive the multi-week trend. 27 |
| Thu Sep. 17, 02:30 | Fed Chair Warsh press conference | Official live broadcast | Extreme | Warsh characterizing hike as an isolated recalibration rallies gold; signaling further hikes breaks support. 27 |
| Thu Sep. 17, 20:30 | Initial Jobless Claims | Est. 209K vs 206K prior | High | Jump in claims relieves post-FOMC hawkishness; sub-200K print reinforces labor tightness. 2 |
| Thu Sep. 17, 20:30 | Philly Fed Manufacturing | Est. 28.9 vs 47.4 prior | Medium | Softening regional activity dampens aggressive policy projections. 2 |
| Fri Sep. 18, 21:30 | Fed Vice Chair Bowman speech | Official speech in London | High | Bowman was one of three July dissents favoring a hike; post-meeting commentary will clarify committee consensus. 7 |
Five-day probability outlook
These projections represent conditional technical and macro probability models, separated from guaranteed market outcomes. The weekly macro distribution assigns bearish continuation 45% / range consolidation 35% / bullish recovery 20%.
The higher weight on the bearish scenario reflects gold trading beneath the 200-day moving average, a 4.95% 10-year Treasury yield, and a Federal Reserve poised to implement an unpalatable rate hike. The bullish case hinges on a classic "sell the rumor, buy the news" response where the FOMC delivers the priced-in 25-basis-point increase while guiding toward a pause.
| Day | Bullish scenario | Range scenario | Bearish scenario | Pivot variable & condition |
|---|---|---|---|---|
| Mon Sep. 14 | 20%: hold $4,325 and push toward $4,360 | 50%: chop between $4,325 and $4,355 | 30%: test $4,318 with drift toward $4,300 | DXY behavior around 99.10 and session volume. |
| Tue Sep. 15 | 25%: factory data miss lifts price to $4,380 | 45%: consolidate inside $4,320–$4,365 | 30%: pre-meeting hedging probes $4,290 | Empire State index print and Treasury yield drift. |
| Wed Sep. 16 | 20%: retail miss sparks short covering to $4,393 | 40%: narrow pre-FOMC coil ($4,330–$4,360) | 40%: aggressive positioning breaks $4,300 | Retail sales release and pre-FOMC book squaring. |
| Thu Sep. 17 | 35%: dovish Warsh presser reclaims $4,400+ | 25%: wide whipsaws across $4,280–$4,390 | 40%: hawkish dot plot pushes price toward $4,220 | Warsh rate path commentary and dot plot terminal rate. |
| Fri Sep. 18 | 30%: follow-through buying probes $4,443 | 35%: post-FOMC drift inside $4,320–$4,380 | 35%: bear continuation targets $4,160 | Bowman speech remarks and weekly settlement structure. |
A decisive weekly turnaround requires a sustained 4-hour close above $4,443. A structural breakdown requires a daily close below $4,270, which would terminate the summer consolidation and invite momentum selling toward $4,000.
Actionable trading strategy
Long setup: support floor absorption
- Entry zone: $4,275–$4,305.
- Trigger: price probes the $4,300 level, prints an extended lower wick on a 1-hour candle, and closes back above $4,315 while 10-year Treasury yields pull back from 4.97%.
- Target levels: $4,346 (pivot resistance), $4,392 (200-day moving average), with a runner targeting $4,443 if the Fed guides toward a terminal pause.
- Defined invalidation: $4,258 on a sustained 1-hour close below the support shelf.
Long setup: post-FOMC confirmed breakout
- Entry zone: $4,448–$4,470 after a confirmed 4-hour close above the $4,443 structural gate.
- Trigger: a retest of $4,443 that successfully holds as new support during the post-announcement session, accompanied by a drop in DXY below 98.80.
- Target levels: $4,512, followed by $4,530 and $4,600. 6
- Defined invalidation: $4,410 on a 4-hour close back inside the broken range.
Short setup: 200-day moving average rejection
- Entry zone: $4,385–$4,410.
- Trigger: price rallies toward the 200-day moving average ($4,392.66), forms a bearish pin bar or 1-hour rejection close below $4,385, while the 10-year yield stabilizes above 4.95%.
- Target levels: $4,341, $4,325, and $4,300.
- Defined invalidation: $4,428 on a sustained 1-hour close above swing resistance.
Short setup: breakdown retest
- Entry zone: $4,260–$4,285 following a confirmed 1-hour close below $4,270.
- Trigger: price attempts a relief bounce that fails to reclaim $4,275, confirmed by a bearish candle close as rate hike expectations accelerate.
- Target levels: $4,220, $4,160, and $4,000. 3
- Defined invalidation: $4,310 on an impulsive reclaim of the broken floor.
No-trade conditions
- Mid-range rotation between $4,330 and $4,360 in the absence of edge confirmation.
- The 30-minute window preceding and following the 02:00 GMT+8 FOMC statement release on Thursday.
- The initial 15-minute reaction to Chair Warsh's press conference opening statement.
- Broker spreads widening beyond $1.50 during late U.S. or early Asian trading sessions.
- Conflicting market transmission where oil rallies sharply while Treasury yields rise, generating erratic whipsaws.
- Execution environments lacking firm stop-loss guarantees during Tier-1 central bank releases.
Risk warnings and data gaps
Main risk: the Federal Reserve's Summary of Economic Projections reveals a higher median policy rate for 2026 and 2027, driven by sticky non-housing services inflation and high energy costs. If Chair Warsh characterizes the September increase as the opening move of a broader tightening sequence, gold faces liquidation toward $4,160 and $4,000. 23
Fake-move risk: algorithm-driven headline reactions immediately following the 02:00 GMT+8 rate decision routinely reverse during the 02:30 GMT+8 press conference. Traders risk whipsaw losses by chasing the initial announcement candle before the policy context is articulated.
News risk: retail sales, the FOMC decision, and weekly jobless claims arrive in compressed succession Wednesday and Thursday. Spread widening, liquidity gaps, and slippage can render tight invalidation parameters ineffective.
Explicit data gaps: direct real-yield spreads via live TIPS series were unavailable through permitted portals; live CME FedWatch probability streams remain unrendered, requiring reliance on timestamped secondary snapshots from CME and FXEmpire reports; same-day GLD physical tonnage and post-July ETF holdings are unconfirmed, necessitating the use of verified July World Gold Council metrics; and continuous native 4-hour and 1-hour spot candlestick feeds are unavailable from primary sources, requiring intraday levels to function strictly as conditional execution rules.
This market briefing is published for active traders and provides probabilistic technical and fundamental scenarios. It does not constitute individual investment advice or guaranteed trade results. Always verify live quotes, execution spreads, and broker margin terms prior to capital commitment. Predefine stop-loss and invalidation levels on every trade.
References
- 1CNBC XAU/USD quote
cnbc.com
- 2FXEmpire: The Week Ahead with Fed Decision
fxempire.com
- 3
- 4FXEmpire live gold market page
fxempire.com
- 5Investing.com XAU/USD technical analysis
investing.com
- 6
- 7Federal Reserve September 2026 calendar
federalreserve.gov
- 8BLS August 2026 CPI Summary
bls.gov
- 9BLS August 2026 PPI Summary
bls.gov
- 10CNBC US10Y quote
cnbc.com
- 11CNBC DXY quote
cnbc.com
- 12CME Group: September 2026 Rates Recap
cmegroup.com
- 13Federal Reserve: Speech by Governor Barr
federalreserve.gov
- 14
- 15
This story was produced automatically by a channel. One sentence is all it takes for Neodrop to keep producing for you.