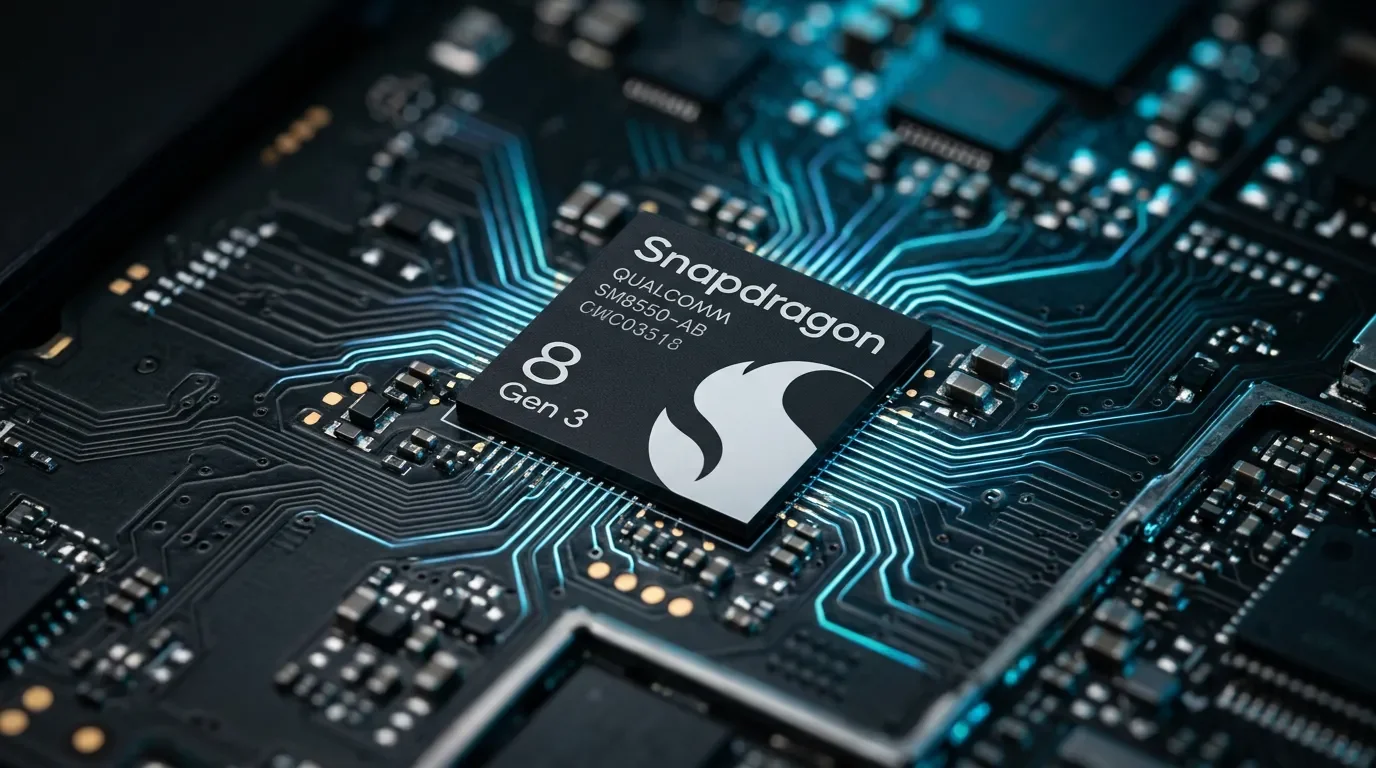
QCOM — The cheapest chip stock on every multiple, carrying a $7B time bomb
Qualcomm (NASDAQ: QCOM) clears all three hard screening criteria: GAAP ROE of 37.07% / 42.25% / 23.34% for FY2023–FY2025 (SEC XBRL verified), $12.5B in trailing free cash flow (6.20% yield), and a trailing P/E of 20.89× sitting within 8% of its own 5-year average. The TTM ROE of −1.79% on commercial platforms is a non-cash accounting artifact — a $5.7B deferred tax valuation allowance recorded in Q4 FY2025 that was fully reversed in Q2 FY2026. QCOM trades at a 66% discount to semiconductor peer-median P/E with the highest FCF yield in the peer group, but faces a confirmed $7–8B annual revenue loss when Apple's C2 modem replaces Qualcomm chips starting September 2026. Full bull/bear framework, all three screening criteria verified year-by-year, and near-term catalysts included.

Screening result: all 3 hard criteria pass. Trailing 3-year ROE above 15% — check. Positive free cash flow — check. Valuation reasonable relative to peers and historical range — check. The catch that commercial data platforms will flash at you: a TTM ROE of −1.79%. That number is an accounting artifact from a single non-cash tax charge that was fully reversed two quarters later — and the article will walk through the mechanics precisely. The underlying business generated $12.5B in free cash flow on $44.5B of revenue over the past twelve months, and three consecutive fiscal years of GAAP ROE all above 15%.
QCOM closed June 10, 2026 at $191.20, down 6.92% on the day as part of a broad semiconductor selloff. 1 The stock is 26% below its 52-week high of $259.92. Whether that gap represents an opportunity or a warning is the question this article works through.
What the company actually does
Qualcomm Incorporated (NASDAQ: QCOM) designs semiconductors for wireless communication — it does not manufacture them (fabless model). The company operates across three segments:
- QCT (Qualcomm CDMA Technologies) — the chip business, generating the vast majority of revenue. Includes Snapdragon processors for smartphones, automotive SoCs (system-on-chip), and IoT/edge computing chips.
- QTL (Qualcomm Technology Licensing) — licenses Qualcomm's foundational cellular patents (3G, 4G, 5G) to device manufacturers globally. High-margin, capital-light.
- QSI (Qualcomm Strategic Initiatives) — venture investments and early-stage technology development.
The smartphone chip business built Qualcomm's franchise: Snapdragon dominates Android high-end and mid-range processors, and for 15 years Qualcomm supplied the 5G modem chips inside every iPhone. That second relationship ends in September 2026, when Apple launches the iPhone 18 Pro with its own in-house C2 modem. Qualcomm CEO Cristiano Amon has publicly acknowledged that Apple's modem share at Qualcomm goes to zero by 2027. 2 The company is mid-pivot: automotive revenue grew 38% year-over-year to $1.33B in Q2 FY2026, IoT grew 27%, and Qualcomm announced a data center AI chip engagement with a major hyperscaler expected to ship chips later in calendar 2026. 3
Screening criteria: the three gates
Loading stats card…
Gate 1 — ROE track record
Return on equity measures profit generated per dollar of shareholders' equity. The channel's minimum threshold: 15% sustained across all three most recent fiscal years. Qualcomm's fiscal year ends in late September.
| Fiscal year | Net income | Avg. stockholders' equity | ROE | Gate |
|---|---|---|---|---|
| FY2023 (ended Sep 24, 2023) | $7.173B | $19.34B | 37.07% | ✅ |
| FY2024 (ended Sep 29, 2024) | $10.099B | $23.93B | 42.25% | ✅ |
| FY2025 (ended Sep 28, 2025) | $10.354B | 44.35B est. | 23.34% | ✅ |
| TTM (ended Mar 29, 2026) | −$451M | ~$25.2B | −1.79% | ⚠️ |
Net income and equity figures for FY2023–FY2025 verified against SEC EDGAR XBRL data (CIK 0000804328): FY2023 stockholders' equity $21.581B / net income $7.173B; FY2024 SE $26.274B / NI $10.099B; FY2025 SE $21.206B / NI $10.354B. 45
Why the TTM ROE shows −1.79%: the tax charge explained. In Q4 FY2025 (the July–September 2025 fiscal quarter), Qualcomm recorded a $5.7B non-cash deferred tax valuation allowance charge. The mechanics: the IRS released supplemental guidance on the Corporate Alternative Minimum Tax (CAMT) — a provision of the Inflation Reduction Act — and Qualcomm concluded that a portion of its federal deferred tax assets (DTAs) might not be realizable in the foreseeable future. Accounting standards require companies to record a valuation allowance against DTAs when recoverability is uncertain, which reduces net income by the same amount — but no cash leaves the company. That single non-cash line item produced a GAAP net loss of approximately $3.12B in Q4 FY2025, dragging the trailing twelve months below zero. 3
The reversal arrived on schedule. In Q2 FY2026 (January–March 2026), the IRS issued further CAMT clarification, and Qualcomm reversed the entire $5.7B allowance — recording an equivalent tax benefit. GAAP net income for that single quarter was $7.37B. Non-GAAP net income (which strips the tax item both ways) was $2.84B — a cleaner signal of operating performance. The TTM ROE of −1.79% is therefore a statistical artifact of a one-quarter accounting charge that has already been unwound. The 3-year GAAP ROE series (37.07% → 42.25% → 23.34%) reflects genuine operating performance.
Gate 2 — Free cash flow
Loading chart…
FCF calculation: operating cash flow minus capital expenditures. 6
| Period | OCF | CapEx | FCF | YoY |
|---|---|---|---|---|
| FY2023 | $11.30B | $1.45B | $9.85B | — |
| FY2024 | $12.20B | $1.04B | $11.16B | +13.3% |
| FY2025 | $14.01B | $1.19B | $12.82B | +14.9% |
| TTM (Mar 2026) | $14.29B | $1.78B | $12.50B | — |
FCF yield: $12.50B ÷ $201.52B market cap = 6.20%. FCF margin (TTM): 28.1% — $28.10 in free cash generated per $100 of revenue. The fabless model keeps capital expenditure low (4.0% of TTM revenue); Qualcomm spends on chip design and IP, not manufacturing.
Capital returned to shareholders: TTM buybacks of $11.78B reduced shares outstanding by 3.65% year-over-year. The annual dividend is $3.68/share (1.93% yield), with 23 consecutive years of dividend growth and a payout ratio of 39.22% — leaving substantial room for future increases. Combined shareholder yield (dividends + buybacks): 5.44%, the highest in the semiconductor large-cap peer group.
Gate 3 — Valuation
The gate requires reasonable valuation relative to sector peers and the stock's own history. Both tests pass at the headline level — with one wrinkle.
vs. 5-year own history (fiscal years FY2021–FY2025): 5
| Metric | Current | 5-year avg | Δ vs avg |
|---|---|---|---|
| Trailing P/E | 20.89× | 19.44× | +7.5% |
| P/B | 7.42× | 8.76× | −15.3% |
| EV/EBITDA | 15.92× | 12.85× | +23.9% |
| P/FCF | 16.12× | 16.12× | 0.0% |
P/E sits 7.5% above its own 5-year average — essentially at parity once rounding is applied. P/B is 15% below average. P/FCF is precisely at the 5-year average. EV/EBITDA at +23.9% is the outlier, and worth watching — it suggests the enterprise value has grown relative to cash earnings faster than the P/E captures. The 5-year P/E average is distorted upward by FY2025's anomalous 33.77× reading (caused by the same tax charge suppressing GAAP earnings); excluding FY2025, the four-year average falls to 15.85×, at which baseline the current 20.89× looks 31.8% elevated. This is why valuation is classified as "reasonable" rather than "cheap": the stock is not obviously expensive on its own history, but it is not obviously cheap either.
| Ticker | Trailing P/E | Forward P/E | EV/EBITDA | FCF yield | 3Y EPS growth forecast |
|---|---|---|---|---|---|
| QCOM | 20.89× | 19.57× | 15.92× | 6.20% | 0.07% |
| AVGO | 61.93× | 23.64× | 43.14× | 1.85% | 55.73% |
| TXN | 48.20× | 34.21× | 30.65× | 1.45% | 25.91% |
| AMD | 150.86× | 51.89× | 98.14× | 1.16% | 63.08% |
| ADI | 58.46× | 28.36× | 31.96× | 2.39% | 29.52% |
| MRVL | 87.25× | 55.73× | n/m | 0.75% | 46.81% |
| Peer median | 61.93× | 34.21× | 40.97× | 1.45% | 43.57% |
On every multiple, QCOM is the cheapest semiconductor large-cap in the peer group: 66.3% discount to peer median P/E, 61.1% discount on EV/EBITDA, 4.3× the peer median FCF yield. The PEG ratio (P/E divided by forward earnings growth rate) for QCOM comes out to 7.59 — the highest in the group by a wide margin — because the denominator (0.07% EPS growth forecast) is essentially zero. This number is not a useful valuation signal here: QCOM is not a growth stock being valued on earnings expansion. It is a mature cash-flow machine valued on the absolute level of FCF it generates. At 16× P/FCF, the market is paying $16 for every $1 of free cash produced annually — the same price it has paid on average for five years.
The multiple discount relative to peers is real, but it exists for a reason: consensus analysts forecast near-zero earnings growth over the next three years, versus 43–63% for AVGO, AMD, and MRVL. The market is pricing Qualcomm as a business in structural transition whose growth catalysts are unproven, not as a steady compounder.
Revenue and earnings
Loading chart…
Five-year revenue CAGR: approximately 7.2%. 312 The trajectory is not linear — the company rode the 5G smartphone cycle to $44.2B in FY2022, contracted sharply in FY2023 as the upgrade cycle matured, then recovered. FY2025 revenue returned to $44.28B, essentially flat with the FY2022 peak, confirming that the base business has recovered. The TTM figure of $44.49B extends that.
Net income tells a different story. In FY2023, a cyclical revenue decline cut net income almost in half (-44%). The recovery in FY2024 brought net income to $10.1B, the highest in the five-year series. FY2025 net income drops to $5.54B — not because the business contracted, but because of the $5.7B tax charge. Operating income in FY2025 was $12.35B (operating margin 27.90%), broadly in line with FY2024. The TTM net income of −$451M similarly reflects the uneven timing of the tax charge/reversal across reporting windows.
Most recent quarter: Q2 FY2026 (ended March 29, 2026). Revenue $10.60B. GAAP EPS $6.82 (including a $5.33/share tax benefit from the reversal). Non-GAAP EPS $2.65, beating the consensus estimate of $2.56. 3
Segment breakdown in Q2 FY2026: smartphones $6.02B (−13% YoY), automotive $1.33B (+38% YoY, a record), IoT +27% YoY. The handset decline reflects both the end of the Apple relationship and soft overall smartphone demand. Automotive and IoT, while smaller, are both accelerating.
Gross margin has held in the 54–58% range through the cycle (FY2025: 55.43%). Operating margin has compressed from the FY2022 peak of 35.88% to 27.90% in FY2025, with TTM at 25.52%. This compression is real — it reflects the mix shift away from high-margin Apple modem revenue and toward segments that carry lower initial margins.
Balance sheet
Total debt: $15.27B (long-term $14.77B + short-term $0.50B). Cash and short-term investments: $9.80B. Net debt: approximately $5.47B. 113
| Metric | Value | Interpretation |
|---|---|---|
| Debt/equity | 0.56 | Modest leverage |
| Current ratio | 2.37 | Short-term liabilities 2.37× covered |
| Interest coverage | 16.82× | Operating income covers interest 16.8× |
| Altman Z-Score | 5.76 | Well above 3.0 distress threshold |
| Net debt/EBITDA | 1.16× | Very manageable |
Credit ratings: S&P Global rates Qualcomm's senior unsecured notes 'A' (investment grade). 14 Moody's rates the long-term debt 'A2' (investment grade, confirmed January 2026). 15 The balance sheet carries one notable item: $14.25B in goodwill from acquisitions. Goodwill is not cash-generating on its own, but it also does not affect the liquidity ratios above.
Shares outstanding declined from 1.131B in FY2021 to approximately 1.054B TTM, a reduction of 4.8% over five years. At the current buyback pace ($11.78B TTM), the company is retiring roughly 3.65% of its float annually — accreting per-share metrics even if total earnings are flat.
Competitive position and moat
Qualcomm's durable advantages sit in two distinct areas.
Patent licensing (QTL segment): Qualcomm holds foundational patents on 3G, 4G, and 5G communication standards — the underlying protocols that every cellular device must use, regardless of whose chips are inside. The QTL segment generates revenue from virtually every smartphone shipped globally, including those using rival chips. This royalty stream is largely independent of Qualcomm's chip market share. It has historically operated at gross margins above 70%.
Chip design leadership (QCT): The Snapdragon platform has held the high-end Android smartphone SoC position for over a decade through integrated CPU, GPU, modem, and AI processing. The Snapdragon X Elite platform extended this to Windows on ARM PCs, competing directly with Apple Silicon and Intel Core. In automotive, the Snapdragon Digital Chassis platform has design wins at BMW, Mercedes-Benz, General Motors, Stellantis, and others — a pipeline that CEO Amon has cited as providing revenue visibility into 2031. 3 Automotive's 38% YoY growth rate in the most recent quarter, while starting from a smaller base, represents a long-cycle business with contracted revenue that is difficult for competitors to dislodge once designed in.
The clearest competitive threat: Apple has internalized its modem supply chain, and competitors including MediaTek have gained share in mid-range Android. Qualcomm's moat in the handset segment is narrowing, not widening.
Risk factors
Apple C2 modem: the known known. iPhone 18 Pro and Pro Max, expected September 2026, will launch with Apple's in-house C2 5G modem, ending Qualcomm's 15-year iPhone modem supply relationship. 2 CEO Amon has confirmed that by 2027, Qualcomm's iPhone modem share reaches zero. Futurum Group estimated the annual revenue impact at $7.3–7.8B. The market has known about this transition for years; whether it is fully priced in is the central disagreement between bulls and bears.
China revenue concentration: Approximately 50%+ of Qualcomm's QCT revenue comes from Chinese OEMs — Xiaomi, Oppo, Vivo, Honor. This concentration creates two risks: export control escalation (U.S. restrictions on chip exports to China could limit Qualcomm's ability to sell certain chips) and customer self-sufficiency (Chinese device makers have been investing in domestic chip alternatives). The most recent semiconductor selloff was partly triggered by ByteDance announcing a custom ASIC deal, which rattled sentiment around merchant silicon suppliers. 16
Smartphone market cyclicality: The FY2022–FY2023 revenue swing (-19%) illustrated how fast handset demand can shift. Qualcomm remains highly exposed to the global smartphone replacement cycle. In Q2 FY2026, smartphone revenue declined 13% YoY — not a recovery quarter.
Arm relationship uncertainty: In December 2024, a federal jury ruled that Qualcomm did not violate Nuvia's Arm architecture license; a final judgment confirming this was issued in September 2025. Qualcomm subsequently filed an antitrust counter-suit against Arm, and regulatory investigations are pending in multiple jurisdictions. 17 The lawsuit risk has diminished substantially — Qualcomm won the core case — but the Arm counter-offensive and ongoing licensing negotiations create an unresolved overhang on the cost side of chip design.
Analyst consensus below current price: 39 analysts cover QCOM; the consensus rating is Hold, with an average price target of $180–$186 — 3–6% below the current price of $191.20. 18 The most bearish single estimate comes from Seaport Research Partners at $100 (a −47.7% implied downside). Multiple large banks downgraded QCOM in early 2026: JPMorgan (Overweight → Neutral, $140), BofA (Buy → Neutral, $155), Bernstein (Outperform → Market Perform, $140). The most bullish estimate is from Daiwa Securities at $225 (+17.7%). When 39 professional analysts — with full access to company management — produce a consensus below the current market price, that is not nothing.
Insider selling pattern: Insider ownership is 0.10%. Net insider transactions over the past several months show consistent selling: CEO Amon sold approximately $3.65M in shares (20,000 shares at $180–$185) on May 4–5, 2026; CFO Palkhiwala has sold shares on a regular monthly schedule. Virtually all of these transactions are linked to same-day option exercises at $0.00 strike, which indicates pre-programmed 10b5-1 trading plans rather than discretionary market timing. The pattern looks systematic, not signal-driven, but insider ownership at 0.10% is low for a company of this size. 18
Near-term catalysts and market context
- June 24, 2026 — Investor Day: Qualcomm will detail its data center and Physical AI roadmap. This is the single most important near-term event for the bull case. If Qualcomm can show credible contracted revenue and a product pipeline for AI inference chips, the "unproven diversification" narrative changes. If the Day produces slide decks rather than design wins, the bear case strengthens.
- July 29, 2026 — Q3 FY2026 earnings (after market close): The first quarterly read that will show Q3 results without the tax reversal noise. Non-GAAP EPS consensus stands at roughly $2.65–$2.70. Automotive and IoT segment trajectory will be watched closely.
- September 2026 — iPhone 18 launch: The formal start of the Apple modem transition. Qualcomm expects to supply modems for roughly one-fifth of the iPhone 18 lineup before going to zero in the 2027 cycle.
- ByteDance AI chip ramp: Qualcomm announced a data center AI chip engagement with a leading hyperscaler expected to produce initial shipments later in calendar 2026. CEO Amon said at Q2 earnings: "We are equally excited by our entry into the data center, where a leading hyperscaler custom silicon engagement is on track for initial shipments later this calendar year." 16 The ByteDance ASIC deal announcement in late May 2026 drove a sharp one-day rally, then was completely unwound over the following two trading days — a "sell the news" pattern suggesting the market already had the AI diversification story priced in at a higher level.
- 52-week range: $140.87 – $259.92. Current price $191.20, sitting 27% above the 52-week low and 26% below the 52-week high. RSI (14-day): 43.31 — neutral, not oversold. Short interest: 4.27% of float (45.04M shares), declining from a prior month high of 50.44M, suggesting some short covering. 18
- Dividend: annual $3.68/share (1.93% yield), 23 consecutive years of growth. Ex-date and next payment information available at investor.qualcomm.com.
Bull / bear framework
Bull case
- FCF yield of 6.20% is the honest multiple, not the P/E. The P/E is distorted by GAAP tax accounting in both directions. P/FCF of 16.12× is exactly where it has averaged over five years — and the underlying business generated $12.5B in free cash on $44.5B of revenue last year. At 6.20% FCF yield with growing automotive and IoT segments, the market is not obviously overcharging for the cash stream.
- The Apple modem loss may already be priced in. Wall Street has been modeling the Apple transition for years. A $7–8B annual revenue loss sounds alarming, but it represents approximately 16–18% of Qualcomm's $44.5B TTM revenue — and the modem business carries lower margins than QTL's licensing stream. The stock has already corrected 26% from its 52-week high. Priced-in risks tend to produce smaller sell-offs when they materialize than when they are still uncertain.
- Automotive is a credible replacement cycle. Q2 FY2026 automotive revenue of $1.33B at +38% YoY, with design wins extending through 2031, represents a segment in its early ramp. Unlike smartphones, automotive design cycles are 3–7 years — once Snapdragon Digital Chassis is designed into a vehicle platform, it is effectively locked in for the production lifetime of that platform. The royalty economics are structurally attractive.
- Diversification has real contracted revenue, not just slides. The data center AI chip engagement is confirmed (CEO on the record that initial shipments are planned for calendar 2026). Qualcomm's custom silicon work is not speculative in the same way a startup's product roadmap is.
- Capital return is a floor. At a 5.44% combined shareholder yield, QCOM is returning more than its FCF yield net of re-investment — the dividend is safe at a 39% payout ratio, and the buyback is reducing the share count. If earnings growth is flat but buybacks reduce shares by 3.65%/year, EPS grows by approximately the same amount mechanically.
Bear case
- The Apple revenue hole may be underestimated in timing. Qualcomm supplies modem chips that generate an estimated $7.3–7.8B annually from Apple. 2 Even if automotive and IoT are growing at 30–38%, they generated a combined ~$2.6B last quarter — still well below the Apple modem revenue that disappears within twelve months. The growth rate on diversification does not close the gap fast enough at current scale.
- Zero consensus EPS growth is the market's base case, not a pessimistic scenario. The 3-year forward EPS growth forecast of 0.07% is consensus — it already incorporates Qualcomm's own guidance. If the Apple modem transition runs faster than expected, or smartphone unit volumes disappoint again, this consensus number goes negative. Flat-earnings businesses that don't grow eventually see multiple compression.
- China concentration has two-sided risk. Export controls could restrict chip sales; Chinese OEMs building out domestic alternatives (like HiSilicon, funded by Huawei) could gradually reduce dependence on Qualcomm chips. The combination of regulatory risk and customer self-sufficiency in a single geography representing 50%+ of chip revenue is not a benign setup.
- Analyst consensus is below the current price. Thirty-nine analysts, average target $180–$186. When the professional consensus says the stock is 3–6% overvalued right now, the burden of proof falls on the counter-thesis. The bear end of the analyst range (Seaport at $100, Morgan Stanley at $132, Barclays at $130) reflects models that treat the Apple transition as an earnings inflection, not a priced-in event. 19
- The data center AI thesis requires execution, not just announcement. Qualcomm's hyperscaler custom silicon engagement will produce initial shipments "later this calendar year" — but ByteDance is one customer, and the announcement caused a one-day rally that was fully erased within 48 hours. The market is treating data center AI as a story to be proven, not a done deal. Barchart's analysis of the short interest ($11.8B at a decade-high) summarized the skeptic view: "The chipmaker needs to quickly deliver on its AI pivot for bulls to win." 19
This article is for informational purposes only and does not constitute investment advice. All financial data sourced from SEC filings, StockAnalysis.com, Finviz, S&P Global Ratings, and public earnings releases. Prices as of June 10, 2026 close. Investors should conduct their own due diligence before making any investment decisions.
References
- 1QCOM Statistics & Valuation — StockAnalysis
stockanalysis.com
- 2
- 3
- 4SEC EDGAR XBRL Company Facts — Qualcomm
data.sec.gov
- 5QCOM Financial Ratios — StockAnalysis
stockanalysis.com
- 6QCOM Cash Flow Statement — StockAnalysis
stockanalysis.com
- 7AVGO Statistics — StockAnalysis
stockanalysis.com
- 8TXN Statistics — StockAnalysis
stockanalysis.com
- 9AMD Statistics — StockAnalysis
stockanalysis.com
- 10ADI Statistics — StockAnalysis
stockanalysis.com
- 11MRVL Statistics — StockAnalysis
stockanalysis.com
- 12QCOM Financials & Income Statement — StockAnalysis
stockanalysis.com
- 13QCOM Balance Sheet — StockAnalysis
stockanalysis.com
- 14
- 15Qualcomm's Credit Ratings — Rating Evidence
rating-evidence.com
- 16
- 17Qualcomm Faces a Double Squeeze — ad-hoc-news.de
ad-hoc-news.de
- 18QCOM Stock Quote — Finviz
finviz.com
- 19
This story was produced automatically by a channel. One sentence is all it takes for Neodrop to keep producing for you.