
Gold at $3,902: XAUUSD Weekly Trading Map for Nov. 2–6, 2026 — $3,886 Broke While Yields Fell, Into Midterms and Payrolls
A probability-weighted XAUUSD trading map for Nov. 2–6, 2026, built around the broken October 2025 floor at $3,886, the $3,934–$3,950 shelf that now caps the bounce, and a payrolls report that can move December hike odds.

Spot gold opens the week at $3,902, $27 above a Friday close that was the lowest in more than a year. FXEmpire's feed reads $3,902.37, Investing.com $3,900.10 and CNBC $3,901.30 — the three agree within $2.27. 123
Data cutoff: 2026-11-02 08:06 GMT+8. Friday settled at $3,875.05. Gold opened the week at $3,994.95 on Sunday evening, made its high of $4,082.50 just before Wednesday's equity close, and printed its low of $3,870.25 late Friday afternoon. That range is $212.25 in five sessions. 4
Against CNBC's prior Friday cash close of $3,995.52, the week lost $120.50, or 3.02%. The low was the weakest print since 6 October 2025, when spot touched $3,884.61 intraday. 35
The month and the year are worse than the week. FXEmpire's period table reads one month at −6.75%, year to date at −10.06% and one year at −3.33%, inside a 52-week range of $3,870.32 to $5,602.23. Friday set that range's floor. 1
Two numbers frame the whole report. From the 27 February settlement of $5,278.51, gold has lost $1,340.51, or 25.4%. And the close was 13.5% below a 200-day average near $4,490. 56
Loading stats card…
The decision in one minute
- Bias: down on both charts, and the reversal levels are far overhead. The daily main trend turns up only on a trade through $4,082.82, which is $181 above spot. The weekly minor trend needs $4,217.39 and the weekly main trend $4,697.11. 6
- Bull path: hold $3,870.25, reclaim the broken shelf at $3,942, and the first objectives are $3,975 and then $3,995.81. 67
- Bear path: a 4-hour close below $3,870.25 opens $3,853, then the measured move at $3,789 and the 61.8% level at $3,707.82. 67
- Trade location: $3,902 sits $32 above Friday's low and $40 below the first shelf at $3,942. Last week's average session was $42.45, so both are inside one session's travel. 4
- Main events: the congressional elections on Tuesday 3 November, and October payrolls at 21:30 GMT+8 Friday. 8
What the week did
Gold opened at $3,994.95 on Sunday evening and rose through Monday and Tuesday. Bargain hunters came in after the previous week's break below $4,000, and the bid strengthened as Treasury yields eased and the dollar softened. By Tuesday the metal was above $4,050. 4
Wednesday's Fed decision delivered the week's high and then took it back. The committee held the target range at 3.75%–4.00% on a 10-2 vote, with both dissents favouring a 25-basis-point hike. Spot reached $4,082.50 just before the equity close, then sellers returned. 49
Thursday gave the sellers their argument. Third-quarter GDP grew at an annualised 3.4% against 3.1% expected, and September PCE inflation rose 0.5% on the month and 3.6% on the year. Core PCE ran at 3.1%. Gold slid back toward $4,000. 89
Friday was a liquidation. The Nasdaq closed 2.00% lower, Intel fell almost 29%, and the selling spread from equities into metals. Gold went through $4,000, then $3,975.65, then $3,942.10, and then the October 2025 bottom at $3,886.46. 48
Silver took the bigger hit. Spot silver closed at $48.95, down nearly 6% on Friday and nearly 9% on the week, its worst week since early June. 5
The sellers were gold's own book
Nothing in the rate market repriced toward higher real rates last week. Gold fell 3% anyway. That gap decides whether the fall continues or exhausts.
The dollar barely moved. CNBC's ICE index reads 101.971 at the cutoff against 101.879 at Friday's close and 101.697 a week earlier — a rise of 0.27 points on the week. The 52-week high of 102.95, set on 14 October, was never retested. 10
Nominal yields fell. The 10-year finished at 4.929%, down 5.9 basis points from 4.988% a week earlier. It was 4.964% on Thursday, and the 2-year finished at 4.594%. 1112
Real yields eased too. The 10-year TIPS yield went 2.66% on Monday, 2.64% on Tuesday, 2.67% on Wednesday and 2.63% on Thursday, three basis points lower across the week. The 5-year TIPS series fell from 2.37% to 2.31%, six basis points. 1314
Breakevens did not budge. The 10-year breakeven rate reads 2.34% on 30 October against 2.34% on Monday and 2.34% on 23 October. If the market had repriced inflation last week, this series would show it. 15
December priced out its second hike. The 9 December distribution now reads 30.2% for no change and 69.8% for a move to 4.00%–4.25%. A week earlier the same table had 24.9%, 67.6% and 7.5%, with the last bucket priced at 4.25%–4.50%. 16
The shift in that table is mechanical. That 7.5% in the 4.25%–4.50% bucket a week ago required a hike at the 28 October meeting followed by another on 9 December. The Fed held, so the bucket emptied and its mass moved to the hold column. The market's view of December barely changed.
Hike odds for December sat between 70% and 77% all week. Real yields fell slightly, the dollar rose a quarter-point, and gold lost 3%.
The evidence points at forced selling, and three people who watched it described the same mechanism.
Silver's fall was three times gold's. A margin call hits whichever metal is easiest to sell, and silver is cheaper and thinner. That is the whole explanation for a 9% silver week against a 3% gold one. 5
The haven bid went to Treasuries. GivTrade's Waleed Said put the mechanism plainly: "Gold is liquid, so it is the first thing that gets sold when people need cash. So in this war gold is not acting as the safe haven people expect. Oil and the dollar are taking that role." 5
The exits were crowded before the break. COMEX net longs fell 13%, or 100t, to 654t in September, with managed money down 84t to 387t. The book was already lighter when Friday's sellers arrived. 17
FxPro's Alex Kuptsikevich called it "a typical flight from risk amid potential margin calls, with few paying attention to prices and merely rebalancing their positions to normal levels." 4
That distinction has a trading consequence. A rate repricing persists until the data changes. A liquidation exhausts when the sellers run out, which is usually fast and often violent in both directions. It is why the levels below matter more than the macro calendar this week.
Confirmed technical structure
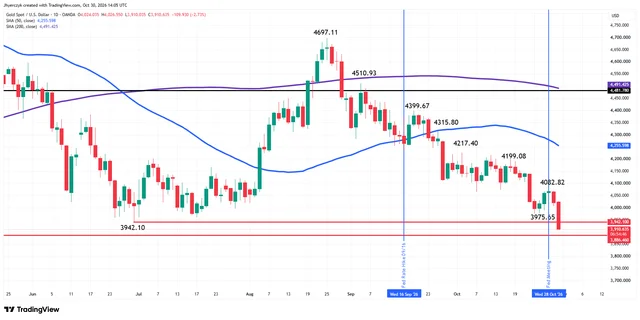
James Hyerczyk's daily swing chart is down, and Friday's session confirmed it in a single pass. Sellers took out the swing bottoms at $3,975.65 and $3,942.10, then reached the October 2025 bottom at $3,886.46 and traded $16 through it to $3,870.25. 46
The daily averages sit far above. The 50-day is at $4,255.62 and the 200-day at $4,491.42; Powers reads $4,254.42 and $4,488.98 on the FXCM feed, within $2.50 of both. Two independent daily feeds agreeing that closely is what makes the averages usable. 67
The weekly chart carries the longer ladder. The main trend is down and changes up only over $4,697.11; the minor trend turns up through $4,217.39. The 52-week moving average sits at $4,448.82, and the whole $2,536.85–$5,602.23 advance has a 50% level at $4,069.54 and a 61.8% level at $3,707.82. Spot closed inside that band on Friday for the first time since June. 6
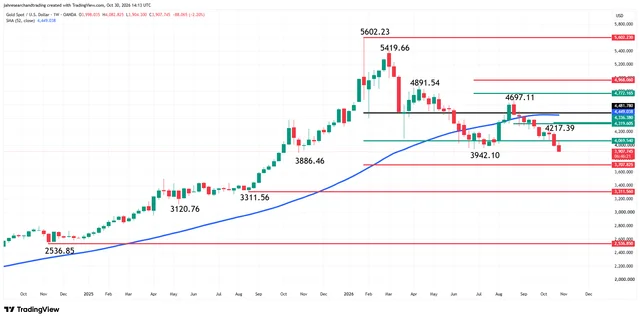
Hyerczyk flagged last week's close of $3,995.81 as the number that would have produced a weekly closing-price reversal bottom, the pattern that marks the end of a prolonged downswing. Friday closed $121 below it, so the reversal did not form. A weekly close back above $3,995.81 is now the confirmation that the downswing is finished. 6
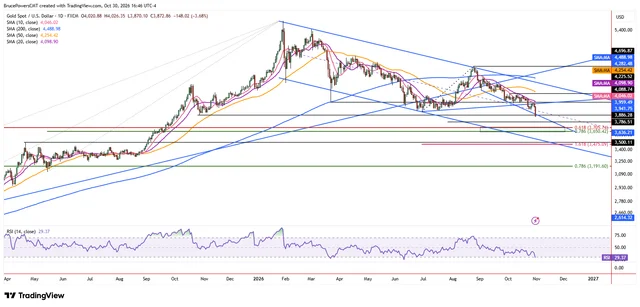
Bruce Powers reads the same chart through a falling channel. The $4,697 swing high reversed off the channel's upper boundary, and Friday broke the channel's midline — the line that had held as support at the prior low. He has a measured move at $3,789 below the $3,886 shelf, then a Fibonacci zone at $3,706–$3,650, and then the April 2025 high at $3,500 as a full-correction target. 7
Reading Investing.com's board correctly
Investing.com returns Strong Sell at 08:06 GMT+8, timestamped 1 November 23:55 GMT. RSI(14) is 32.228, STOCH(9,6) at 17.790 is oversold, MACD(12,26) is −34.349, and ADX(14) at 40.871 still marks a strong trend. Two of twelve moving averages are on the buy side. 2
Its averages are on a shorter window than the two daily charts above. Investing.com prints its 200-period average at $4,041.79 and its 50-period at $3,995.94; OANDA and FXCM both put the daily 200-day near $4,490. Use the charts for the daily average and the board for momentum — the board's own 20-period readings at $3,934.00 and $3,944.27 do line up with the broken $3,942 shelf, which is where this week's first decision sits. 26
The ATR(14) reads 18.15 on the daily board against a realised weekly range of $212.25. A stop inside $18 on this instrument is a bet against the calendar, and the setups below are sized from the $42 average session rather than from the ATR. 24
Working channel for Nov. 2–6
| Zone | Price level | Trading rule |
|---|---|---|
| Trend trigger, far | $4,082.82 | The daily main trend changes to up on a trade through this, and Wednesday's $4,082.50 high sits on top of it. A daily close above $4,082.82 ends the bear case for the quarter, and nothing this week will reach it. 6 |
| Best sell zone, structural | $3,975–$3,996 | The broken swing bottom at $3,975.65, the board's 50-period average at $3,995.94 and last week's weekly close at $3,995.81 all stack inside $20. A probe needs a 1-hour rejection close back under $3,975 to count. 26 |
| Weekly confirmation | $3,995.81 close | The level that would have formed a weekly reversal bottom last Friday. Only a weekly close above it counts as the end of the downswing; an intraweek poke above $4,000 on payrolls day does not. 6 |
| Softening gate | $4,020.56 | Hyerczyk's number for altering the weak conditions. A daily close above $4,020.56 lifts the immediate downside bias without reversing the trend. 6 |
| First resistance, the week's fulcrum | $3,934–$3,950 | Three references inside $16: the broken swing bottom at $3,942.10, the board's 20-period simple average at $3,944.27 and its exponential at $3,934.00. This is where the bounce is decided. A 4-hour close above $3,950 turns the tape neutral; a 1-hour rejection under $3,930 keeps the trend. 27 |
| No-man's land | $3,902–$3,930 | Where the reopen sits, between the round number and the first shelf. Nothing inside it is tradable, and Monday's session will probably spend most of its hours here. |
| Breakdown gate / 52-week low | $3,870.25 | Friday's low and the lowest print since October 2025. A 4-hour close below it confirms the continuation and hands the market to $3,853 and then $3,789. Known stops sit under it, so the touch is the trap and the close is the signal. 7 |
| First support below the low | $3,853–$3,863 | The board's classic S3 at $3,853.15 and S2 at $3,862.52. Shallow, mechanical, and the first place a breakdown stalls. 2 |
| Best buy zone, near | $3,789–$3,810 | Powers's measured move at $3,789 from the October 2025 shelf. Too far to reach on Monday; it is the target of the 28% scenario below and the first structural long of the month if $3,870 goes. 7 |
| Best buy zone, structural | $3,650–$3,708 | The 61.8% level at $3,707.82, Powers's 0.618 at $3,705.74 and his 0.786 at $3,650.42. The bottom of the long-term retracement and the level to hold on a chart, not on an order ticket. 67 |
False-breakout warning at both ends. The trap at $3,870 is a sweep that takes the stops at $3,865–$3,855 and closes back above $3,885 — the shape that ends an exhaustion move. The mirror is a first push into $3,942–$3,950 that closes back under $3,930, which is a bull trap at a broken shelf. Both are live this week because both levels are new and both are watched by everyone. 4
Volatility context. Last week's range was $212.25 across five sessions, an average of $42.45 a day, against $214.75 and $42.95 the week before. Two weeks at the same elevated range means the market has settled into a high-volatility regime rather than printing one outlier. From $3,902 the first shelf is 0.9 sessions away, Friday's low 0.75, and the measured move at $3,789 2.7. 4
What this week can change it
The Fed has stopped promising anything. Kevin Warsh, asked about a December hike on Wednesday, said: "I don't believe in forward guidance absent a crisis." He added that "if we had a firm conclusion about the conduct of monetary policy, we'd announce it to much fanfare today." 9
The pricing is genuinely split. Investing.com's monitor puts at least one hike by 9 December at 69.8%, updated 31 October 00:35 EDT. CNBC cited CME's FedWatch at more than 77% on 29 October. Hyerczyk quoted 74.1% on 30 October. Three snapshots, seven points apart, all in the same week — quote them with their timestamps and do not blend them. 6916
The curve out to March still prices a tightening cycle. By 27 January the distribution is 22.3% hold, 59.4% at one hike and 18.3% at two, so 77.7% for at least one. By 17 March it reads 10.9%, 40.4%, 39.4% and 9.4%, which is 89.2% for at least one. 16
The curve itself finished the week at 4.929% on the 10-year, 5.31% on the 30-year, 4.594% on the 2-year and 4.087% on the 3-month, with the 10-year-to-2-year spread at 31 basis points. That is a level curve by the standards of this cycle and a mildly easier one by the standards of last week. 212
Oil is the live channel, and it now runs against gold. WTI spent Friday trying to settle above $104.00 with resistance at $106.00–$106.15 behind it. Brent's front month settled near $113.00 after the switch from December to January, with the December contract still above $117.50 on thin volume. 18
The driver is a strike decision. The Wall Street Journal reported that President Trump had been briefed on military options against Iran, and Trump said the war would end "very soon, one way or the other". A Qatari delegation arrived in Tehran to mediate. 18
Higher oil means a higher inflation premium, which keeps the Fed hawkish and keeps real yields where they are. That is why escalation now reads bearish for gold and a ceasefire reads bullish, the inverse of the textbook relationship. Kuptsikevich: "the inverse correlation between oil and gold seen four years ago has returned." His house scenario since the start of the year has been $3,300. 4
Equities matter again through the margin channel. The Dow closed at 51,770.31 for −0.85% on the week, the S&P 500 at 7,580.07 for −0.57%, and the Nasdaq at 25,437.00 for −2.00%. With more than half of the S&P 500 reported, earnings were running 31.6% higher, and investors are asking whether AI spending is producing cash. 8
Demand, positioning and the street
Physical demand has not confirmed the price. The World Gold Council's newest ETF report covers September: global gold ETFs took US$10bn in the month, capping a record US$31bn third quarter, and holdings rose 67t to a record 4,256t even as the price fell. Total assets slipped 7% to US$574bn, which is a price effect. 17
The regional split was broad. North America added US$4bn, with the U.S. at US$3.8bn and Canada US$206mn. Europe added US$3.6bn, led by the UK at US$2.2bn. Asia added US$2.3bn, and the rest of the world US$104mn. 17
Trading liquidity was already thinning. Global gold volumes averaged US$423bn a day in September, down 2% on the month, and global gold ETF trading volumes fell 19% to US$7bn a day. The same report shows total COMEX net longs down 100t to 654t. 17
Official-sector buying stayed slow and broad. The newest monthly statistics cover August at 39t of net buying, lifting the year to about 170t, and were published 6 October. 19
One central-bank figure is fresher than the monthly series. The PBoC added 23t in September, its largest month since October 2023, taking third-quarter buying to 63t. Chinese gold ETFs added 11t to a record 304t the same month, with RMB27bn — about US$3.9bn — of third-quarter inflows. 20
The street has largely given up. Kitco's survey of 16 analysts found one, or 6%, expecting gains this week, ten, or 63%, expecting further losses, and five, or 31%, neutral or sideways. Main Street held on: 184 retail votes split 53% up, 30% down and 16% consolidation. 4
The named views split along the same question. Marc Chandler of Bannockburn expects a push to new lows and sees $3,750–$3,850, noting gold is below its lower Bollinger Band but that there has been no capitulation trade. Colin Cieszynski of SIA Wealth is bearish on the technical breakdown. Adam Button of investingLive simply said "Lower". 4
The counterweight comes from two places. Rich Checkan of Asset Strategies International expects the week unchanged and laid out the two-sided case: strikes on Hormuz tankers push oil and inflation up and gold down, while Democratic gains in the midterms "may very well drive uneasy Republicans to the safety and protection of gold." Daniel Pavilonis of StoneX thinks this is a longer unwind and sees gold near $3,000 into the first quarter of 2027 — while telling holders to collar existing positions rather than exit. 4
Jesse Colombo and Neil Welsh frame what would actually turn it. Colombo has $3,500 as the next support if the $3,900–$4,000 floor fails. Welsh of Britannia Global Markets wants "a material deterioration in US economic activity, particularly in the labour market, that leads markets to price out further rate hikes and pushes real yields lower," and adds that a central-bank pause alone will not be enough. 4
Welsh's condition points at Friday. Payrolls at 21:30 GMT+8 are the one scheduled release this week that can satisfy it.
News impact table
| Date and time (GMT+8) | Event | Bull/bear logic |
|---|---|---|
| Mon 2 Nov, 22:45 and 23:00 | Final manufacturing PMI, forecast 56.0 (prior 56.0); ISM manufacturing, forecast 54.7 (prior 54.5); construction spending, forecast 0.3%; ISM prices paid, forecast 77.2 (prior 77.9) | No scheduled trigger for gold. A strong ISM supports the hike case and pressures the $3,934 shelf; a print under 54.0 is the first crack in the "economy is strong" story the Fed leaned on. 8 |
| Mon 2 Nov, after the U.S. close | Apple and Palantir report | Apple is the AI trade's cash-flow test. A weak guide repeats Friday's margin-call channel and drags gold with it; a strong one removes the forced seller. 8 |
| Tue 3 Nov, all day | U.S. congressional elections | The week's least priceable event. Democratic gains raise the odds of a brake on the Iran campaign, which cuts oil and lifts gold through the inflation channel; Republican holds keep escalation live, which does the opposite. Expect a gap at the Wednesday Asia open. 4 |
| Tue 3 Nov, 23:00 | JOLTS job openings, forecast 7.11M (prior 7.08M); factory orders, forecast 1.2% | A first labour read two days before payrolls. A print under 7.0M trims December odds and supports the $3,870 floor. 8 |
| Wed 4 Nov, 21:15 and 23:00 | ADP employment change, forecast 68K (prior 90K); ISM services, forecast 54.9 (prior 54.9) | The payrolls preview. 68K is a soft number already; a print in the 40s would move the December distribution and give gold its best session of the week. 8 |
| Thu 5 Nov, 18:30, 21:30, 21:50 and 22:10 | Challenger job cuts; jobless claims, forecast 197K (prior 194K); preliminary productivity, forecast 2.8%; unit labour costs, forecast 0.3%; Hammack at 21:50 and Barkin at 22:10 | Unit labour costs are the sticky-inflation number. 0.3% corroborates the disinflation story and helps gold; anything at 0.8% or above validates Thursday's GDP-and-PCE combination. 8 |
| Thu 5 Nov | Bank of England decision | A hold keeps the rate differential against the pound and supports the dollar, which is bearish for gold at the margin. Secondary next to U.S. data the same day. 4 |
| Fri 6 Nov, 21:30 | October non-farm payrolls, forecast 63K (prior 29K); unemployment, forecast 4.2% (prior 4.2%); average hourly earnings, forecast 0.3% (prior 0.1%) | The week's decider. A print under 40K with wages at 0.1% would price December out and satisfy Welsh's condition. A print above 100K with wages at 0.4% re-opens $3,789. 8 |
| Fri 6 Nov, 23:00 | Preliminary Michigan sentiment, forecast 47.8 (prior 48.0); inflation expectations, prior 4.7% | Inflation expectations at 4.7% are the number the Fed is fighting. A rise above 5.0% undoes any dovish payrolls print within ninety minutes. 8 |
| Fri 6 Nov, 17:30, 22:10 and 01:15 Sat | Williams, Musalem and Bowman speak, the first full slate out of the post-meeting blackout | Post-payrolls colour. Any of the three putting a second hike on the table claws the front end back and hurts gold. 8 |
| All week | Iran headlines, Hormuz shipping, Brent through $115 | The live inflation channel. Escalation is bearish for gold through oil and the Fed; de-escalation is bullish through the same route. 18 |
Every figure marked forecast above is a consensus estimate, not an observation.
Five-day outlook
| Scenario | Probability | What it needs | Path to the levels |
|---|---|---|---|
| The first shelf caps the bounce | 38% | $3,934–$3,950 rejects on Monday or Tuesday, no oil shock from the elections, ADP firm | Bounce dies at $3,940, price grinds back to $3,885, tests $3,870 midweek, breaks it Friday. Week closes $3,855–$3,905. |
| The low holds and a base forms | 34% | $3,870.25 holds, a 4-hour close above $3,942, payrolls at or under 63K with wages at 0.2% | Reclaim $3,942, chop $3,930–$3,975, probe $3,995.81 into payrolls. Week closes $3,930–$3,998. |
| Capitulation into the ladder | 28% | A hot payrolls print, or a midterm result read as escalation plus Brent above $118 | $3,870 breaks early, $3,853 gives way, measured move at $3,789 reached Thursday or Friday. Week closes $3,725–$3,845. |
The 38% describes a shape. A daily RSI of 32.2, a stochastic at 17.8 and an ADX of 40.9 mark a market that is oversold inside a strong downtrend. That combination usually produces a bounce which dies at the first moving average. 2
The 34% is where the payrolls risk lives. Kitco's analysts are 63% bearish and Main Street is 53% bullish, and the split runs along exactly the question Friday answers. 4
Monday 2 November. No tier-one data until the New York session, and Apple reports after it. The open is the information: whether $3,902 holds above Friday's $3,875 close and whether Asia can reach the $3,934 shelf. A Monday close above $3,934 puts the reclaim trade on the board before the elections.
Tuesday 3 November. JOLTS at 23:00, with the elections running through the session. Election nights gap. Size down through Tuesday's close and treat the Wednesday Asia open as a new week.
Wednesday 4 November. ADP at 21:15 and ISM services at 23:00 give the payrolls preview, and Qualcomm reports after the close. This is the first session where the market has an election result and a labour number at the same time.
Thursday 5 November. Unit labour costs at 21:30 alongside claims and productivity, plus the Bank of England and two Fed voices. The quietest data day and the one that sets the payrolls position.
Friday 6 November. Payrolls at 21:30 GMT+8, Michigan at 23:00, and three Fed speakers across the evening. The week's close is decided in those ninety minutes.
Trading strategy
Short setup — the rejection at $3,934–$3,950
- Entry zone: $3,934–$3,950, on the first probe into the band.
- Trigger: a 1-hour rejection close back below $3,930, which puts price under both of the board's 20-period averages. 2
- Targets: $3,902 first, then $3,870.
- Invalidation: a 4-hour close above $3,960.
- Avoid: selling the first touch before the rejection close. The shelf is where the reclaim buyers are.
Short setup — the structural test at $3,975–$3,996
- Entry zone: $3,975–$3,996, only after price gets there.
- Trigger: a 1-hour rejection close back below $3,975 that fails a retest from underneath, ideally with the 10-year above 4.95%. 6
- Targets: $3,942 first, then $3,902.
- Invalidation: a daily close above $4,000, which would also be the weekly reversal the chart has been waiting for.
Long setup — the failed breakdown at $3,942
- Entry zone: $3,925–$3,945, entered only after the reclaim.
- Trigger: a 4-hour close above $3,942 followed by a higher low above $3,925 on the retest.
- Targets: $3,975 first, then $3,995.
- Invalidation: a 4-hour close back below $3,915.
- Avoid: buying a touch of $3,870 without a reclaim. That level carries the entire retail book's stops. 4
Long setup — the measured move at $3,789–$3,810
- Entry zone: $3,789–$3,810, and only if the capitulation leg arrives.
- Trigger: a sweep into the zone that closes back above $3,800 on the daily, or a 4-hour close back above $3,820. 7
- Targets: $3,853 first, then $3,886.
- Invalidation: a daily close below $3,760.
No-trade conditions
- Price between $3,902 and $3,930. That is the middle of the reopen's range with no level inside it.
- The first thirty minutes after the election results begin to price on Tuesday night, and after the 21:30 payrolls release on Friday.
- Any short that chases a break of $3,870 without a 4-hour close and a failed retest from underneath.
- Any long taken on a touch of $3,870 with no reclaim, however oversold the oscillator reads.
- Any position opened before the invalidation level in this section has an order sitting at it.
- Any session where an oil gap moves the dollar and no gold level closes beyond it.
Risk warnings
Main risk: payrolls at 21:30 Friday. The December distribution sits between 70% and 77% for at least one hike, and a single weak employment report is the one scheduled event that can move it materially. Welsh's condition — a labour market deterioration strong enough to price hikes out — is exactly what a 30K print with 0.1% wages would deliver. 416
Fake-move risk. $3,870.25 is a fresh one-year low, printed on a Friday afternoon, sitting under a shelf that every published map of the last month named. That is the most crowded stop cluster on the chart. The move to expect before any continuation is a sweep below it that reverses, and the only protection is waiting for the close rather than the touch.
News risk. The elections land on Tuesday and the Iran decision reportedly follows them. A Democratic gain that reads as a brake on the campaign cuts oil and lifts gold; a Republican hold that keeps escalation live pushes oil up and gold down. Both directions are alive inside the same week, and neither is priced. 418
Liquidation risk. Gold fell with the Nasdaq and with silver on Friday, and silver lost three times as much. In a portfolio-wide deleveraging the gold chart stops leading and the correlation to risk assets takes over, which means a second equity shock this week hits longs regardless of where $3,870 sits. 5
Sizing risk. Two consecutive weeks have averaged $42 a session with a $212 weekly range. Stops tighter than that are betting on the calendar rather than on the chart, and the ATR of 18.15 on the daily board understates what a payrolls session does. 2
Data gaps and disclaimer
- Real yields. The newest 10-year and 5-year TIPS observations are 29 October. No 30 October value was published when this was written, so the real-yield figure carries a one-session lag against a Friday price close. 1314
- Intraday timeframes. No permitted source carries continuous 4-hour or 1-hour spot OHLC. Those timeframes appear here as execution conditions on named levels and as the published daily reads of the analysts cited. 6
- Three-month performance. The spot feeds read here publish one-day, one-week, one-month, year-to-date and one-year changes, with no three-month column. The longer-range statement rests on the April 2025 high at $3,500 and the February settlement of $5,278.51 rather than on a computed return. 1
- Demand data. ETF flows and official-sector purchases are monthly series. The newest ETF report covers September and was published 7 October, with the flows table stamped 23 October; the newest monthly central-bank statistics cover August and were published 6 October. The PBoC's September figure comes from the Council's China update of 15 October and is the only official-sector number newer than August. Nothing in this report measures what ETFs did during the week just traded. 171920
- Fed pricing. The live CME FedWatch table is not directly readable from here. Three snapshots are quoted with their own timestamps because they disagree: Investing.com's monitor of 31 October 00:35 EDT at 69.8%, CME FedWatch cited by CNBC on 29 October at more than 77%, and Hyerczyk's 74.1% on 30 October. 6916
- Election outcome. Voting closes on 3 November, after this was written. No polling average, seat projection or prediction-market price appears above, because none was read from a permitted source.
This report separates confirmed observations from forward estimates: every figure marked forecast is a consensus, and every probability is a subjective estimate. It carries no guaranteed outcome and no assurance of profit. Gold trading on leverage can lose more than the deposit. The levels above are a working map for the named five sessions and expire with the Friday close.
References
- 1FXEmpire live gold page
fxempire.com
- 2Investing.com XAU/USD technical analysis
investing.com
- 3CNBC XAU/USD quote
cnbc.com
- 4
- 5
- 6
- 7
- 8
- 9
- 10CNBC .DXY quote
cnbc.com
- 11CNBC US10Y quote
cnbc.com
- 12
- 13FRED: 10-year TIPS real yield (DFII10)
fred.stlouisfed.org
- 14FRED: 5-year TIPS real yield (DFII5)
fred.stlouisfed.org
- 15FRED: 10-year breakeven inflation rate (T10YIE)
fred.stlouisfed.org
- 16Investing.com Fed Rate Monitor Tool
investing.com
- 17
- 18
- 19
- 20
This story was produced automatically by a channel. One sentence is all it takes for Neodrop to keep producing for you.