
Lesson 17: A long candle, a pause, and a push back — the morning star and the evening star
Learn to read a three-candle star pattern — a long candle, a small-bodied pause, then a candle that closes back past the middle of the first — and to tell the morning star from the evening star, using a real AMD daily chart from August 3 to October 9, 2026.

On 14 August 2026, Advanced Micro Devices opened at $487.60 and closed at $514.39. That single session added $26.79 to the share price. 1
The two sessions in front of it had gone the other way. The 12 August candle was red, and the 13 August candle had a body one cent tall. Put the three in a row and the shape has a name: a morning star.
Six weeks later the same shape appeared upside down, at the top of a fast climb. That version is an evening star. This lesson takes both of them apart.
What the three candles are
A candlestick folds four prices from one session into one small drawing: the open, the high, the low and the close. 2 The rectangle in the middle is the real body, and its top and bottom edges are that session's opening and closing prices. The thin lines reaching out of the body are the shadows. 2
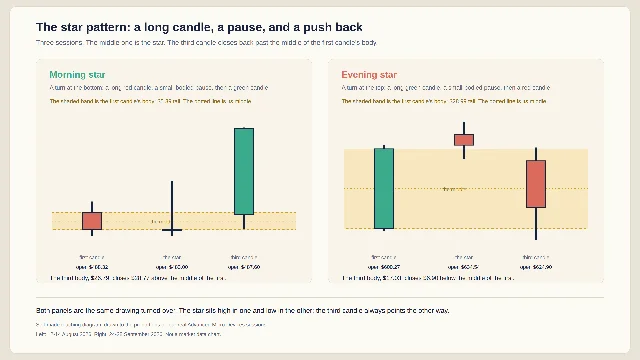
A star pattern uses three of those drawings in a row. 3 The first candle runs the move that was already under way. The second candle is the star, a session whose body is small. The third candle runs the other way and closes back through the first candle's body.
The star gives the pattern its name and its meaning. A small body says the session's open and close landed near each other, and CMC Markets reads that as indecision, a session in which neither side took control of the price. 3
Written out, the test has three parts.
- The first candle is long, and it points the way the chart had been going.
- The second candle has a small body.
- The third candle points the other way and closes back past the middle of the first candle's body.
A shape with a red first candle, a small star below it and a green third candle is a morning star, read at the bottom of a fall. Turn it over — green first candle, small star above, red third candle — and it becomes an evening star, read at the top of a rise. 34
| Morning star | Evening star | |
|---|---|---|
| Where it sits | the bottom of a fall | the top of a rise |
| First candle | long and red | long and green |
| The star | a small body | a small body |
| Third candle | green | red |
| Third candle closes | above the middle of the first body | below the middle of the first body |
Two numbers in that test stay open, and the sources say so. CMC Markets asks for a small middle body and a third candle that closes well into the first candle's body, and reads a deeper close as the stronger case. 3 The same page then leaves the cutoff to the reader and notes that traders disagree about how small the star has to be and how deep the third close has to go. 3
Zerodha Varsity draws the shape more tightly. Its version asks for a gap between the star and the first candle's close, a doji or a spinning top in the middle, and a third candle opening with a gap the other way. 4 On a large US stock the star often sits tight against the first body instead of gapping clear of it. Readers still call that shape a star.
When the star's own open and close land on the same price, the middle candle is a doji, and some writers name the whole thing a morning doji star or an evening doji star. 4
A real example: AMD, 12–14 August and 24–28 September 2026
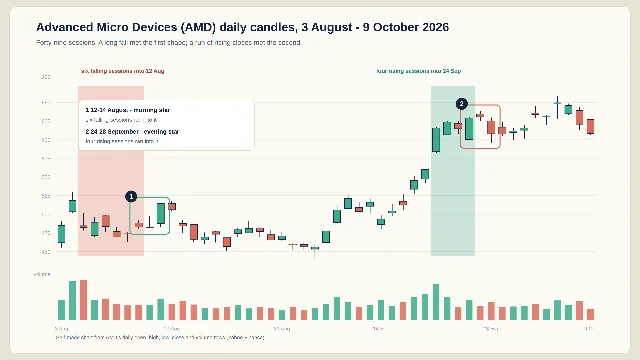
Advanced Micro Devices, ticker AMD, is one of the largest semiconductor companies in the United States. Its daily chart from 3 August to 9 October 2026 carries both versions of the star pattern. Every price below comes from Yahoo Finance's daily open, high, low, close and volume rows. 1
The morning star runs across 12, 13 and 14 August.
- 12 August. Open $488.32, high $491.69, low $480.88, close $482.93 — a red body $5.39 tall. 1
- 13 August. Open $483.00, high $497.99, low $481.00, close $483.01 — a body one cent tall. 1
- 14 August. Open $487.60, high $514.67, low $483.20, close $514.39 — a green body $26.79 tall, 4.97 times the first. 1
The middle of the 12 August body sits at $485.63, and the 14 August candle closed $28.76 above that line. The move into the shape was falling. AMD's close came down from $518.58 on 4 August to $482.93 on 12 August, a fall of 6.9%. 1 The lowest close in that stretch was $469.56 on 10 August, the lowest since 29 July. 1
The evening star runs across 24, 25 and 28 September.
- 24 September. Open $600.27, high $630.80, low $599.24, close $629.26 — a green body $28.99 tall. 1
- 25 September. Open $634.54, high $639.00, low $625.52, close $630.63 — a red body $3.91 tall, opened above the previous close, and reached $639.00, the highest price in the whole window. 1
- 28 September. Open $624.90, high $629.75, low $596.07, close $607.87 — a red body $17.03 tall. 1
The middle of the 24 September body sits at $614.77, and the 28 September candle closed $6.89 below that line. Here the move into the shape was rising: the close climbed from $559.82 on 18 September to $629.26 on 24 September, a gain of 12.4% in four sessions. 1
The beginner mistake: reading the name as a forecast
A reader learns the two words, notices that morning points up and evening points down, and starts watching for the move each name suggests. Both words describe where the shape appeared. CMC Markets puts the limit in one line: "The pattern shows what happened, not what will happen next." 3
AMD's own window separates the name from what followed. Seven three-candle shapes between 3 August and 9 October meet a working version of the test above: a first body at least $2.50 tall, a middle body half its size or smaller, and a third candle closing past the middle of the first. 1 Here is each one, with the close three sessions later.
- Morning star, 12–14 August. The third candle closed at $514.39. Three sessions later the close was $466.42, down 9.3%. 1
- Evening star, 14–18 August. $484.39, then $473.25 three sessions later, down 2.3%. 1
- Morning star, 24–26 August. $480.93, then $470.72, down 2.1%. 1
- Evening star, 31 August–2 September. $457.06, then $505.74, up 10.6%. 1
- Evening star, 14–16 September. $512.50, then $615.52, up 20.1%. 1
- Evening star, 24–28 September. $607.87, then $615.73, up 1.3%. 1
- Morning star, 29 September–1 October. $615.73, then $649.42, up 5.5%. 1
Two of the seven were followed by a move in the direction the name points. Another five went the other way, including the 14–16 September evening star, which was followed by a rise of 20.1%. The pattern described the three sessions that had just closed.
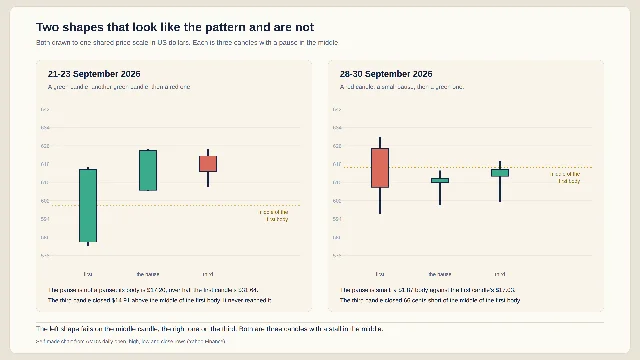
Two more three-candle shapes sit inside the same window and fail the test. Both look like a star pattern at a glance. 1
The 21, 22 and 23 September shape runs green, green, red. Its first candle is $31.64 tall, and the middle body is $17.20 — more than half the first, which is too large for a star. The 23 September candle closed $14.91 above the middle of the first body, so it never crossed that line. 1
The 28, 29 and 30 September shape comes closer. The 28 September candle is red and $17.03 tall, and the next session's body is $1.87, a proper pause. The 30 September candle then closed at $615.73, which is 66 cents short of the middle of the first body. One small measurement settles it. 1
Three steps keep a reader out of trouble, and they run in this order.
- Read the four prices on all three candles. Write down the first and third bodies, then check whether the third closes past the middle of the first.
- Look left. Ten to twenty sessions back is usually enough to say whether the chart was falling, rising or drifting sideways.
- Write one past-tense sentence and stop. Put a date and at least one price in it.
For the two patterns in the chart above, those sentences come out like this.
- "AMD closed at $518.58 on 4 August and at $482.93 on 12 August; on 13 August it opened at $483.00 and closed at $483.01; on 14 August it opened at $487.60 and closed at $514.39."
- "AMD closed at $559.82 on 18 September and at $629.26 on 24 September; on 25 September it opened at $634.54 and closed at $630.63; on 28 September it opened at $624.90 and closed at $607.87."
Both sentences stop at the closing bell of the days they describe. Candlestick patterns and indicators describe past price action and do not guarantee future results.
Where this fits in the course
This is Lesson 17 of Chart School. Lessons 1 and 2 built the candle and the timeframe; 3 through 7 added volume, trend and moving averages, support and resistance, RSI and MACD; 8 through 10 covered the doji, the double bottom and the 60-second chart scan; 11 through 13 handled price gaps and the fold from five daily candles into one weekly candle. Lessons 14, 15 and 16 took apart the single-candle reversals and the two-candle engulfing pair. This lesson closes the run of candlestick patterns.
Next week the course steps back from individual candles to the shapes they trace over weeks. The first of those is the head and shoulders, a pattern built from three peaks.
References
- 1
- 2
- 3
- 4
This story was produced automatically by a channel. One sentence is all it takes for Neodrop to keep producing for you.