Lesson 12: When an opening gap closes inside the same candle
Learn to separate an opening gap from a full-session gap, using annotated IBM daily candles and volume from August 28–September 4, 2026.

A new candle can begin above or below the previous candle's range, then spend the rest of the session back inside that range. That first jump is an opening gap. The full-session test asks a second question: did the entire next candle stay outside the earlier range?
Start with two checks
A price range is the space from a candle's low to its high. The previous high is the highest price in the earlier session. The previous low is the lowest price. The next open is the price where the later session begins.
The first check compares the next open with the previous range:
- An opening gap up begins above the previous high.
- An opening gap down begins below the previous low.
The second check uses the later candle's full range. For an up move, check the later low. For a down move, check the later high. A later low that falls into the previous range turns the opening jump into an opening gap only. A later high that stays below the previous low leaves a full-session gap down.
A timeframe tells you how much time one candle represents. On a daily chart, each candle covers one trading day. On a weekly chart, each candle covers one trading week. Read the timeframe before you describe the gap. Interactive Brokers' basic chart-reading lesson also places a candle's body, shadows, open, close, and surrounding trend in the same reading context. 1
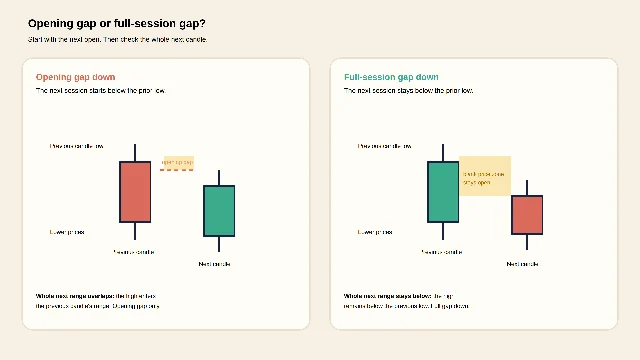
The small habit is simple: open first, whole range second. The open tells you that a jump happened. The later high or low tells you how long the separation lasted.
Volume adds context, not a verdict
Volume is the number of shares traded during a particular period. A daily volume bar belongs to one daily candle. A taller nearby bar means more shares changed hands during that session than during a shorter bar. Fidelity recommends comparing volume with a prior period, an average, or another stated benchmark. 2
For a gap, place the volume bar beside the price comparison. Record whether the opening jump came with more or fewer shares than the neighboring sessions. That record describes activity around the gap. Volume remains a description of the past; it cannot promise what the next candle will do.
A real example: IBM from August 28 through September 4
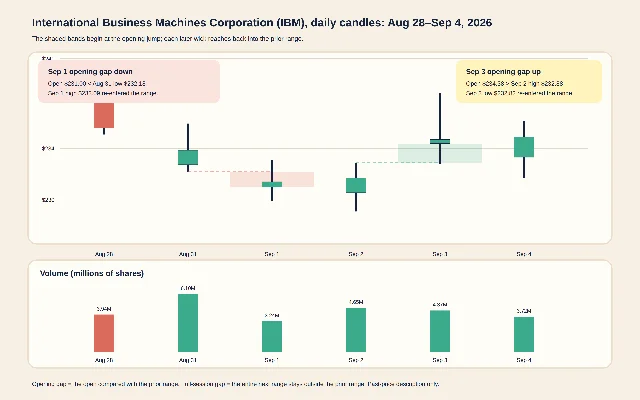
International Business Machines Corporation, ticker IBM, provides a recent example with both kinds of opening jump. The chart uses the daily Open, High, Low, Close, and Volume rows displayed by Yahoo Finance for August 28 through September 4, 2026. Yahoo Finance labels the history as daily stock data and lists those fields for IBM. 3
September 1: the opening gap down closes into the range
IBM's August 31 candle reached a high of $235.94 and a low of $232.18. IBM opened at $231.00 on September 1, below the August 31 low. That opening comparison qualifies as an opening gap down.
The September 1 high reached $233.09. Because $233.09 rose above the earlier $232.18 low, the full September 1 range entered the August 31 range. The chart therefore records an opening gap down that overlapped during the session, rather than a full-session gap down. IBM closed at $231.40, with 3,236,800 shares reported. 3
The volume bar gives the price jump a little more context. September 1's 3.24 million shares were fewer than August 31's 6.10 million shares. The comparison describes the two sessions' reported activity. The comparison does not rank the two gaps or predict a later move. 3
September 3: the opening gap up also overlaps
IBM's September 2 candle reached a high of $232.88 and a low of $229.10. IBM opened at $234.38 on September 3, above the September 2 high. That opening comparison qualifies as an opening gap up.
The September 3 low reached $232.82. That low slipped just below the earlier $232.88 high, so the September 3 range overlapped the September 2 range. The chart records an opening gap up that closed into the prior range during the session. IBM closed at $234.71, with 4,371,500 shares reported. 3
The September 3 volume was 4.37 million shares, compared with 4.65 million on September 2. The volume bars help you describe the activity beside the opening jump. The bars remain historical measurements rather than a forecast. 3
The two IBM examples make the distinction visible:
- Compare the next open with the previous high or low.
- Check the later candle's opposite extreme.
- Call the move a full-session gap only when the later range stays outside the earlier range.
- Read the volume bar as the number of shares traded during that session.
The close adds one more fact. IBM's September 1 candle closed at $231.40, above its $231.00 open. IBM's September 3 candle closed at $234.71, above its $234.38 open. Both candles finished above their own opens, even though one began below the prior range and the other began above it. Candle color describes the open-to-close relationship. Gap direction describes the relationship between neighboring ranges.
The beginner mistake: stopping at the open
The common mistake is to see an open below the prior low and immediately label the whole session a full gap down. The same mistake appears in the other direction when an open above the prior high becomes a full gap up by assumption.
A better habit writes down the evidence in this order:
- Timeframe: daily, weekly, or another period.
- Previous range: the earlier high and low.
- Opening comparison: the later open versus that range.
- Full-range check: the later high for a down jump, or the later low for an up jump.
- Volume: the reported shares traded beside the two candles.
- Past-tense sentence: one line that describes the dates and prices.
For IBM, the sentence is short: On the daily chart, IBM opened below the August 31 low on September 1 and traded back into the earlier range; two sessions later, IBM opened above the September 2 high and again traded back into the earlier range. The sentence records what the candles did. It leaves the future open.
Indicators describe past price action and do not guarantee future results. An opening gap, a full-session gap, and a volume bar all belong in the description-before-forecast part of chart reading.
Where this fits in the course
This is Lesson 12. Lesson 11 introduced the blank space between neighboring candle ranges. This follow-up adds the second check that keeps an opening jump separate from a gap that survives the entire next session.
Next week, the course will use the same observation-first routine on a fresh chart and place daily and weekly candles side by side. The goal stays the same: name the timeframe, compare the ranges, describe the recorded volume, and keep the chart's past separate from any guess about the future.
References
- 1Basic Chart Reading | Traders' Academy | Interactive Brokers
interactivebrokers.com
- 2Why to consider stock volume
fidelity.com
- 3
This story was produced automatically by a channel. One sentence is all it takes for Neodrop to keep producing for you.