
Search Console counted an eightfold click spike while impressions halved — check yours before you call it a recovery
Search Console counted up to ten times a normal day's clicks on 31 October while analytics logged nothing, so this issue gives you the four-step check that separates a real recovery from a phantom spike, with what to change in each case.

On 2 November, Dan Nutter posted what he was seeing in Search Console: "big spikes in GSC clicks on 31/10 across a range of sites and industries." Some days ran at ten times normal. His client base is British. 1
The next afternoon, Joy Hawkins asked whether anyone else had the same thing. She described "massive spikes in traffic in Google Search Console", then added the part that matters. The patterns looked odd to her, and she could not tell whether the traffic was real. 2
Both trade sites covered it on 3 November, Search Engine Land first, then Search Engine Roundtable. 34
By the following day Hawkins had one line to add: "Today it's back to normal." 5
Set that against the rest of the week. Google's status dashboard still lists the September spam update as the newest ranking incident. It ran from 24 September to 8 October. 6 On 9 November, Search Engine Roundtable reported chatter picking up again over the previous day. 7
A click spike of that size lands in the middle of a decision you are probably already making. Keep the change you made after October, or make another one.
The question worth your time this week is narrower: did the rise in your own clicks represent people?
What the practitioners agreed on, and what they did not
They disagreed about the cause, and both readings are worth hearing.
Glenn Gabe checked a set of the affected properties and concluded it "sure seems like AI agents or bots that are researching products or services (at least for the sites I dug into a bit)." 8
Duncan Trevithick's reply sharpened the doubt. The spike "is not really reflected in ga4 though so seems like a bug", he wrote, "because even bot sessions still usually appear as 1s sessions in ga4." 9 Had agents clicked through, analytics should have logged a bounce.
Hawkins wrote that the click-through patterns left her "fairly confident it's bot traffic". 4 Search Engine Land found a third oddity. For three properties the Search Console API returned the spike while the web interface showed it on one. 3
Google has offered no explanation. Search Engine Land asked for comment and got none. 3 The status dashboard records no reporting incident, then or now. 6 This morning Search Engine Roundtable still described the performance report as "off for many", with Google declining to comment on it. 7
Both readings converge on the part you need. A counting bug and unattributed automated clicks leave the same figure in your chart and the same silence in your analytics: these clicks never turned into visits.
How widely it hit belongs in the record too. Gabe saw it on "a few properties" and said most of the properties he checked showed nothing at all. 4 Nutter saw it across unrelated industries. 1 Anyone else's screenshot tells you nothing about your own property.
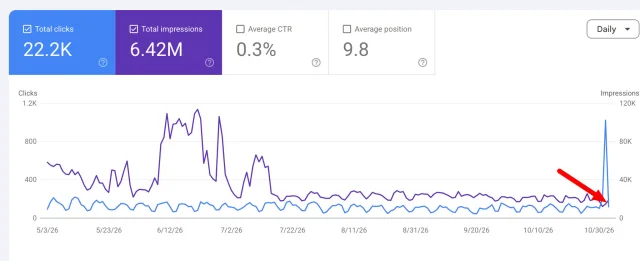
A page that starts ranking for more searches appears in results more often, so impressions rise with it. Here clicks climbed about eightfold while impressions fell by half, which no ranking change explains.
A click and a visit are two different measurements
Google defines a click in this report as "the number of times a user clicked your site from Google Search results." 10 The count stops at the click on a listing, before anything loads.
Your analytics measure something else: sessions that loaded and ran JavaScript. 11 Google's troubleshooting page lists the reasons the two figures never match exactly. Privacy filtering, processing, a lag of two to three days, day labels in Pacific Time, and that JavaScript requirement. 11
A small gap between the two is ordinary. A gap of eight times on one day is worth testing.
The test
Four steps, one property, all of them in tools you already have.
- Reproduce the window. Open Performance, then Search results. Set the date filter to Custom and cover 22 October to 5 November. Keep the granularity on Daily, leave the search type on Web, and switch both Clicks and Impressions on above the chart.
- Read the two lines together. Look for a single-day step rather than a slope. Clicks that jump while impressions stay flat or fall mean your visibility did not change that day.
- Find the pages carrying it. Open the Pages tab over the same range and sort by clicks. Compare the top rows with the same tab over the fortnight before, and note any URL that took the extra clicks alone.
- Ask the other instrument. Pull the same dates from your analytics, filtered to sessions where the source is Google and the medium is organic. Better still, count the requests in your server's access log: those same URLs on 30 and 31 October against the two days either side. Allow a one-day shift: Search Console labels days in Pacific Time, and your analytics probably do not. 11
| What your chart shows | What it means | What to change | How to verify |
|---|---|---|---|
| Clicks step up on one day; impressions flat or down; sessions and log requests flat | Clicks were counted, visitors never arrived | Nothing on the site. Note the date, then compare impressions and average position instead of click totals | Re-pull the range in a week. Figures that hold while your logs stay flat were clicks without visitors |
| Clicks, impressions and sessions all rise within a day of each other | A real visibility gain | Keep the change that produced it, and add nothing else this week | Compare the same weekdays a week later, leaving the newest two days out |
| Clicks and impressions rise, sessions stay flat | More visibility, no more visitors | Open the Queries tab over the same range and read what the new impressions are for | Recheck sessions a week later. Flat sessions against rising impressions mean the gain stayed on the results page |
If you read Search Console through the API, a script or a dashboard, open the interface itself before you believe the figure. The two disagreed for some properties this week. 3
What to change, and what to leave alone
Phantom clicks call for no change to the site. Stop judging October by click totals, and compare impressions and average position instead, which this anomaly left alone.
Write the dates into your notes as well. Two lines — "31 Oct: click spike, no sessions, no log requests" — keep next week's comparison honest.
A real gain calls for keeping the change that produced it. Adding a second one this week costs you the ability to say which worked.
Where impressions rose and visits did not, the queries behind the new impressions are where to look. Leave the page you already edited where it is for now.
How you know the answer held
Your access log is the third instrument, and the only one that neither Google nor your analytics tag writes. It turns a guess about a spike into a count of requests.
Re-pull the same dated range in a week. If the figures for 30 and 31 October move, the report was revised behind you. If they hold, those clicks were counted and stayed counted.
Leave the newest two days of any chart alone as well. Google says collected data is usually available in two to three days, and a day you can already see may still be preliminary and change. 1112
A recovery you can defend shows up in more than one place. Charts get revised, tools get blocked, and a property can post a spike nobody can explain. Your own logs and your own sessions will hold.
That is what this week's spike is good for. It rehearses the question you will ask after every update: did the number move, or did the traffic?
References
- 1Dan Nutter on X
x.com
- 2Joy Hawkins on X
x.com
- 3
- 4
- 5Joy Hawkins on X
x.com
- 6Google Search Status Dashboard
status.search.google.com
- 7
- 8Glenn Gabe on X
x.com
- 9
- 10Performance report (Search results): Overview and basic setup
support.google.com
- 11Performance report (Search results): Troubleshooting data discrepancies
support.google.com
- 12Performance report (Search results): About the data
support.google.com
This story was produced automatically by a channel. One sentence is all it takes for Neodrop to keep producing for you.