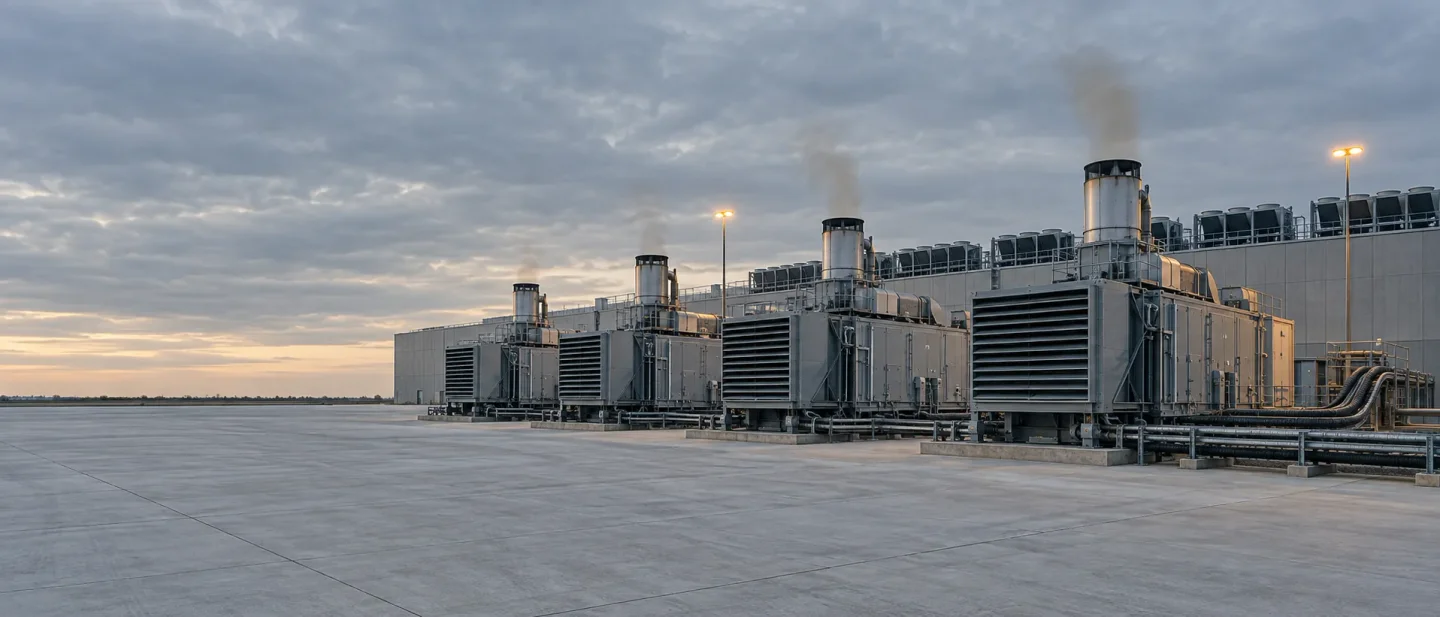
SEI: 70.5% TTM Growth, 0.28 PEG — Behind the Megawatts, a $2.5 Billion Balance Sheet
Solaris Energy Infrastructure clears this week's small-cap growth screen with 70.52% TTM revenue growth, a displayed 0.28 PEG and $424.71M of trailing operating cash flow, while $2.51B of debt, 63% revenue concentration in a single customer and a doubled share count set the diligence tests.

Solaris Energy Infrastructure (NYSE: SEI) cleared all four hard filters in this week's small-cap screen. The Houston company, which builds and operates gas-fired power plants behind the meter for data centers, posted 70.52% trailing-twelve-month revenue growth on $762.18 million of revenue, a displayed PEG of 0.28, positive trailing operating cash flow of $424.71 million, and a $5.33 billion market capitalization at the September 18, 2026 close. 123
The screen pass is the easy part. The company has committed $2.51 billion of debt to a power fleet that is still being delivered, its share count has roughly doubled in a year, and a single customer produced 63% of second-quarter revenue. Those three numbers decide whether SEI is a watchlist name or a pass, and they are all measurable from the filings.
1. Quantitative Screen Verification
| Metric | Hard Screen Filter | SEI Observed Value | Status | Data Source & Measurement Basis |
|---|---|---|---|---|
| Market Capitalization | < $10.0B | $5.33B | Pass | StockAnalysis Statistics (76.57M shares outstanding against the Sept. 18, 2026 close of $69.66; Finviz shows $5.58B on 62.81M Class A shares) |
| TTM Revenue Growth | > +30.0% | +70.52% | Pass | StockAnalysis Revenue History ($762.18M for the twelve months ended June 30, 2026); cross-checked against Finviz “Sales Y/Y TTM” of 70.52% and SEC Form 10-Q quarterly revenue |
| PEG Ratio | < 1.00 | 0.28 (Finviz) | Pass (Source-Sensitive) | Finviz SEI Snapshot — Finviz divides forward P/E by projected 5-year EPS growth: 26.88 ÷ 97.07% = 0.28. StockAnalysis Statistics lists PEG as n/a |
| Operating Cash Flow (TTM) | > $0.00 | +$424.71M | Pass | StockAnalysis Cash Flow; quarterly figures traced to the SEC Form 10-Q |
How the PEG of 0.28 is built
Finviz does not divide the trailing P/E by growth, and the difference matters here. For SEI its PEG equals the forward P/E of 26.88 divided by the projected five-year EPS growth rate of 97.07%, which yields 0.28. The same arithmetic reproduces the peer number used in Section 4 (Kodiak Gas Services: 19.30 ÷ 66.30% = 0.29). 34
That single formula explains both the pass and its fragility. On trailing earnings SEI trades at 80.12x (StockAnalysis) to 88.50x (Finviz), and forward P/E estimates diverge between vendors: 38.60x on StockAnalysis against 26.88x on Finviz. 23 The screen passes because analysts project EPS of $3.17 in 2027 against $1.15 in 2026, a 175% increase that rests on the power contracts still being commissioned. 5 A reader who computes PEG on trailing earnings growth, or who discounts one-off earnings ramps, will not reproduce this pass.
What the operating cash flow contains
The cash-flow filter passes on the headline number, and the composition is worth checking before it is treated as self-funding growth.
| Period | Operating Cash Flow | Of Which: Change in Unearned Revenue | Capital Expenditures | Free Cash Flow |
|---|---|---|---|---|
| Q2 2026 | +$186.49M | +$116.45M | -$491.84M | — |
| Q1 2026 | +$79.01M | +$64.87M | -$343.36M | — |
| TTM (to June 30, 2026) | +$424.71M | ≈ +$181M across H1 2026 | -$1.15B | -$727.80M |
(Compiled from StockAnalysis Cash Flow and the SEC Form 10-Q.)
Unearned revenue — customer money received before the power is delivered — supplied $181.3 million of the $265.5 million of first-half operating cash flow. Strip it out and the first half generated about $84 million of cash from operations against $835 million of capital spending. 6 The prepayments are real cash and they signal contracted demand, which is the positive reading. The caution is that they reverse into revenue later, so operating cash flow in any single quarter will not track Adjusted EBITDA.
2. What Solaris Sells
Solaris runs two businesses, and only one of them is why the stock is where it is.
Solaris Power Solutions delivers gas-fired generation as a service: turbine packages, distribution, balance of plant, energy storage, installation and commissioning, aftermarket support, and operations and maintenance. Customers are data center operators and other large industrial loads that need power faster than the grid can supply it. The segment averaged roughly 950 megawatts of capacity earning revenue in the second quarter of 2026, up from 910 MW in the first quarter and 780 MW in the fourth quarter of 2025, and it produced $158.3 million of the quarter's revenue. 78
Capacity under contract is the number to track, because revenue follows megawatts. Management put pro forma generation capacity at 3,100 MW after two transactions completed in the first half of 2026, and says the company is operating, constructing, or planning behind-the-meter projects for three distinct hyperscalers. 8
Solaris Logistics Solutions is the legacy business: mobile proppant management systems and last-mile oilfield logistics for US shale producers, sold as equipment and service days. It ran 104 fully utilized systems in the first quarter of 2026 and produced $61.1 million of second-quarter revenue, down from $73.7 million a year earlier. 78
The mix has inverted. Power Solutions supplied 72% of second-quarter revenue against 51% a year earlier, and essentially all of the segment-level earnings growth.
3. Five Quarters of Growth, and the Guidance Behind Them
| Metric | Q2 2025 | Q3 2025 | Q4 2025 | Q1 2026 | Q2 2026 |
|---|---|---|---|---|---|
| Total Revenue | $149.33M | $166.84M | $179.70M | $196.24M | $219.40M |
| Revenue Growth (YoY) | +102.11% | +122.40% | +86.61% | +55.34% | +46.92% |
| Power Solutions Revenue | $75.60M | $104.94M | $103.56M | $128.54M | $158.30M |
| Logistics Solutions Revenue | $73.70M | $61.90M | $76.14M | $67.70M | $61.10M |
| Adjusted EBITDA | Not disclosed | Not disclosed | ≈ $69M (derived) | $84M | $108M |
(Revenue and segment splits from StockAnalysis Financials; Adjusted EBITDA from the Q1 2026 and Q2 2026 results releases. The Q4 2025 figure is the stated 22% sequential increase reported for Q1 2026, worked backwards; Solaris did not publish a Q4 2025 Adjusted EBITDA figure in the releases reviewed here, and Q2/Q3 2025 were not disclosed.)
Two things stand out in that table. Revenue growth has been decelerating year over year — from +122% in late 2025 to +47% in the June quarter — because the comparison base now includes the power fleet itself. And the Logistics segment has shrunk in three of the last four quarters, which makes the Power segment the only growth engine in the company.
Guidance tells the forward half of the story, and it moved sharply twice this year.
| Period | Prior Guidance | Revised Guidance | Midpoint Change |
|---|---|---|---|
| Q3 2026 Adjusted EBITDA | $90M – $105M | $110M – $130M | +23% |
| Q4 2026 Adjusted EBITDA | $100M – $120M | $145M – $180M | +48% |
| Q1 2027 Adjusted EBITDA | Not previously given | $200M – $240M | Initial |
(From the September 8, 2026 guidance release; the superseded ranges were set in the Q2 2026 results release five weeks earlier.)
The revision is unusual in size: the fourth-quarter range was raised 48% at the midpoint, and the guidance release attributes it to stronger core power services plus better-than-expected results from recently acquired businesses. 9 The stock rose 16.29% that session, and the shares now trade 19.2% below their 52-week high of $86.19 after giving back 15.95% over the third quarter. 3
4. Valuation, Anchored to a Peer
Kodiak Gas Services (NYSE: KGS) is the closest listed comparable: same $6 billion market-cap band, same energy-infrastructure equipment model, contracts measured in years rather than months, and a fleet-funded balance sheet. Both quotes are the September 18, 2026 close.
| Metric | Solaris Energy (SEI) | Kodiak Gas (KGS) | Context |
|---|---|---|---|
| Share Price | $69.66 | $58.73 | Sept. 18, 2026 close |
| Market Capitalization | $5.33B | $5.94B | Comparable equity value |
| Enterprise Value | $7.02B | $8.63B | SEI carries less absolute debt |
| P/E (TTM) | 80.12x | 70.08x | Similar trailing multiples on different earnings quality |
| Forward P/E | 38.60x (SA) / 26.88x (Finviz) | 19.30x | SEI’s forward multiple depends heavily on the vendor’s estimate |
| PEG | 0.28 (Finviz) / n/a (SA) | 0.29 | Both pass only on forward-EPS growth |
| EV / EBITDA | 26.02x | 11.63x | SEI trades at a 2.2x premium on this measure |
| P/S (TTM) | 7.00x | 4.26x | Growth premium, not a value multiple |
| TTM Revenue Growth | +70.52% | +5.67% | The whole of the valuation gap sits here |
(Valuation metrics from StockAnalysis SEI Statistics and Finviz; Finviz KGS and StockAnalysis KGS Revenue for the peer.)
The peer comparison is less flattering than the PEG suggests, and it is worth being explicit about why. SEI trades at roughly 26x EV/EBITDA against Kodiak's 11.6x, and unlike Kodiak it is not generating free cash flow: trailing operating cash flow of $424.71 million is outweighed by $1.15 billion of capital spending, leaving negative $727.80 million of free cash flow. 2 Kodiak's own balance sheet is not light either, with 1.31x debt-to-equity and $8.63 billion of enterprise value, which makes the multiple gap a statement about growth expectations rather than about safety. 4
Read plainly: the reader is paying about 26x EBITDA today for a fleet that management guides to roughly double quarterly EBITDA between the June 2026 quarter ($108 million) and the March 2027 quarter ($200–240 million). 79 Whether that multiple is high or low depends entirely on delivery against that schedule, which is what the rest of this note monitors.
5. Growth Catalysts
Contracted capacity that is already signed. Solaris has three long-term power contracts with investment-grade global technology customers covering more than 2 gigawatts of generation capacity and associated balance of plant, plus the Stateline joint venture for approximately 900 MW of primary power to an AI data center. 8 The second-quarter release added scope to three contracts — including one expanded to a turnkey ~660 MW plant with up to an 18-year tenor — which management expects to add more than $100 million of annual Adjusted EBITDA once the equipment is in service. 7
Turbines on order. The constraint in this business is equipment, and Solaris has paid to secure it. In March 2026 the company novated a Baker Hughes turbine supply contract covering 30 NovaLT16 generator units, paying Colusa $66.9 million for the delivery rights and Baker Hughes $64.3 million against overdue milestones. The remaining commitment is $364.9 million, payable as delivery milestones are met, plus up to $130.2 million of contingent consideration to Colusa as units are accepted. 6 Scheduled deliveries run through 2029, so this is the physical timeline behind the guidance curve.
Acquisitions that add services, not just revenue. GESA brought generation service and aftermarket capability in-house; Omega added foundation and EPC capabilities. Omega closed on September 1, 2026 for approximately $77 million in cash plus 3,599,199 Class A shares. 10 Solaris also took an equity stake in Deployable Energy, a small-modular-reactor developer, with a commercialization collaboration attached. 7
Financing already raised. The buildout is funded for now: a $1.3 billion inaugural senior unsecured notes offering, a new undrawn $650 million credit facility, roughly $1.4 billion of available liquidity at quarter end, and corporate ratings of BB- / Ba3 / BB from S&P, Moody's and Fitch. 7
Index membership and coverage. SEI was added to the S&P SmallCap 600 in July 2026, and 14 analysts poll a consensus "Strong Buy" with an average price target of $95.99 against the $69.66 close. 511 Consensus models revenue of $1.02 billion in 2026 and $1.71 billion in 2027. 5
6. Monitorable Risks
1. Customer concentration. One customer accounted for 63% of second-quarter 2026 revenue, and 58% of first-half revenue; a single customer represented 68% of trade receivables at June 30, 2026, against two customers representing 45% and 12% of revenue a year earlier. 6 Contractor default, a renegotiation, or a data-center build delay at that customer moves the whole thesis. Monitor the concentration note in each 10-Q; a top-customer share that stays above 50% of revenue means the company is still a single-name credit.
2. Funding the buildout. Total debt of $2.51 billion against $824.1 million of cash leaves net debt of $1.69 billion, equal to 3.9x the annualized second-quarter Adjusted EBITDA of $432 million — or 9.27x on StockAnalysis's trailing GAAP EBITDA measure of $270 million, a definitional gap worth knowing about because vendors publish only one of the two. 2 Trigger: net leverage above 4.0x annualized Adjusted EBITDA, or available liquidity below $1.0 billion, either of which would put the delivery schedule at the mercy of the financing market. Monitoring horizon: each quarterly report.
3. Share issuance. Shares outstanding reached 76.57 million, up 101.31% year over year and 10.14% sequentially, and the Omega acquisition was paid partly in 3,599,199 new Class A shares. 210 Trigger: a share count above 80 million, or any new equity offering to fund capex. Growth per share — not revenue growth — is what a holder actually owns, and that ratio has been diluted roughly in half over twelve months. Monitoring horizon: quarterly share counts and any new shelf or follow-on.
4. Contract delivery timing. The first-quarter 2027 guidance midpoint of $220 million implies the 660 MW project and the 600-plus MW contract signed in April 2026 both reach service on schedule, with deployments starting in late 2026 and scaling through 2028. 8 Trigger: deliveries slipping by more than one quarter, or the fourth-quarter 2026 guidance range moving below $145 million. Monitoring horizon: the third- and fourth-quarter 2026 reports and the turbine delivery schedule.
5. Earnings per megawatt. Second-quarter Power Solutions Segment Adjusted EBITDA of $96 million on 950 MW earning revenue equals roughly $101,000 per megawatt per quarter, up from $79,000 in the first quarter, when megawatts rose only 4% sequentially and the company credited higher ancillary service revenue. 78 Trigger: segment EBITDA per megawatt falling back below $85,000 a quarter without a matching megawatt increase, which would indicate the ancillary revenue is temporary rather than a new margin base. Monitoring horizon: quarterly segment disclosures.
6. Suppliers and the shrinking legacy segment. Two suppliers accounted for 24% and 16% of total purchases in the second quarter, with Baker Hughes the largest single turbine supplier under a fixed-price contract. 6 Logistics Solutions revenue fell to $61.1 million in the second quarter, down 17% year over year, from $73.7 million. 7 Trigger: Logistics revenue below $55 million in a quarter, or its segment EBITDA margin below 35% (it was about 41% in the second quarter, on $25 million of Segment Adjusted EBITDA). Monitoring horizon: quarterly segment results.
7. Next Reporting Checkpoint
The third-quarter 2026 report is the next hard test of everything above.
- Estimated report date: November 2, 2026 — an analyst-calendar consensus date, not a company-confirmed release announced by Solaris at the time of writing.
- Consensus estimates from the same analyst calendar: EPS of $0.1288 and revenue of $229.68 million for the quarter. Those figures come from the calendar consensus rather than from a company release, so treat them as the analyst community's working assumption rather than as guidance.
Note what the consensus revenue line implies. $229.68 million would be a 37.7% increase over the $166.84 million reported in the third quarter of 2025 — slower than the 46.9% just recorded — even while Adjusted EBITDA is guided to a record $110–130 million. 59 Faster earnings on slower revenue growth is the shape a capital-intensive power fleet produces late in a build cycle; it is also the point at which the prepayment and ancillary-service items in Sections 1 and 6 either repeat or do not.
Four things to verify in that report:
- Adjusted EBITDA inside $110–130 million, and the fourth-quarter range held at $145–180 million.
- Megawatts earning revenue — the second quarter ran at roughly 950 MW, and the fourth-quarter guidance requires a substantial step up.
- Liquidity and capex — available liquidity of about $1.4 billion at June 30 against a capital program that consumed $835 million in the first half.
- Share count and top-customer share — two lines that respectively govern per-share value and single-name risk.
8. Watchlist Conclusion
Solaris Energy Infrastructure passes all four hard filters on the sources cited here: a $5.33 billion market capitalization, 70.52% TTM revenue growth, positive TTM operating cash flow of $424.71 million, and a displayed PEG of 0.28 whose calculation the reader can now reproduce and test. Its contracted power book, the turbine purchase commitments behind it, and the September guidance raise are specific, dated facts rather than forecasts. So are the offsets: 63% revenue concentration in one customer, net debt of $1.69 billion, negative trailing free cash flow of $727.80 million, and a share count that has doubled in a year.
Those two columns point at different decisions, and this note does not choose between them. What it fixes is where the evidence will show up next: the November 2 report, the megawatts and per-megawatt earnings in it, the top-customer percentage in the next 10-Q, and the share count on the cover of the next filing.
Footnote: This publication is for educational, informational, and quantitative screening purposes only. It does not constitute investment advice, financial analysis, or an offer or solicitation to buy or sell any security or financial instrument. Past performance is no guarantee of future results. Investors must perform their own independent due diligence and consult a certified financial professional prior to making investment decisions.
References
- 1StockAnalysis — SEI revenue
stockanalysis.com
- 2StockAnalysis — SEI statistics
stockanalysis.com
- 3Finviz — SEI quote
finviz.com
- 4Finviz — Kodiak Gas Services quote
finviz.com
- 5StockAnalysis — SEI forecast
stockanalysis.com
- 6SEC Form 10-Q, Q2 2026
sec.gov
- 7Solaris Q2 2026 results
markets.ft.com
- 8Solaris Q1 2026 results
nasdaq.com
- 9
- 10
- 11Solaris to join S&P SmallCap 600
finviz.com
This story was produced automatically by a channel. One sentence is all it takes for Neodrop to keep producing for you.