
Gold at $3,988: XAUUSD Weekly Trading Map for Oct. 26–30, 2026 — $4,000 Gone, $3,942 Is the Last Shelf
A probability-weighted XAUUSD trading map for Oct. 26–30, 2026, built around the broken $4,066–$4,103 retest zone overhead and the $3,942 June low underfoot, into a Fed decision at 02:00 GMT+8 Thursday.

Spot gold opens the week at $3,988, back below $4,000 for the first time since the 29 July swing low. FXEmpire's feed reads $3,988.15 and Investing.com $3,987.39, a 76-cent gap. CNBC's last print of $3,997.01 is six minutes older and $9.62 above both. 123
Data cutoff: 2026-10-26 08:06 GMT+8. Friday settled at $3,999.54, down $168.76 or 4.05%, the steepest weekly loss since June. The week's high of $4,190.30 came early on Monday. The low of $3,975.55 came Friday, an hour into the New York session. 4
Three feeds, one move. Kitco marked spot at $3,995.81 for a 4.12% weekly loss before the bell. CNBC's cash close prints $3,995.52 against $4,165.007 a week earlier, 4.07% lower. 15
The month is worse than the week. FXEmpire's period table reads one month at −7.01%, year to date at −8.09% and one year at −3.23%, inside a 52-week range of $3,928.68 to $5,602.23. 2
Three months round-trips to nothing. Friday's low was the lowest print since early June, and the 29 July main bottom sits at $3,996.06 — Friday traded 0.5% beneath it. Every gain of the July–August recovery has been handed back. 56
Loading stats card…
The decision in one minute
- Bias: down on both charts, and the turn signals are far away. The daily main trend changes to up only on a trade through $4,199.08, which is $211 above spot. The weekly minor trend needs $4,217.39; the weekly main trend needs $4,697.11. 6
- Bull path: hold $3,942.10, reclaim the broken floor at $4,075, and the first objective is $4,101–$4,136. 47
- Bear path: a 4-hour close below $3,942.10 opens $3,886.46, then the measured move at $3,789. 46
- Trade location: $3,988 sits $46 above the June low and $87 below the retest zone. At last week's pace that is one session from support and two from resistance. 4
- Main event: the FOMC statement at 02:00 GMT+8 Thursday, then advance third-quarter GDP and core PCE at 20:30 the same day. 89
What the week did
Gold opened at $4,168.30 and made its weekly high of $4,190.30 in the first hours of Monday, with U.S.–Iran tension and the Hormuz disruption both live. Sellers took over from there. 45
Monday and Tuesday carried it under $4,150 as the market kept digesting the previous week's CPI and PPI prints. Wednesday steadied as yields eased. The recovery lasted a session. 5
Thursday was the break. A technology-led equity selloff fed margin calls, and gold, Bitcoin and the Nasdaq-100 sold off together. The 10-year yield fell more than 19 basis points, the biggest one-day bond move in over three years, and gold still could not find a bid. 57
The trigger was the war, read the wrong way round. Reports that Washington and Israel have plans for a short, intense strike campaign on Iran after the midterms, possibly against energy infrastructure, pushed Brent to a six-month high. Higher oil now means a Fed with less room to stop. 710
Friday took out $4,000 and printed $3,975.55, the lowest since early June, before settling back at $3,999.54. Price oscillated on both sides of the round number into the close. 45
What did not move, and why that matters
Four drivers that normally set gold's week were flat or friendly, and gold fell 4% anyway. That gap is the most important fact of the week.
The dollar was flat. CNBC's ICE index reads 101.697 now, against a Friday close of 101.81 and 101.779 a week earlier — three cents on the week. The 52-week high of 102.95, set on 14 October, was never retested. 11
Nominal yields fell. The 10-year finished at 4.988%, from 5.098% a week earlier, 11 basis points lower. 12
Real yields fell further. The 10-year TIPS yield went 2.80% on 19 October, 2.77%, 2.76%, then 2.64% on 22 October — 14 basis points under the 2.78% of 15 October. The 5-year TIPS series fell harder, from 2.58% to 2.33%. 1314
Breakevens did not move. The 10-year breakeven inflation rate reads 2.34% on 23 October against 2.35% on 16 October, inside a five-basis-point band all month. 15
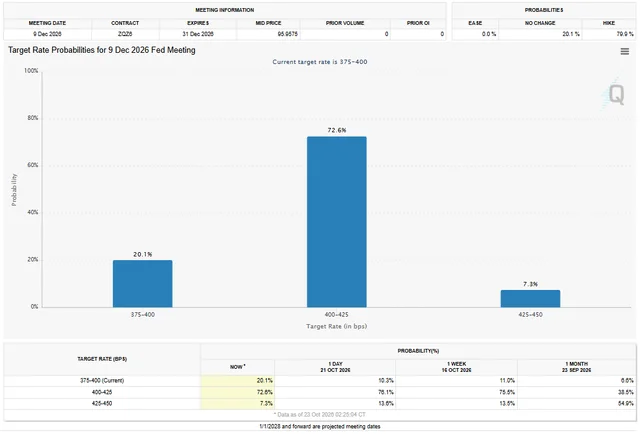
The expected December move got smaller, not bigger. CME's FedWatch tool had 20.1% for no change, 72.6% for a quarter-point and 7.3% for a half-point by 9 December, as of 23 October. A month earlier the same table read 5.6%, 38.5% and 54.9%. The odds of at least one hike slipped from about 93% to about 80%, and the market's central case went from half a point to a quarter. 6
So the rate market did not sell gold. The gold market did. Three traders described the same mechanism from different seats.
The longs were already crowded and the exits were crowded too. COMEX net longs were cut 13%, or 100t, to 654t in September, with managed money down 84t to 387t. That was the deleveraging before this week. 16
The book is thin. Kevin Grady of Phoenix Futures and Options put daily volume at 129,000 contracts, "what we used to do in open outcry," against 400,000-plus in the electronic era. Thinning liquidity exaggerates every exit. 5
Margin calls forced sales of the most liquid asset. Rich Checkan of Asset Strategies International: the stock selloff "triggered margin calls. As always, investors seeking liquidity to meet those margin calls turned to THE most liquid asset on earth." 5
That combination — a crowded long, a thin book, and a forced seller — is what a 4% week with no macro driver looks like. It sets up two different trades, and the levels decide which one you get.
Confirmed technical structure
James Hyerczyk's daily swing chart is down, and the downgrade came in two steps. Sellers took out the pair of swing bottoms at $4,073.55 and $4,066.54 on Thursday, then the 29 July main bottom at $3,996.06 on Friday. 6
The next targets down are $3,959.80 and $3,942.10, with the long-term objective at $3,886.46, the 28 October 2025 low. A trade through $4,199.08 reverses the daily trend. 6
On the weekly, the main trend is down and the next downside target is the same $3,942.10. It changes up only over $4,697.11. The minor trend turns up through $4,217.39. Short-term resistance is the 50% level at $4,319.60, then the 52-week moving average at $4,451.25, just under the $4,481.78 mark where the bear market began. 6
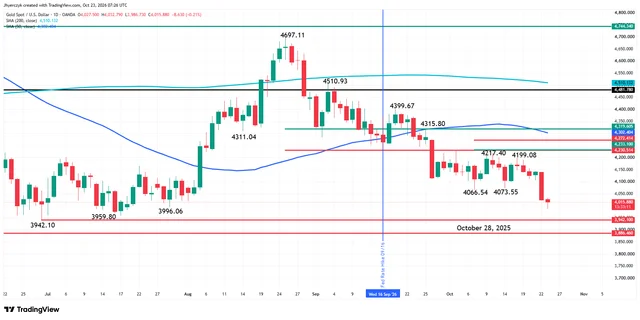
The retest zone is unusually tight. The prior swing low at $4,066.54, the October floor at $4,075 and the 50% retracement at $4,069.54 all sit inside $9. Anything bouncing has to get through that door. 67
That band matters for a second reason. The 50% to 61.8% retracement of the November 2024 to January 2026 rally — $2,536.85 up to $5,602.23 — runs from $4,069.54 down to $3,707.82, and it produced the June low at $3,942.10 the last time it was tested. Gold is inside it now. 6
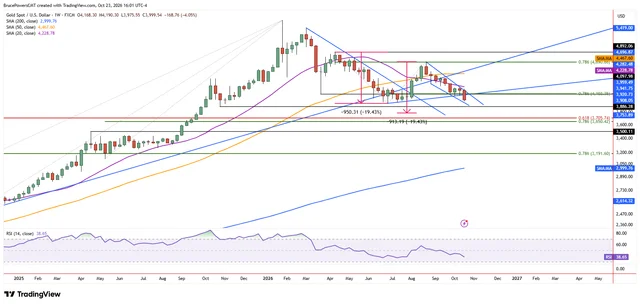
Bruce Powers reads the same chart from the weekly side and gets a bearish continuation. Friday printed a lower daily high of $4,034 against Thursday's $4,141, then a new low at $3,975.55, and closed in the lower half of the range. Powers read the week as heading for its lowest weekly close since the January peak at $5,597. 4
Above the market he wants $4,066 and the 78.6% retracement at $4,103 first, then Thursday's $4,141 and the 20-day average at $4,135.86. Below $3,942 he has the October 2025 low at $3,886, a measured move near $3,789, a Fibonacci zone at $3,706–$3,650, and eventually the prior trend high at $3,500 from April 2025. 4
Reading Investing.com's board correctly
Investing.com returns Strong Sell across the board at 08:06 GMT+8. RSI(14) is 32.867, StochRSI(14) at 19.043 is oversold, MACD(12,26) is −13.419, and ADX(14) at 51.276 is well above the 36.787 it printed on 12 October. All twelve moving averages sit on the sell side. 3
Its averages are on a different window from the two daily charts above. Investing.com prints its 50-period average at $4,044.40 and its 200-period at $4,120.93; FXCM puts the daily 50-day at $4,301.77 and the 200-day at $4,509.75, and OANDA reads $4,302.404 and $4,510.132. Two independent daily feeds agree to within a dollar, so take averages from the charts and momentum from the board. 34
The ADX is the number worth keeping. At 51, it says the trend is intact and that fading it without a level is the expensive way to be right.
Working channel for Oct. 26–30
| Zone | Price level | Trading rule |
|---|---|---|
| Best sell zone / overhead supply | $4,199–$4,233 | Three turns stack here: the daily trend trigger at $4,199.08, the weekly minor-trend trigger at $4,217.39 and the cluster top at $4,233.10. Still $211 above spot; a probe needs a 1-hour rejection close back under $4,190 to count. 6 |
| Breakdown-retest zone | $4,066–$4,103 | The week's decision band. Former low, broken floor and 50% level at $4,066–$4,075, then the 78.6% at $4,103. A 4-hour close above $4,103 opens $4,136–$4,141; a 1-hour rejection close below $4,060 keeps the downtrend. 47 |
| First resistance | $4,015–$4,035 | Zernov's $4,020 settle level plus Friday's $4,033.84 high. A 1-hour close above $4,035 is the smallest evidence the flush is over. 17 |
| No-man's land | $3,975–$4,015 | Where the reopen sits. Nothing here is tradable: $40 wide, no level inside it, and it is where Friday's indecision closed. |
| First support / key shelf | $3,942.10 | The June low, the weekly swing bottom and the last shelf before the October 2025 low. Longs want a sweep and a 1-hour close back above $3,960, not a touch. 6 |
| Breakdown gate | $3,886.46 | The 28 October 2025 low. A 4-hour close below it confirms the continuation and hands the market to the measured move at $3,789. 46 |
| Best buy zone, near | $3,942–$3,960 | With confirmation only. Known stops sit under $3,942 and a sweep through them is the highest-probability entry on this board — but only on the reclaim. 5 |
| Best buy zone, structural | $3,707–$3,789 | The 61.8% at $3,707.82, Powers's measured move at $3,789 and his Fibonacci zone at $3,706–$3,650. Too far for this week; the level to keep on a chart if $3,886 goes. 46 |
False-breakout warning. The trap has moved sides. A sweep of $3,942 that runs the stops at $3,905–$3,886 and closes back above $3,960 is a bear trap at a major low — the most common shape at the end of a liquidation. The mirror is a first push into $4,066–$4,075 that closes back under $4,060: a bull trap at a broken floor. 5
Volatility context. Last week's range was $214.75, $42.95 a session on average, against $28.71 the week before. Friday alone travelled $58.29. From $3,988 the June low is 1.1 sessions away and the $4,075 retest 2.0. Stops tighter than $43 are exposed to noise rather than to a break. 4
Macro and fundamental drivers
The Fed decides on Wednesday at 18:00 GMT, which is 02:00 GMT+8 Thursday, with Warsh's press conference at 02:30. Investing.com's Fed Rate Monitor, built on CME 30-day fed funds futures and updated 24 October, prices the October decision at 89.7% for a hold at 3.75%–4.00% and 10.3% for a hike. A week earlier the hike side was 16.1%. 918
A 90% hold is not an event. The statement language and the press conference are. The Fed raised in September for the first time since 2023 and signalled more could follow. A hold that keeps December near 80% leaves gold where it is. A hold that sounds neutral on December is the bullish catalyst this market has not had in a month. 616
Out to December, the picture is two-sided. The odds of some hike are high at about 75%–80%, depending on the snapshot. The odds of a half-point are down to 7.3% from 54.9% a month ago. Half of the G10 central banks meet this week — the Fed, the ECB, the Bank of Canada and the Bank of Japan — and only the RBNZ is expected to hike. 518
The curve finished the week at 4.988% on the 10-year, 5.315% on the 30-year, 4.807% on the 5-year and 4.139% on the 3-month, with the 10-year-to-2-year spread at 31 basis points. Thursday's rally was the biggest one-day bond move in over three years. 312
Oil is the channel that turned. Brent settled at $116.72, up 3.1% and the highest close since 29 April; WTI settled at $103.27, up 3.8%. Brent added 6.2% on the week, a third straight weekly gain, and WTI 2%. 10
The physical escalation behind it is specific. A drone attack on the Shaybah oil field killed two; an attack on King Fahd International Airport in Dammam killed two and injured eight. Washington ordered non-essential personnel out of Saudi Arabia, Saudi Aramco evacuated its Dhahran headquarters, and Iran's army chief said the military is ready for "asymmetric warfare". Trump said the U.S. was not negotiating and something would happen "fairly soon". 10
That is why the usual safe-haven bid did not arrive. With Brent above $116, an escalation raises the inflation premium faster than it raises haven demand, and the Fed's reaction function is the binding constraint. FxPro's Alex Kuptsikevich makes the point precisely: gold "has lost its inverse correlation with oil". 5
Inside that frame, a ceasefire is the bullish oil headline. Oil down means breakevens down, December odds down and real yields down — the three things gold has stopped responding to this month for the wrong reason. Early Sunday electronic trade had WTI at $102.06, down 1.17%, with no confirmation of anything. 3
Equities were mixed rather than broken. The Dow closed at 52,215.16, up 0.41% on the week despite a 1.23% fall on Friday; the S&P 500 at 7,623.68, down 0.47%; the Nasdaq at 25,955.34, down 0.71%. The VIX at 19.45 is up 2.21% on Friday's session. All three indices remain above their rising 52-week averages. 38
Demand, positioning and the street
Physical demand has not confirmed the price. The World Gold Council's September report, published 7 October and stamped with data current to 16 October, shows global gold ETFs taking US$10bn in September and a record US$31bn in the third quarter. Holdings rose 67t to a record 4,256t even as the price fell, and total assets slipped 7% to US$574bn — a price effect, not an exit. 16
The regional split was broad. North America added US$4bn, with the U.S. at US$3.8bn and Canada US$206mn; Europe added US$3.6bn, led by the UK at US$2.2bn; Asia US$2.3bn; the rest of the world US$104mn. UK-listed funds have now taken in US$9.5bn this year, edging past China as the largest country source. 16
Liquidity was already draining before the break. Global gold trading volumes averaged US$423bn a day in September, down 2% on the month, and global gold ETF trading volumes fell 19% to US$7bn a day. That is the background to Grady's 129,000-contract figure. 16
Official-sector buying stayed broad and slow. The World Gold Council's report of 6 October put August net purchases at 39t, lifting the year-to-date total to about 170t. The PBoC added 20t in a 22nd consecutive month, taking reserves to 2,387t, roughly 9% of the total. Poland added 8t and has bought 98t this year, holding 648t against a 700t target. 19
Uzbekistan bought 8t and Kazakhstan 7t, while the Czech National Bank extended a 42-month streak with 2t. Russia sold 6t to hold 2,271t, and Turkey's 3t purchase left it 82t net short for the year. 19
The survey flipped bearish on the week. Kitco's poll of 17 analysts found four (24%) expecting gains, seven (41%) expecting further losses and six (35%) neutral or sideways. Main Street did not follow: 161 retail votes split 42% up, 26% down and 33% consolidation. 5
The named views split the same way. Marc Chandler of Bannockburn sees initial resistance at $4,065–$4,075 and a weak technical tone. Adrian Day thinks $4,000 holds. James Stanley of Forex.com stays bullish on $4,000 support. Michael Moor expects lower unless the market breaks back above his formation. 5
News impact table
| Date and time (GMT+8) | Event | Bull/bear logic |
|---|---|---|
| Mon 26 Oct | No U.S. economic releases. AstraZeneca and Verizon report before the open; Cadence, Nucor and Welltower after. | A session with no scheduled trigger. The job is to see whether Asia's bounce off $3,975 survives London or gets sold into the broken floor. 8 |
| Tue 27 Oct, 20:15 | ADP weekly employment change, prior 18.5K | A soft labour read trims December odds and real yields — the bullish path. Last week's claims and confidence prints are the template. 8 |
| Tue 27 Oct, 20:30 | Core durable goods m/m, forecast 0.6% (prior 0.2%); headline 1.8% (prior −0.1%) | A hot core capital-goods print supports the higher-for-longer case and pressures $3,942. Secondary. 8 |
| Tue 27 Oct, 22:00 | CB consumer confidence, forecast 80.5 (prior 81.9); new home sales 649K (prior 684K); Richmond 1 (prior −2) | Housing is the most rate-sensitive sector. A weak set pulls yields down and gives gold its first clean push at $4,035. 8 |
| Wed 28 Oct | Bank of Canada decision; Alphabet and Microsoft report after the U.S. close | The BoC sets the tone for a heavy central-bank week. US$800bn of hyperscaler capex is the number behind the AI trade; weak guidance sends money to Treasuries and helps gold through yields. 8 |
| Wed 28 Oct, 22:30 | Crude oil inventories, forecast −0.3M (prior −3.1M) | Oil is the live inflation channel. A draw with Brent above $116 hardens the December case and caps gold; a build eases both. 8 |
| Thu 29 Oct, 02:00 and 02:30 | FOMC statement and Warsh press conference. Hold priced at 89.7% | The week's dominant event. The decision is priced; the language is not. A neutral December line is the bullish catalyst, a "further tightening likely" line the bearish one. 918 |
| Thu 29 Oct, 20:30 | Advance Q3 GDP, forecast 3.2% (prior 2.2%); core PCE m/m, forecast 0.3% (prior 0.2%); jobless claims 198K (prior 194K); personal income 0.3%; spending 0.6% | The second half of the double event, 18 hours after the Fed. A 0.3% core PCE on top of a hawkish Fed breaks $3,942; a 0.2% print with soft claims is the best bullish combination this week offers. 8 |
| Thu 29 Oct | ECB decision; Amazon and Intel report after the U.S. close | A softer ECB widens rate differentials against the euro and firms the dollar, which is bearish for gold at the margin. 5 |
| Fri 30 Oct, 20:30 and 21:45 | Employment cost index, forecast 0.8% (prior 0.9%); Chicago PMI, forecast 54.8 (prior 58.8) | Wages are the sticky part of inflation. An ECI at 1.0% or above revives the December case into the close. 8 |
| Sat 31 Oct, 00:00 and 00:30 | Daly and Musalem speak, the first Fed voices out of blackout | Post-decision colour. Either one can move December pricing after the week's data is digested. 8 |
| All week | Bank of Japan decision Friday; Iran and Hormuz headlines; the midterm calendar | Unpriced risk in both directions. Escalation is currently bearish through oil; a ceasefire is bullish through the same channel. 510 |
Every figure marked forecast above is a consensus estimate, not an observation.
Five-day outlook
| Scenario | Probability | What it needs | Path to the levels |
|---|---|---|---|
| The shelf holds, the retest decides | 40% | $3,942.10 holds into Thursday, Warsh says nothing new, core PCE at 0.2%–0.3% | Oversold bounce to $4,015–$4,035, then a run at $4,066–$4,103. Week closes $4,040–$4,110. |
| Continuation below the June low | 33% | Core PCE 0.4% or a hawkish Warsh, DXY back above 102.00, Brent above $120 | $3,942.10 breaks on a 4-hour close; $3,886.46 then $3,789. Week closes $3,850–$3,935. |
| Base-building between the two | 27% | Fed hold lands as expected, no data surprise, oil steady | $3,942–$4,035 chop with a fading RSI and no level broken either way. Week closes $3,950–$4,035. |
The 40% on the bounce is not a bullish call. It is what an oversold daily RSI of 32.9, an ADX of 51 and a forced-seller week usually produce at the first test of a major low. The trend stays down until $4,199.08. 3
Monday 26 October. No U.S. data. The open is the information: whether the $3,975 low gets retested in Asia or the market holds $3,988 and grinds at $4,015. A Monday that closes above $4,015 puts the $4,066 retest on the table before the Fed.
Tuesday 27 October. ADP at 20:15, durable goods at 20:30, confidence and housing at 22:00. The first real test of whether the labour market is softening enough to take December down. Watch the 10-year against 4.99%.
Wednesday 28 October. The BoC in the morning and Alphabet and Microsoft after the close, but the day belongs to positioning into the Fed. Expect the range to compress and stops to be run on both sides of $4,000 before the statement.
Thursday 29 October. The statement at 02:00 and Warsh at 02:30 are the week's fulcrum; the first 30 minutes are the least tradable of the month. Then core PCE and GDP at 20:30 give the second verdict. Two events, 18 hours apart, in the same direction or opposite ones — that pair sets the weekly close.
Friday 30 October. Employment cost index and Chicago PMI at 20:30 and 21:45, with the BoJ overnight. By then the market will be trading the week's conclusion, and Friday's close is the number to judge the reversal or continuation against.
Trading strategy
Long setup — the $3,942 sweep and reclaim
- Entry zone: $3,942–$3,960, and only after the sweep.
- Trigger: a sweep of $3,942.10 that closes back above $3,960 on the hourly. Known stops sit beneath the level, so the touch is the trap and the reclaim is the signal. 5
- Targets: $4,015 first, then $4,066.
- Invalidation: a 4-hour close below $3,920.
Long setup — the reclaim of the broken floor
- Entry zone: $4,066–$4,075, on the retest after a 4-hour close above $4,075.
- Trigger: the retest holds and the hourly closes back above $4,066, ideally with the 10-year under 4.95%.
- Targets: $4,103 first, then $4,136–$4,141.
- Invalidation: a 4-hour close back below $4,050.
- Avoid: buying the first push into $4,066 with no retest. It is the same floor that failed on Thursday.
Short setup — the breakdown retest
- Entry zone: $4,066–$4,103.
- Trigger: a probe into the zone followed by a 1-hour rejection close back below $4,060.
- Targets: $3,988 first, then $3,942.
- Invalidation: a 4-hour close above $4,110.
Short setup — continuation below the June low
- Entry zone: the underside of $3,942–$3,955.
- Trigger: a 4-hour close below $3,942.10 that fails a retest from underneath.
- Targets: $3,886.46 first, then $3,789.
- Invalidation: a 4-hour close back above $3,965.
No-trade conditions
- Price between $3,975 and $4,015 with no trigger in hand. That is the middle of Friday's range and the worst entry on the board.
- The first 30 minutes after the 02:00 and 02:30 Thursday FOMC releases, and again after 20:30 the same day, while spreads are wide and the first move is still reversing.
- Any session where an oil gap moves the dollar without a gold level closing beyond it.
- A short opened into $3,942 without waiting for the break to be confirmed by a close. That is where the stop run happens.
- A position opened without a pre-set order at the level named above.
Risk warnings
Main risk: the Fed sounds hawkish on a 90% hold. The decision is priced; the tone is not. If Warsh keeps December at 80% and says further tightening is likely, $3,942 breaks on Thursday and the 33% continuation scenario becomes the week. 18
Fake-move risk. This is a two-event week with the events stacked on Thursday, so Wednesday is a positioning session and Thursday's first move is the least reliable of the week. The $3,905–$3,886 band under the June low is where stops live, and a sweep there that reverses is the trap to expect. 5
News risk. Iran headlines now move gold through two opposed channels. Escalation lifts the inflation premium and hurts; a ceasefire cuts oil and helps. The market has already shown it will take escalation as bearish, so a weekend or mid-session de-escalation headline is the gap risk against every short on this page. 10
Liquidity risk. Volumes are running near 129,000 contracts a day against 400,000-plus historically. In a book that thin, a $50 session and a $100 session look the same on the calendar and nothing like the same on a stop. Size accordingly, not by the calendar's average. 5
Correlation risk. Gold sold off with Bitcoin and the Nasdaq on Thursday. When a portfolio-wide deleveraging starts, gold's own chart stops mattering and the correlation to risk assets is what you are trading. 5
Data gaps and disclaimer
- Real yields. The newest 10-year and 5-year TIPS observations are 22 October. Friday's 23 October value was not yet in either series at the cutoff; the next H.15 release is 26 October. 1314
- Intraday timeframes. No permitted source carries continuous 4-hour or 1-hour spot OHLC. The 4-hour read here is Arslan Ali's published chart work — a break of the $4,075 floor, a falling trendline capping every rally since late August, price below both averages, RSI near 26 — and the 1-hour timeframe appears only as a confirmation condition on named levels. 7
- Three-month performance. The spot feeds read here publish one-day, one-week, one-month, year-to-date and one-year changes; there is no three-month column. The three-month statement rests on the June and July anchors quoted above, not on a computed return. 2
- Demand data. ETF flows and official-sector purchases are monthly. The newest ETF report covers September and was published 7 October, with the page's data stamp running to 16 October; the newest central-bank report covers August and was published 6 October. No flow or tonnage figure exists for the week just traded, and GLD's daily holdings are outside the permitted sources. 1619
- Fed pricing. The live CME FedWatch tool is not directly readable from here. The October probabilities come from Investing.com's Fed Rate Monitor, built on CME 30-day fed funds futures, updated 24 October 12:35 EDT. The December distribution comes from a timestamped FedWatch snapshot of 23 October 02:25 CT. The two are 18 hours apart and differ by about five points on the "at least one hike" total; both are quoted with their timestamps rather than blended. 618
- Central-bank decision times. The Bank of Canada, ECB and Bank of Japan decisions this week were not published with clock times on the sources read, so only their days appear above.
Every figure in this report is a confirmed observation at its stated date, or an explicitly labelled forecast or probability. Probabilities describe what the levels and the calendar make more or less likely; they are not predictions of outcome. Nothing here is a guarantee of profit, and no setup should be taken without the invalidation level written above it.
References
- 1CNBC XAU/USD quote
cnbc.com
- 2FXEmpire live gold page
fxempire.com
- 3Investing.com XAU/USD technical analysis
investing.com
- 4
- 5
- 6
- 7FXEmpire: Oil Shock Revives Rate Fears
fxempire.com
- 8
- 9Federal Reserve: Calendar, October 2026
federalreserve.gov
- 10CNBC: Brent crude oil tops $116
cnbc.com
- 11CNBC .DXY quote
cnbc.com
- 12CNBC US10Y quote
cnbc.com
- 13FRED: 10-year TIPS real yield (DFII10)
fred.stlouisfed.org
- 14FRED: 5-year TIPS real yield (DFII5)
fred.stlouisfed.org
- 15FRED: 10-year breakeven inflation rate (T10YIE)
fred.stlouisfed.org
- 16
- 17FXEmpire: Zernov — Gold Tests $4000
fxempire.com
- 18Investing.com Fed Rate Monitor Tool
investing.com
- 19
This story was produced automatically by a channel. One sentence is all it takes for Neodrop to keep producing for you.