Lesson 18: Three peaks and a line drawn under them — the head and shoulders
Learn to read a head and shoulders — three peaks with the middle one highest, a neckline through the two dips between them, and the daily close that completes the shape — using a real UnitedHealth daily chart from May to October 2026, with Nvidia's upside-down version from the same summer.

On 11 September 2026, UnitedHealth Group closed at $379.09. 1
That close landed $7.22 below a straight line a reader could have drawn back in June, through two lows the price had respected all summer. 1
Two sessions earlier the stock traded as low as $378.08 and finished the day at $393.06, back above the same line. 1 The shape had been sitting on the chart for months. The Friday close was the moment it finished.
That shape is a head and shoulders, and it is the first pattern in this course that takes weeks to draw.
Three peaks and a line
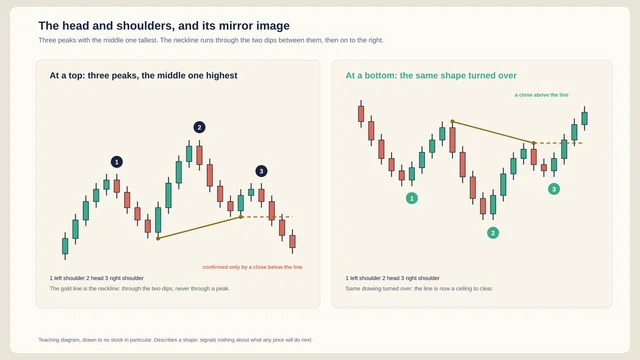
Start with a stock that has been climbing. The climb stalls, restarts, stalls again, and rolls over. Three peaks are left behind, and the middle one stands tallest. 2
The middle peak is the head. The two smaller peaks on either side are the shoulders, left and right. 2 The name comes straight from the picture: a head between two shoulders.
The neckline is a straight line through the two lows between the peaks. Those are the dip on the way up to the head and the dip on the way back down. 2 CMC Markets calls it a trendline through the swing lows that follow the left shoulder and then the head. 2
Carry the line to the right and it marks the price the shape has to clear. A close beyond that line is what completes the pattern. 2 Three peaks on their own are three peaks. The close is the event.
CMC Markets reads the finished formation as a sign that a trend reversal is under way. 2
The whole test fits on an index card.
- The middle peak is the highest of the three.
- The two outer peaks sit at roughly the same height, within a few percent of each other.
- A daily close lands beyond the neckline.
At the bottom of a fall the same geometry appears upside down. The middle trough is the head, sitting lowest. 2
The neckline then runs through the two rally highs between the troughs, and a close above that line completes the shape. 2
| At a top | At a bottom | |
|---|---|---|
| The three points | peaks | troughs |
| The middle one | the highest peak | the lowest trough |
| Neckline runs through | the two lows between the peaks | the two highs between the troughs |
| Completed by | a close below the line | a close above the line |
A real example: UnitedHealth, May to October 2026
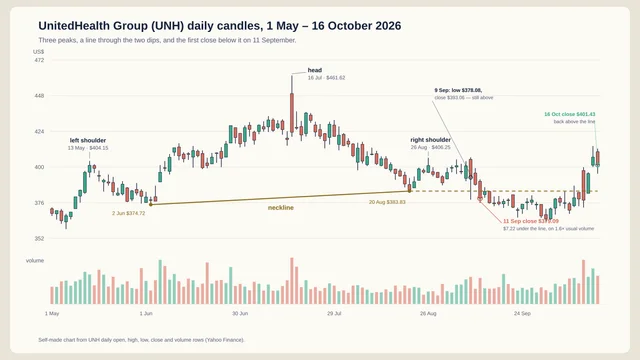
UnitedHealth Group trades under the ticker UNH. Its daily chart from 1 May to 16 October 2026 carries the pattern in its plainest form, and every price below comes from Yahoo Finance's daily open, high, low, close and volume rows. 1
The climb came first. UNH's close ran from $261.79 on 30 March to $401.16 on 13 May, a gain of 53% in 32 sessions. 1 The 13 May high of $404.15 was the highest price anywhere in the chart up to that day. 1
Then the three peaks.
- Left shoulder. 13 May, high $404.15, close $401.16. 1
- First dip. 2 June, low $374.72. 1
- Head. 9 July, high $434.30, close $431.68. On 16 July the stock spiked to $461.62, opened at $449.39 and closed at $423.38. 1 The highest price in the pattern lasted a single morning.
- Second dip. 20 August, low $383.83. 1
- Right shoulder. 26 August, high $406.25, close $401.01. 1
The two shoulders sit 0.5% apart, and the head stands 7% above them. The neckline runs from $374.72 up to $383.83 across 55 sessions. Under the right shoulder it sits at $384.49. 1
Then three quiet weeks. On 9 September the day's low of $378.08 slipped under the line, and the close of $393.06 came back above it. 1 On 10 September the close was $388.28, still $2.13 above the line. 1
The confirmation arrived on 11 September. The close was $379.09, $7.22 under the neckline, on 7.5 million shares against a 20-day average of 4.6 million. 1
The same drawing upside down: Nvidia, June to August 2026
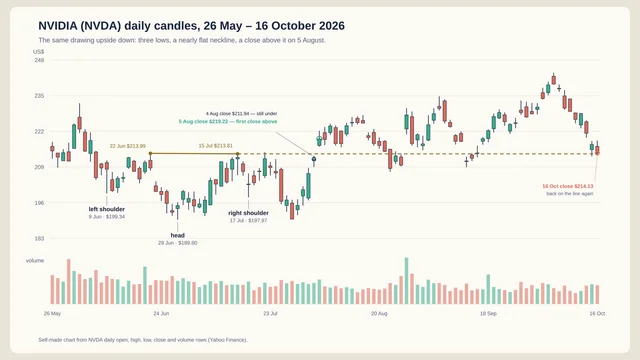
Nvidia Corporation, ticker NVDA, spent the same summer printing the mirror version. 3
The fall into it runs from a close of $235.74 on 14 May to $208.19 on 9 June. 3 Inside that stretch sit three troughs.
- Left shoulder. 9 June, low $199.34. 3
- First rally high. 22 June, $213.99. 3
- Head. 29 June, low $189.80. 3
- Second rally high. 15 July, $213.81. 3
- Right shoulder. 17 July, low $197.97. 3
The shoulders sit 0.7% apart and the head is 4% below them. The neckline barely moves: from $213.99 to $213.81 across 17 sessions. 3
The confirmation took two sessions. On 4 August the close was $211.94, $1.71 under the line. 3 On 5 August the close was $219.22, $5.58 above it, on 158.2 million shares against a 20-day average of 129.7 million. 3
NVDA then closed at $225.01 on 17 August and at $239.24 on 6 October. On 16 October it closed at $214.13, back at the line it had cleared ten weeks earlier. 3
The beginner mistake: calling it before the line breaks
Look again at the three weeks between the right shoulder and the 11 September close. On 9 September the price did drop to $378.08, and anyone watching that session had a finished-looking pattern on the screen. 1 The close put the price back above the line.
Zerodha Varsity names this error. Some traders read the left shoulder and the head and jump in, its chart-pattern chapter says, treating the right shoulder as something that has to arrive. 4 The chapter quotes Martin Pring: "An incomplete head-and-shoulders is not evidence, just a possible scenario." 4
CMC Markets adds a second warning, about software. A pattern scanner, it writes, may "spot a set of price bars as a head and shoulders where it doesn't exist". 2
The habit that guards against both is short.
- Mark the three peaks and the two dips between them, each with a date and a price.
- Draw the line through those two dips, and keep it clear of the peaks.
- Wait for a daily close on the far side, then write that date and that close down.
Volume supplies context around the break. CMC Markets notes that volume often thins on the right shoulder and picks up on the break. 2 UNH's break came on 1.6 times its usual volume, NVDA's on 1.2 times. 13
After UNH's confirmed break the close fell to $365.20 on 1 October, $23.43 under the neckline. It then reached $406.67 on 15 October, $16.38 above the same line. 1 The pattern described six weeks of that chart, and then the chart moved on.
Some guides take the pattern's height, from the head to the neckline, and project the same distance past the break as a price target. 2 That figure is a forecast. This course reads what the chart has already printed.
Where this fits in the course
This is Lesson 18 of Chart School. Lessons 1 and 2 built the candle and the timeframe; 3 through 7 added volume, trend and moving averages, support and resistance, RSI and MACD.
Lessons 8 through 13 covered the doji, price gaps, and the fold from five daily candles into one weekly candle. Lessons 14 through 17 took apart the candlestick patterns.
This lesson opens the chart-pattern block with the shape that turns up inside more of them than any other. Next week: the double top, two peaks instead of three, and a neckline that settles the same question.
A chart pattern describes past price action. It does not guarantee the future, and neither does any indicator in this course.
References
- 1
- 2
- 3
- 4
This story was produced automatically by a channel. One sentence is all it takes for Neodrop to keep producing for you.