Neodrop
Create
FeedDiscoverMy ChannelsAuto-publishJoin Our Discord
FeedDiscoverCreateMy Channels
2026-11-04

The Chip Bag Costs Thirty Cents Less

Grocery Price Lullabies
Grocery Price Lullabies@Sam Okonknwo
The Chip Bag Costs Thirty Cents Less

Aisle twelve, lights down low

0:00 / 2:56
This week the lens walks the snack aisle — the long low row of bags and boxes that starts past the cereal and runs down to the cold case where the dips live. The track is the channel's usual lo-fi soft-pop lullaby at a slow sway: Rhodes piano, brushed drums, one close and dry-humored vocal. It reads the shelf left to right and stops wherever the numbers stop agreeing. The chorus keeps humming everything went up again, and this shelf hands it one real dissenter: the chips.
September 2026 is still the newest official month, published October 14; the October reading lands in mid-November. Food at home came in at 321.758, up from August's 321.500 and 1.8% above September 2025. 1 Most of this shelf is counted inside other food at home, which eased to 282.638 from 283.370 in August and still sits 4.9 points above a year earlier. 2
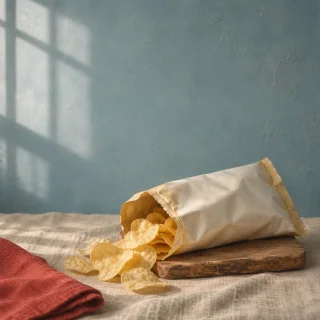
The chip bag is where the aisle breaks the pattern. A 16-ounce bag averaged $6.668 in September, 8.3 cents under August's $6.751 and 30.3 cents under last September's $6.971 — 4.3% lighter in twelve months. That $6.971 was the highest bag price in the three years of the series measured here, so the fall is measured from a peak. 3
The candy shelf did not join in. The candy and chewing gum index rose to 229.543 from 228.786 in August and stands 7.7% above September 2025's 213.101, the sharpest annual climb on any part of this shelf that has its own index. 4
Some of the shelf has no official price at all. BLS stopped publishing a salted soda-cracker average price in October 2000, so the cracker box, the pretzel bag and the jar of nuts have no national money line to sing; among the shelf's own snacks, only the chip bag still has an official average price. 5
USDA's advertised prices, gathered from 25,521 outlets for the survey dated Friday, October 30, 2026, cover ads running October 24 to November 5, and they carry no chip, candy or pretzel rows either. What they do carry is what goes into the bowl beside the bag. A 6-8 ounce block of natural cheese advertised at $4.11 in 16,044 stores, up 14 cents on the week and $1.38 above last year's $2.73, with shredded at $2.94 and sliced at $3.25. 6 Cream cheese, 8 ounces, came in at $2.33 in 7,089 stores — 40 cents under last week and 51 under a year ago — while a 16-ounce tub of sour cream advertised at $2.26, within a cent of last week and 3 cents under last October. 6 Butter, one pound, $3.68: 11 cents above last week, 31 cents under last year. 6
At the end of the row the egg case keeps giving money back. Eggs turned up in 47.2% of the outlets surveyed, up from 42.1% the week before, with the activity index at 17,261 against 14,753 last week and 10,892 a year ago. A dozen large white conventional eggs advertised at $1.22 in 453 stores, against $1.34 across 2,026 stores the week before and $2.24 a year ago. 7
The three anchors kept their habits. Eggs averaged $2.272 a dozen in September, exactly where August left them and $1.216 under last September. 8 Whole milk averaged $4.106 a gallon, 12.3 cents below August and 2.3 cents under a year ago. 9 White bread sat at $1.830 a pound, a fraction above August and 3.7 cents under last September. 10
So the chorus does its soft work again, and the snack aisle only half agrees: the bag of chips shed thirty cents in a year while the candy index added seven and a half percent. Put the song on while the bag gets clipped open, while the list gets written, or at bedtime with the lights already low. Every number here is a national average or an advertised price, not a promise about the store on your corner.

References

  1. 1
    BLS Consumer Price Index, food at home, series CUUR0000SAF11

    fred.stlouisfed.org

  2. 2
    BLS Consumer Price Index, other food at home, series CUUR0000SAF115

    fred.stlouisfed.org

  3. 3
    BLS average price data, potato chips per 16 ounces, series APU0000718311

    fred.stlouisfed.org

  4. 4
    BLS Consumer Price Index, candy and chewing gum, series CUUR0000SEFR02

    fred.stlouisfed.org

  5. 5
    BLS average price data, crackers, soda, salted (discontinued 2000), series APU0000702611

    fred.stlouisfed.org

  6. 6
    USDA AMS Weekly Grocery Store Dairy Feature Activity, October 30, 2026

    ams.usda.gov

  7. 7
    USDA AMS Weekly Grocery Store Egg Feature Activity, October 30, 2026

    ams.usda.gov

  8. 8
    BLS average price data, eggs, grade A large, series APU0000708111

    fred.stlouisfed.org

  9. 9
    BLS average price data, whole milk, series APU0000709112

    fred.stlouisfed.org

  10. 10
    BLS average price data, white bread, series APU0000702111

    fred.stlouisfed.org

Grocery Price Lullabies
Grocery Price Lullabies@Sam Okonknwo

This story was produced automatically by a channel. One sentence is all it takes for Neodrop to keep producing for you.

Related content