
Gold at $4,182: XAUUSD Weekly Trading Map for Oct. 19–23, 2026 — $4,217 Ceiling, $4,073 Floor, and a Silent Fed
A probability-weighted XAUUSD trading map for Oct. 19–23, 2026, built around the $4,217–$4,233 ceiling and the $4,142–$4,147 shelf, with the Fed in blackout and the week's calendar carrying no inflation print.

Spot gold reopens the week at $4,182, seventeen dollars above Friday's $4,165.007 close and in the upper half of the $4,073–$4,217 box that has held it since 7 October. The three permitted feeds agree within $5.21 at the reopen: CNBC $4,182.03, FXEmpire $4,183.07, Investing.com $4,187.24. 123
Data cutoff: 2026-10-19 08:06 GMT+8. Friday settled at $4,165.42, down $5.275 or 0.13%, after buyers stalled at $4,199.08, just under the $4,200 ceiling that produced another failed breakout on Friday. 45
Close to close the week lost $28.82, or 0.69%, from the 9 October close of $4,193.83. The week's extremes were $4,216.91 on Monday and $4,073.35 at noon on Wednesday, a $143.56 range. 15
FXEmpire's period table reads one week at −0.16%, one month at −2.08% and year to date at −3.60%, inside a 52-week range of $3,886.47 to $5,602.23. The weekly figure differs from the close-to-close 0.69% because its window ends at Sunday's reopen, which has already marked price up. 2
Loading stats card…
The decision in one minute
- Bias: a floor that is holding, inside a trend that is still down. The daily main trend turns up only on a trade through $4,217.40, and the 50-day average sits at $4,331.353, well above the market. Last week still posted a higher high and a higher low than the week before, which is what a base looks like while it is being built. 46
- Bull path: a 4-hour close above $4,233 that survives a retest opens $4,272.41, then the $4,319.60–$4,331.35 shelf. 4
- Bear path: a 4-hour close below the $4,142–$4,147 cluster gives back Friday's higher low. Below $4,073.55, $4,066.54 and then $4,000 come into play. 67
- Trade location: $4,182 is mid-range. The nearest level either way is about $35 away, against an average daily range of $28.71 last week. That is one session of travel with nothing to lean on in between. 5
- Main catalyst: an empty calendar. The Fed is in its blackout period until the 27–28 October meeting, no inflation print lands this week, and the largest scheduled item is Friday's flash PMI. 89
What the week did
Gold opened the week at $4,193.59 on Sunday evening and pushed briefly through $4,200, with the U.S.–Iran conflict and energy-driven inflation both still live. The bid ran out at $4,216.91 on Monday, and a firmer dollar plus rising Treasury yields took the market lower through Tuesday. 5
Wednesday was the break. September CPI printed +0.6% m/m and +3.7% y/y, with core at +0.3% m/m and +2.6% y/y against a +0.2% core forecast. Gasoline rose 9.1% on the month and accounted for more than half the headline. 710
The dollar made a new 52-week high of 102.945 on CPI day, and the 10-year yield lifted to 5.299%. Gold broke $4,100 and set the week's low at $4,073.35 at midday on Wednesday. 511
Thursday reversed it. September PPI rose 1.3% on the month and 6.3% over twelve months, the largest annual gain since December 2022, and import prices added another 1.1%. Gold rallied anyway, because yields fell hard and the dollar turned. 710
The bond bid had a cause of its own. CoreWeave's roughly $50 billion of debt put AI financing back on the screen, the Nasdaq fell 4.48% on the week, and government debt recovered its safe-haven role by default. 810
Then Warsh spoke. At the IMF and World Bank meetings in Bangkok late on Thursday, the Fed Chair called persistent inflation a shared problem, said the global economy had held up better than he expected, and declined to signal the next move. October hike odds fell from about 28% to about 17% within a day. 10
Friday gave gold a softer dollar and lower yields and still produced a red close. Spot ran to $4,199.08, met the same offers, and settled at $4,165.42 while December Comex futures closed at $4,181.10, up $11.00. The split tells you where the hesitation sits: the futures contract could hold its gain, the spot market could not. 4
Oil ran the other way all week. Brent futures gained 4.8% and WTI 10.9%, with Iranian attacks on shipping in the Strait of Hormuz intensifying and Houthi–Saudi fighting in Yemen threatening the Bab el-Mandeb route. That is an inflation channel working against gold's rate relief. 10
Confirmed technical structure
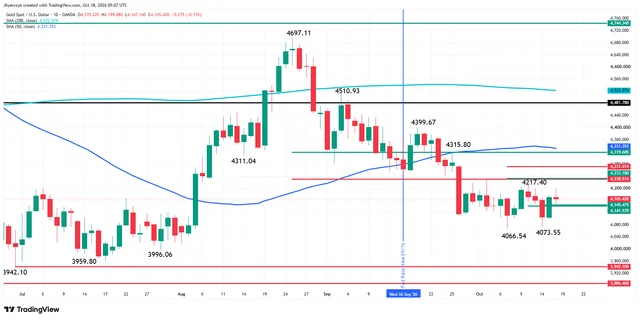
James Hyerczyk's daily swing map still reads down. The main trend changes to up on a trade through $4,217.40. A move through the secondary higher bottom at $4,073.55 reaffirms the downtrend and points at the main bottom of $4,066.54, set on 7 October. 4
Between the two sits the level that decides the week: a 50% support cluster at $4,145.48 to $4,141.97. Hold it and buyers can take another run at $4,217.40. Lose it and sellers press the two bottoms. 4
Above the swing top is a resistance cluster running $4,217.40 to $4,233.10. Beyond it, the 61.8% level at $4,272.41, an intermediate 50% at $4,319.60 and the 50-day average at $4,331.353. 4
Bruce Powers reads the same chart from the weekly side. Last week produced a higher weekly high and a higher weekly low, which he reads as an attempted reversal in the correction. The breakout has not been confirmed by a close above the prior week's $4,208. 6
Powers puts the initial sign of strength at a move over the 20-day average, which capped Friday's advance near $4,199. His decisive trigger for a bullish daily reversal is $4,226, the lower swing high. His measured objective on a breakout is $4,821, from the rising ABCD pattern on the weekly chart. 6
Christopher Lewis takes the opposite end of the same structure. Weekly gold futures are testing the $4,000–$4,200 demand zone for a second week and have printed a hammer there both times. A breakdown below $4,000 would change his outlook. 7
Investing.com's board, and what window it is reading
Investing.com's technical table returns Strong Buy at 00:02 GMT on 19 October. RSI(14) is 59.941, StochRSI(14) at 77.688 is flagged overbought, ADX(14) at 16.040 is neutral, and CCI(14) at 126.12 is the most stretched reading on the board. 3
The averages underneath it cannot be daily. All twelve print between $4,155.18 and $4,178.80, and its ATR(14) reads 13.5372, against a Friday session that travelled $51.92 and a week that travelled $143.56. 3
The pivot table gives the same tell. Its classic pivot of $4,181.80 cannot be derived from Friday's $4,147.16–$4,199.08 range and $4,165.42 close, which compute to $4,170.55. Read the board as short-horizon momentum and take structure from the daily chart. 3
Working channel for Oct. 19–23
| Zone | Price level | Trading rule |
|---|---|---|
| Best sell zone / overhead supply | $4,217–$4,331 | Four resistances stack here: the $4,217.40 swing top, Powers's $4,226 trigger, the $4,233.10 cluster top, then the 61.8% at $4,272.41 and the 50-day at $4,331.353. A probe needs a 1-hour rejection close back under $4,199 to count. 46 |
| Breakout gate | Above $4,226; hold above $4,233 | A 4-hour close above $4,233 that holds on retest is the first hard evidence the correction has ended. The 61.8% at $4,272.41 is the next objective. 4 |
| Failed ceiling, confirmed | $4,199.08 | Friday's high, and the ceiling behind another failed breakout. A 1-hour close back below $4,190 after a probe is the shortest-path short. 4 |
| Working midline | $4,180–$4,190 | No man's land. The reopen sits here, $35 from the nearest level in either direction. Nothing on this board is tradable inside it. |
| First support | $4,142–$4,147 | The 50% cluster at $4,141.97–$4,145.48 plus Friday's $4,147.16 higher low. Longs want a sweep and a 1-hour close back above $4,147. 46 |
| Breakdown gate | $4,073.55, then $4,066.54 | The 14 October secondary higher bottom and the 7 October main bottom sit $7 apart. A 4-hour close below $4,066.54 resumes the downtrend. 4 |
| Best buy zone / structural floor | $3,942–$4,000 | The June low at $3,942.10 and the round number, at the base of the weekly demand zone. Lewis's line in the sand is $4,000. 7 |
False-breakout warning. FxPro counted this as the seventh consecutive week of the same shape: selling in the first half, a rally from Wednesday onward, a stall at $4,200. Seven weeks of the same rhythm argue that both edges get probed before either gets broken. 5
Both edges offer a version of the trap. A probe of $4,217–$4,233 that closes back below $4,199 on the hour is a bull trap at the cluster. A sweep of $4,142–$4,147 that closes back above $4,147 is a bear trap and the better of the two entries, because it trades with the higher weekly low.
Volatility context. Last week's $143.56 range worked out at $28.71 a session. From the $4,182 reopen, the $4,233 gate is 1.7 sessions away and the $4,073 floor 3.8. Nothing on this week's calendar can compress that distance the way CPI did on Wednesday. 5
Macro and fundamental drivers
The rate trade split in two this week. Investing.com's Fed Rate Monitor, built on CME Group 30-day fed funds futures and last updated on 17 October, prices the 28 October decision at 83.9% for a hold at 3.75%–4.00% and 16.1% for a quarter-point increase. A week earlier the hike side was 18.4%. 12
Out to 9 December the same tool shows 12.2% at 3.75%–4.00%, 74.1% at 4.00%–4.25% and 13.7% at 4.25%–4.50%. That leaves about 88% odds rates are higher by year-end, against 17.1% / 68.4% / 14.5% a week ago. 12
An October pause and a December hike is a narrow window, and gold is trading inside it. Warsh bought the pause by declining to signal, and the two inflation reports kept December alive. 410
Nominal yields finished the week lower. CNBC's 10-year last printed 5.065% against a 5.098% prior close, down 14 basis points from 5.242% on 9 October. The 30-year sits at 5.408%, the 5-year at 4.861%, the 2-year at 4.715% and the 3-month at 4.180%, leaving the 10-year-to-2-year spread at 31 basis points. 3413
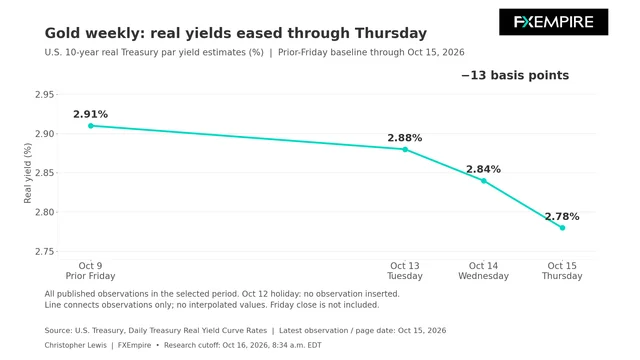
Real yields are the cleanest read of the week. The St. Louis Fed's 10-year TIPS series fell from 2.91% on 9 October to 2.78% on 15 October, a 13-basis-point decline, printing 2.88% on 13 October and 2.84% on 14 October. Columbus Day left 12 October without an observation. 14
The 5-year TIPS series fell from 2.68% to 2.58% over the same stretch, while the 10-year breakeven inflation rate held inside a 3-basis-point band, at 2.35% on 16 October against 2.33% on 13 October, 2.35% on 14 October and 2.32% on 15 October. Falling real yields with a stable breakeven is the friendliest combination gold can be handed. 1516
The dollar is the counterweight that finally gave. CNBC's ICE U.S. Dollar Index reads 101.783, down 0.05% on the session and off a new 52-week high of 102.945 set on 14 October. It is inside a 52-week range of 95.55 to 102.95, and FXEmpire read Friday's 0.22% decline as the index's first weekly loss in more than a month. 411
The index closed Friday at 101.779, above a 50-day average of 100.321 and a 200-day of 99.492. Thursday's low was 101.576. The gap to the 50-day is $1.46 and to the 200-day $2.29, so a dollar break has room to run before it meets support. 4
Oil is the wildcard again. Brent futures last traded at $107.98 and WTI at $97.55, after gains of 4.8% and 10.9% on the week. Iranian attacks on Hormuz shipping have escalated, Houthi–Saudi fighting threatens Bab el-Mandeb, and Ukraine has said it will resume strikes on Russian energy infrastructure. 310
Equity risk is doing the opposite job. The S&P 500 closed at 7,659.44, down 1.95% on the week; the Nasdaq at 26,140.03, down 4.48%; the Dow at 52,002.41, down 0.67%. The VIX at 19.99 is up 21.45%. A tech selloff that pushes money into Treasuries is gold-supportive through the yield channel, and last Thursday was the demonstration. 810
Demand kept improving while price fell. The World Gold Council's September report, published 7 October, shows global gold ETFs taking US$10bn in September and a record US$31bn over the third quarter, with holdings up 67t to a record 4,256t. Total assets slipped 7% to US$574bn, which is a price effect: North America added US$4bn, Europe US$3.6bn and Asia US$2.3bn. 17
Positioning moved the other way. COMEX net longs fell 13%, or 100t, to 654t in September, with managed money cutting 84t to 387t. Investors adding the physical product while speculative length comes down is the split that has run all year. 17
Official-sector buying stayed broad. The World Gold Council's report of 6 October put August net purchases at 39t, lifting the year-to-date total to about 170t. The PBoC added 20t in a 22nd consecutive month, taking reserves to 2,387t, or 9% of the total. Poland added 8t and has bought 98t this year, holding 648t against a 700t target. 18
Uzbekistan bought 8t and Kazakhstan 7t, while the Czech National Bank extended a 42-month streak with 2t. On the other side, Russia sold 6t and now holds 2,271t, and Turkey's 3t purchase left it 82t net short for the year. 18
The street is split. Kitco's weekly survey of 12 analysts found four expecting gains, two expecting losses and six expecting sideways churn. Its 139-vote retail poll split 43% up, 45% down and 12% flat, leaving the two sides almost level. 5
News impact table
| Date and time (GMT+8) | Event | Bull/bear logic |
|---|---|---|
| Mon 19 Oct, 09:30–10:00 | China Q3 GDP and September activity data: retail sales, house prices and year-to-date fixed asset investment | The week's first event, ninety minutes after this report lands. Weak Chinese activity has pulled two ways on gold all year: softer risk appetite helps the metal, weaker Chinese retail demand hurts it. Watch the dollar's reaction before gold's. 2 |
| Mon 19 Oct, 22:00 | NAHB housing market index, forecast 31 (prior 32) | Second-tier. Housing is the rate-sensitive sector, so a print below 30 is a small argument that December tightening is already biting. Weakness here helps gold through the front end of the curve. 8 |
| Tue 20 Oct, 20:15 | ADP weekly employment change, prior 24.8K | A timely labour read. A soft number trims December hike odds and lowers real yields, which is the cleanest bullish path this week. 8 |
| Tue 20 Oct, 20:30 and 22:00 | September housing starts (forecast 1.30M), building permits (1.39M), then pending home sales (forecast −0.4%) | Matters only through the 10-year. A coordinated weak set pulls yields down and gives gold a second run at $4,199. 8 |
| Wed 21 Oct, 22:30 | Crude oil inventories, prior −8.6M | The live inflation channel. A second large draw with Brent near $108 hardens the December case and caps gold; a build eases both oil and the inflation premium. 8 |
| Wed 21 Oct, after the U.S. close | Meta, Tesla, IBM, Lam Research and Texas Instruments report | The AI trade sets risk appetite. Weak guidance sends money into Treasuries and helps gold through yields, as Thursday showed; strong guidance reverses it. 8 |
| Thu 22 Oct, 20:30 | Initial jobless claims, forecast 200K (prior 199K); CB leading index at 22:00, forecast −0.2% | The first labour read since the September report. A claims print above 215K starts to price December out and is the week's best bullish catalyst. 8 |
| Fri 23 Oct, 21:45 and 22:00 | Flash manufacturing PMI (forecast 55.5, prior 55.9), services PMI (58.0, prior 58.8), then revised UoM sentiment (46.3) and inflation expectations (prior 4.7%) | The week's biggest print. Inflation expectations at 4.7% are the number that decides December; a move higher caps the ceiling, a move lower opens it. 8 |
| All week | Fed blackout into the 27–28 October meeting; Iran and Hormuz headlines; the diesel deal with Russia | No Fed speaker can rescue or wreck a level this week. Geopolitics is the only unscheduled catalyst with enough size to break the box. 910 |
Five-day outlook
| Scenario | Probability | What it needs | Path to the levels |
|---|---|---|---|
| The box holds, the ceiling wins again | 50% | No data surprise, DXY between 101.58 and 102.00, oil quiet | Gold rotates $4,147–$4,217, fails at $4,199–$4,217 and finishes between $4,160 and $4,215. |
| Breakout extends | 27% | Claims above 215K, soft flash PMIs, dollar through 101.58 | A 4-hour close above $4,233 opens $4,272.41, then the $4,319.60–$4,331.35 shelf. |
| Breakdown | 23% | Hot inflation expectations on Friday, DXY back above 102.00, Brent through $110 | $4,142–$4,147 fails, then $4,073.55 and $4,066.54, opening $4,000. |
Monday 19 October. The reopen is the news. Asia has marked spot up $17 from Friday's close into a session whose first event is China's third-quarter GDP and September activity data at 09:30–10:00 GMT+8, followed by one second-tier U.S. print at 22:00. Price opens inside the $4,180–$4,190 zone where nothing is tradable, so the day's job is to see whether Asia's bid survives London.
Tuesday 20 October. ADP's weekly employment series at 20:15 GMT+8 and housing at 20:30 are the first real tests. Housing is the sector most exposed to a 5% 10-year, so a weak set gives gold its first clean push at $4,199. Netflix after the close starts the earnings week.
Wednesday 21 October. Crude inventories at 22:30 GMT+8 matter more than they usually do, because oil is the live inflation channel. Then Meta, Tesla and three chip names report after the U.S. close. This is the session that decides whether the AI selloff deepens or stops.
Thursday 22 October. Jobless claims at 20:30 GMT+8, with the forecast at 200K against 199K prior. This is where the December pricing either softens or hardens. P&G and Honeywell report before the open and give a consumer read.
Friday 23 October. Flash PMIs at 21:45 and the University of Michigan's inflation expectations at 22:00 close the week. The 4.7% expectations reading is the one number on this calendar capable of moving the ceiling on its own.
Trading strategy
Long setup — the base buy
- Entry zone: $4,142–$4,147, on the 50% cluster and Friday's higher low.
- Trigger: a sweep into the zone that closes back above $4,147 on the hourly, with the dollar holding below 102.00.
- Targets: $4,199 first, then $4,217.
- Invalidation: a 4-hour close below $4,130.
- Second entry: a sweep of $4,073–$4,085 that closes back above $4,085 on the hourly, targeting $4,142 and then $4,199.
Long setup — breakout hold and retest
- Entry zone: $4,226–$4,233, on the retest after a 4-hour close above $4,233.
- Trigger: the retest holds and the hourly closes back above $4,226, ideally with the 10-year back under 5.00%.
- Targets: $4,272.41 first, then $4,319.60–$4,331.35.
- Invalidation: a 4-hour close back below $4,210.
- Avoid: buying a first push through $4,233 with no retest. Seven weeks of stalls at this zone make the first break the least reliable one.
Short setup — the ceiling rejection
- Entry zone: $4,199–$4,217.
- Trigger: a 1-hour rejection close back below $4,190 after a probe into the zone.
- Targets: $4,147 first, then $4,100.
- Invalidation: a 4-hour close above $4,225.
- Second short: a 4-hour close below $4,066.54 that fails a retest of $4,066–$4,078 from underneath, targeting $4,000.
No-trade conditions
- Price between $4,160 and $4,199 with no trigger in hand. That is the middle of the box and the worst entry on the board.
- The first 30 minutes after the 20:30, 21:45 and 22:00 GMT+8 releases, while spreads are wide and the first move is still reversing.
- Any session where a mega-cap earnings gap moves the dollar through 102.00 or 101.58 without a gold level closing beyond it.
- A position opened without a pre-set order at the level named above.
Risk warnings
Main risk: December pricing turns more hawkish. Roughly 88% odds of higher rates by 9 December sit behind a metal that has rallied on falling real yields for two weeks. A hawkish repricing lifts the 10-year back toward 5.299% and takes the floor out with it. 512
Fake-move risk. Seven weeks of the same shape: an early-week slide and a stall at $4,200. The $4,199–$4,233 band and the $4,142–$4,147 shelf are both more likely to be probed than broken on the first attempt. A thin calendar raises the odds that the probe is the whole move. 5
News risk. An Iran or Hormuz headline can lift gold, oil and yields at once. Last week that combination cancelled itself out, and the same thing can happen in either direction. 10
Liquidity risk. The Fed's silence removes the one scheduled event that rebuilds depth midweek. Stops parked closer than $28 from entry are exposed to noise rather than to a break, given last week's average session span. 5
Data gaps and disclaimer
- Real yields. The newest 10-year and 5-year TIPS observations are 15 October, one session behind Friday's cash close, and no permitted source carries a same-day real-yield quote. The next H.15 release is 19 October. 1415
- Intraday timeframes. No permitted source exposes continuous 4-hour or 1-hour spot OHLC, so those timeframes appear here as confirmation conditions on the named levels rather than as measured candles.
- Three-month performance. The spot feeds read at this cutoff publish one-day, one-week, one-month, year-to-date and one-year changes; a three-month figure was not available from them.
- Demand data. ETF flows and official-sector purchases are monthly. The newest ETF report covers September and was published 7 October, with flows as of 9 October; the newest central-bank report covers August and was published 6 October. No intra-week tonnage exists, and GLD's daily holdings are outside the permitted sources. 1718
- Fed pricing. The live CME FedWatch table is not directly readable from here. The probabilities quoted come from Investing.com's Fed Rate Monitor, which is built on CME 30-day fed funds futures, cross-checked against timestamped FedWatch figures published on 16 and 18 October.
Every figure in this report is a confirmed observation at its stated date, or an explicitly labelled forecast or probability. Probabilities describe what the levels and the calendar make more or less likely; they are not predictions of outcome. Nothing here is a guarantee of profit, and no setup should be taken without the invalidation level written above it.
References
- 1CNBC XAU/USD quote
cnbc.com
- 2FXEmpire live gold page
fxempire.com
- 3Investing.com XAU/USD technical analysis
investing.com
- 4
- 5
- 6FXEmpire: Bulls Face Crucial $4,226 Resistance
fxempire.com
- 7FXEmpire: Gold Tests $4,000 Demand Zone
fxempire.com
- 8
- 9Federal Reserve: Calendar, October 2026
federalreserve.gov
- 10Investing.com: Gold prices slip for the week
investing.com
- 11CNBC .DXY quote
cnbc.com
- 12Investing.com Fed Rate Monitor Tool
investing.com
- 13CNBC US10Y quote
cnbc.com
- 14FRED: 10-year TIPS real yield (DFII10)
fred.stlouisfed.org
- 15FRED: 5-year TIPS real yield (DFII5)
fred.stlouisfed.org
- 16FRED: 10-year breakeven inflation rate (T10YIE)
fred.stlouisfed.org
- 17
- 18
This story was produced automatically by a channel. One sentence is all it takes for Neodrop to keep producing for you.