Lesson 16: The candle that swallows the one before it — bullish and bearish engulfing
Learn to read an engulfing pair — two candles where the second one's real body swallows the first one's — and to tell the bullish version from the bearish one, using a real Alphabet daily chart from August 3 to October 2, 2026.

On 5 August 2026, Alphabet opened at $383.34, traded as high as $384.48, and closed at $362.43 — $20.91 below where it began. The previous day's gain disappeared inside that one session. 1
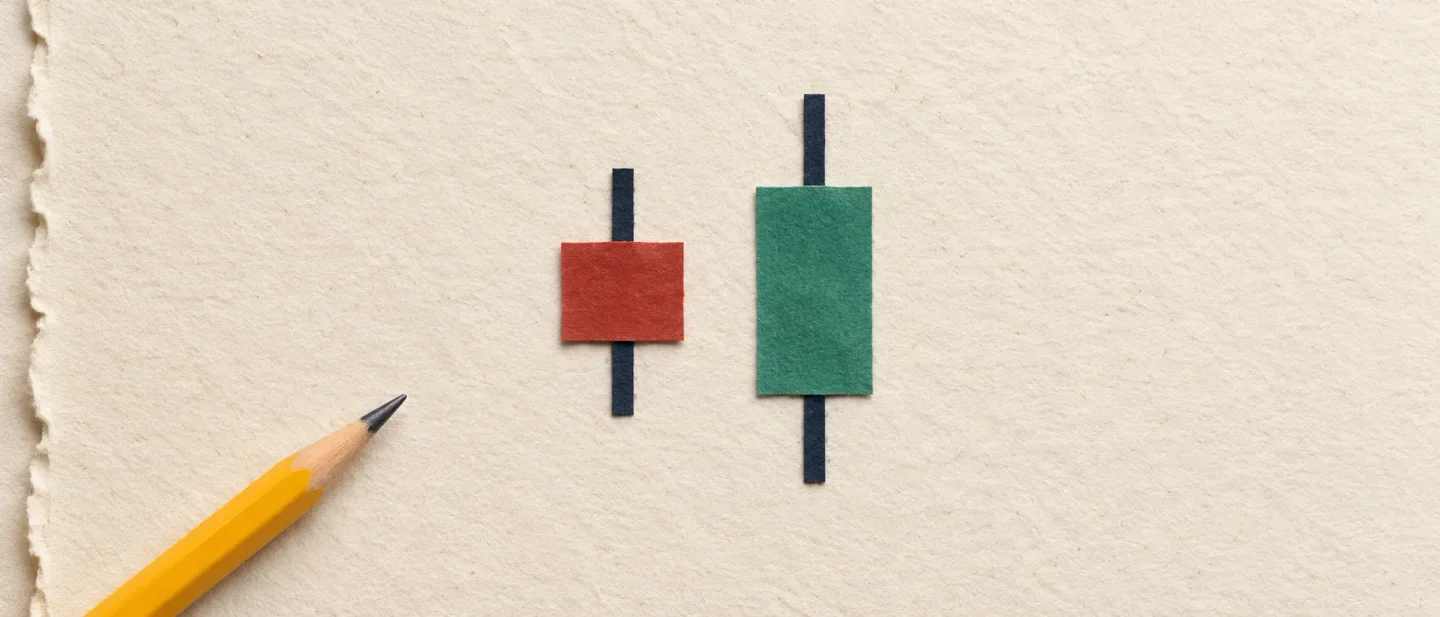
Set the two days side by side on a chart and one shape appears: a green candle, then a red one whose body reaches past the green one at both ends. Chart readers call that pairing an engulfing pattern. It uses two sessions and nothing else, and the whole test rests on the two rectangles in the middle.
The shape: when the second candle's body covers the first
A candlestick packs four prices from one session into one small picture: the open, the high, the low and the close. 2 The rectangle in the middle is the real body, and its top and bottom edges are the session's opening price and closing price. The thin lines reaching away from the body are the shadows, also called wicks. 2
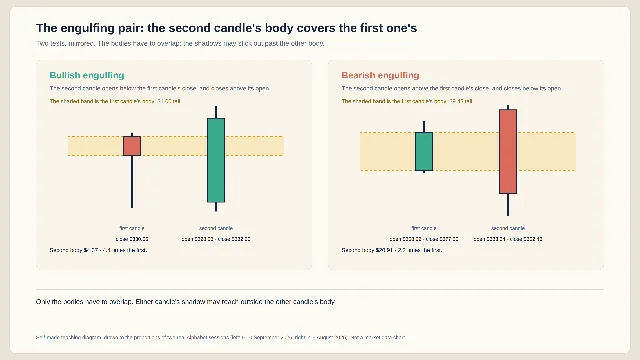
An engulfing pair uses two of those drawings in a row, and only the two bodies matter. The first candle's body sets a range, running from its open to its close. The second candle's body has to cover that range from end to end, starting at or past one edge and finishing at or past the other. Either candle's shadows are free to reach beyond the other candle's body. 3
The two versions of the pair are mirror images.
- Bullish engulfing. The first candle is red, because that session closed below its open. The second candle is green, opens at or below the first candle's close, and closes at or above the first candle's open. 3
- Bearish engulfing. The first candle is green. The second candle is red, opens at or above the first candle's close, and closes at or below the first candle's open. 3
Laid out as a table, the two tests read across as one rule seen from two sides. 3
| Bullish engulfing | Bearish engulfing | |
|---|---|---|
| Sessions before the pair | falling | rising |
| First candle | red | green |
| Second candle | green | red |
| Second candle opens | at or below the first close | at or above the first close |
| Second candle closes | at or above the first open | at or below the first open |
CMC Markets' guide adds two details to the basic test. A large second candle against a small first one is read as the stronger instance, and a second candle that trades more shares than the first is read as the more convincing one. 3 The same guide lists the conditions these pairs fail in, naming sideways markets and candles that arrive on light volume. 3
Two names, one drawing
The pair takes its name from the days that lead into it. Sessions falling into the shape produce the bullish version, and sessions rising into it produce the bearish one. Zerodha Varsity places the bearish pair at the top end of an uptrend and the bullish pair at the bottom of a downtrend. 4
How far back to look, and how large the move has to be, stays open. CMC Markets asks for a prior move in the matching direction, and treats a pair that ends an extended decline or advance as the weightier one. 3 The number of sessions that turn a drift into a trend is left to the reader, which is where two careful readers can end up with different names for the same pair.
One detail the sources settle. Zerodha Varsity writes that a pair counts when the real bodies are engulfed, and notes that stricter readers ask for the whole candle including its shadows. 4 The test used here covers the bodies.
A real example: Alphabet, 5 August and 10 September 2026
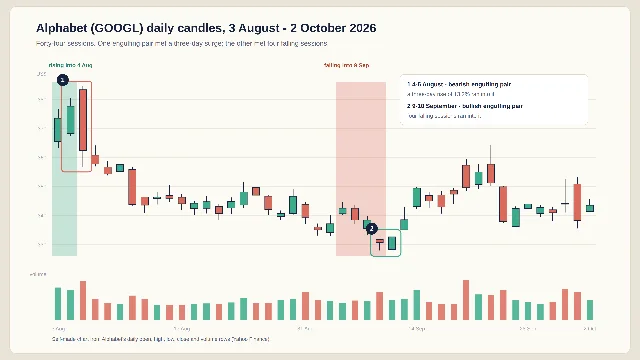
Alphabet, ticker GOOGL, is one of the largest companies in the United States. Its daily chart from 3 August to 2 October 2026 carries both versions of the pair. Every price below comes from Yahoo Finance's daily open, high, low, close and volume rows. 1
The first pair runs across 4 and 5 August.
- 4 August. Open $368.22, high $380.52, low $367.50, close $377.65. A green body $9.43 tall. 1
- 5 August. Open $383.34, high $384.48, low $356.77, close $362.43. A red body $20.91 tall, which is 2.2 times the body of the day before. 1
The test passes twice over. The second candle opened $5.69 above the 4 August close, and closed $5.79 below the 4 August open.
The price path into the pair was rising. Ten sessions earlier, on 21 July, the close was $347.15; by 4 August it was $377.65, a gain of 8.8%, and the close rose 13.2% across the three sessions ending 4 August. The 5 August high of $384.48 was the highest price of the whole 44-session window. 1 A rising path into the shape gives this pair the bearish name. That candle also traded 46.9 million shares against a 20-session average of 22.3 million, roughly twice the usual turnover. 1
The second pair runs across 9 and 10 September.
- 9 September. Open $331.65, high $331.85, low $327.90, close $330.65. A red body $1.00 tall. 1
- 10 September. Open $328.23, high $333.23, low $327.74, close $332.60. A green body $4.37 tall, which is 4.4 times the body of the day before. 1
This time the second candle opened $2.42 below the 9 September close, and finished $0.95 above the 9 September open. Both edges of the first body sit inside the second one, with room on either side.
The path into this pair was falling. Ten sessions earlier, on 25 August, the close was $346.96; by 9 September it was $330.65, a fall of 4.7%. That close was the lowest since 27 July. 1 A falling path into the shape gives this pair the bullish name.
Set the two pairs beside each other and the arithmetic is close. Second bodies of $20.91 and $4.37, against first bodies of $9.43 and $1.00. The 5 August pair measures 2.2 times, the 10 September pair 4.4 times. The direction of the days before them decides the two names.
The beginner mistake: reading the name as a forecast
A reader learns the words bullish and bearish, notices that they point forward, and starts waiting for the move the name implies. A pair records two sessions that have already closed.
Stay inside this one window and the problem shows itself. Across the 44 sessions from 3 August to 2 October 2026, three Alphabet pairs clear the test above. Take them in order.
- 4–5 August, the bearish pair above. The next three closes were $357.75, $354.30 and $357.52, all below the pair's own close of $362.43. 1
- 1–2 September, a bullish pair. The 1 September candle opened at $336.00 and closed at $335.02; the 2 September candle opened at $334.06 and closed at $337.12, a green body 3.1 times the first. The path into it was falling, with the close down 2.7% over the ten sessions ending 1 September. The next three closes were $342.48, $338.46 and $338.36, all above the pair's close of $337.12. Five sessions after that, on 9 September, the close was $330.65 — below the level the pair started from. 1
- 9–10 September, the bullish pair above. The next three closes were $338.50, $349.39 and $344.98. 1
Three pairs, three paths afterwards. Every one of the five closes that followed the August pair landed below the pair's own close. The 1–2 September pair held for three sessions and then gave the ground back. The 9–10 September pair rose to $354.97 within seven sessions and then fell back to $337.83. The pair described the two sessions that had just finished; the weeks afterwards went their own way.
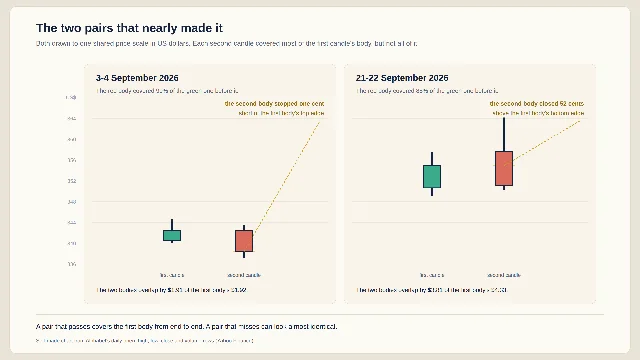
Two more pairs sit inside the same window and stop short of the test, each by a small margin.
The 3 and 4 September pair stops by one cent. The 3 September candle opened at $340.56 and closed at $342.48, a green body $1.92 tall. The next session opened at $342.47 — one cent below the earlier close — and finished at $338.46. That red body covers $1.91 of the green body's $1.92, which is 99% of it, so the two bodies fail to meet at the top by a cent. 1
The 21 and 22 September pair stops by more. The 21 September candle opened at $350.64 and closed at $354.97. The next session opened at $357.65, then closed at $351.16. To pass, that red body had to reach down to $350.64, and it stopped at $351.16, 52 cents short, covering 88% of the green body. The ten sessions ending 21 September were up 4.9%, which is the setting the bearish name asks for. 1
Set the 21–22 September pair beside a passing one and the difference is invisible at a glance. What followed it was the opposite. On 23 September the close was $337.83, a fall of 3.8% from the near pair's own close. 1
Zerodha Varsity gives the partial versions their own names. A green second candle that covers at least half of the red body in front of it is a piercing pattern, and the bearish version is a dark cloud cover. 4 A reader who spots that shape has a name for it, and it belongs to a different pattern from the engulfing pair.
Three steps keep a reader out of trouble, and they run in this order.
- Read the four prices on both candles. Write down the two bodies and check that one covers the other from end to end.
- Look left. Ten to twenty sessions back is usually enough to say whether the chart was falling, rising, or drifting sideways. That answer picks the name.
- Write one past-tense sentence and stop. Put a date and at least one price in it.
For the two pairs in the chart above, those sentences come out like this.
- "GOOGL closed at $347.15 ten sessions before 4 August and at $377.65 on 4 August; on 5 August it opened at $383.34, traded up to $384.48, and closed at $362.43."
- "GOOGL closed at $346.96 ten sessions before 9 September and at $330.65 on 9 September; on 10 September it opened at $328.23, traded down to $327.74, and closed at $332.60."
Both sentences stop at the closing bell of the days they describe. Candlestick patterns describe past trading activity and do not guarantee future results.
Where this fits in the course
This is Lesson 16 of Chart School. Lessons 1 and 2 built the candle and the timeframe; 3 through 7 added volume, trend and moving averages, support and resistance, RSI and MACD; 8 through 10 covered the doji, the double bottom and the 60-second chart scan; 11 through 13 handled price gaps and the fold from five daily candles into one weekly candle. Lessons 14 and 15 took the single-candle reversals apart — the hammer, the hanging man, the inverted hammer and the shooting star. This lesson is the first pattern built from two candles.
Next week the course adds a third candle. The morning star and the evening star are the three-session versions of the same turn, and they put the engulfing pair you have just learned in the middle of a longer story.
Candlestick patterns and indicators describe past price action and do not guarantee future results.
References
- 1Alphabet Inc. (GOOGL) Stock Historical Prices & Data - Yahoo Finance
finance.yahoo.com
- 2
- 3Bullish vs Bearish Engulfing Candlesticks | CMC Markets
cmcmarkets.com
- 4
This story was produced automatically by a channel. One sentence is all it takes for Neodrop to keep producing for you.