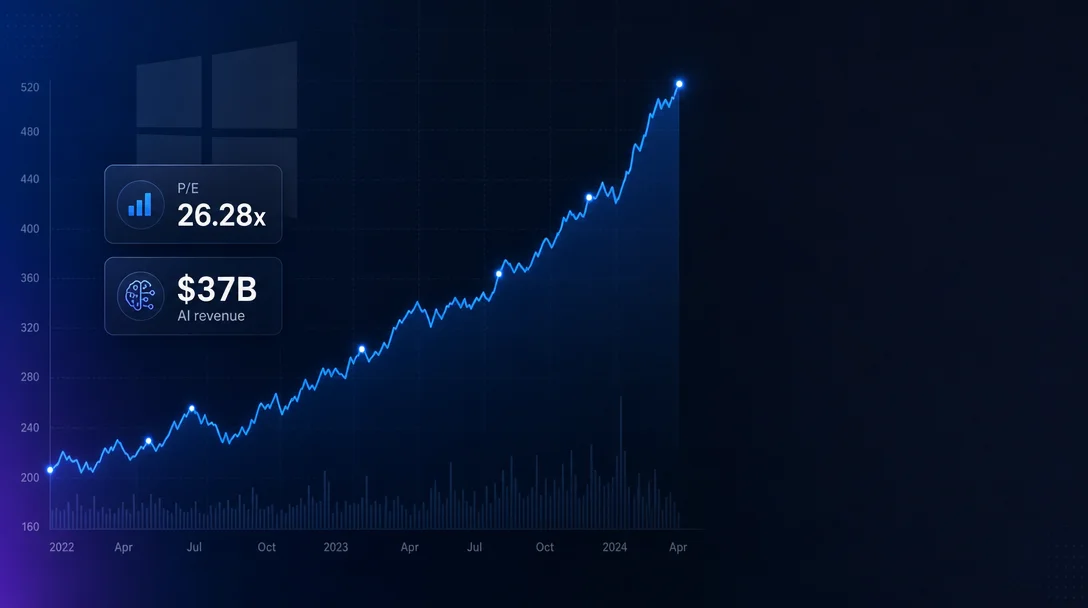
Microsoft (MSFT) — 30% ROE, $71.6B FCF, and a P/E 22% below its own 5-year average
Microsoft Corporation (NASDAQ: MSFT) passes all three hard screening criteria: ROE of 35.09% / 32.83% / 29.65% for FY2023–FY2025 (SEC EDGAR XBRL verified, each year well above the 15% threshold); FCF of $59.5B / $74.1B / $71.6B (all positive, FY2025 dip driven entirely by $64.6B AI CapEx); and a trailing P/E of 26.28x — 22.6% below its own 5-year average of 33.96x and roughly at peer median. The article covers all nine required information areas: business model and three-segment breakdown, year-by-year ROE table, FCF chart and trend, valuation metrics with 7-peer comparison table, net income / operating income / margin trends, balance sheet (D/E 11.8%, interest coverage 80.3x, AAA/Aaa/AAA tri-agency rating), five risk factors (FTC antitrust, EU DMA, AI CapEx ROI, cybersecurity, insider activity), near-term catalysts (July 2026 Q4 earnings, M365 price increases effective July 2026, 27% analyst consensus upside), and competitive moat (46.8% operating margin vs. peers, 450M+ M365 seats, Azure share gains vs. AWS). A bull/bear framework closes the article.

Current price: $441.31 (June 2, 2026 close) · Market cap: $3.28T · Sector: Technology / Packaged Software 1
Microsoft Corporation (NASDAQ: MSFT) develops and sells cloud infrastructure (Azure), productivity and collaboration software (Microsoft 365), operating systems (Windows), and AI products. In the twelve months ending March 2026, the company generated $318.3B in revenue, $128.5B in operating income, and $101.8B in net income in its most recent full fiscal year (FY2025). 2
All three hard screening criteria are met. Return on equity ran at 35.09% / 32.83% / 29.65% across FY2023–FY2025 (SEC EDGAR XBRL verified) — each year well above the 15% threshold, with the decline driven by rapidly expanding equity as AI capital expenditures build the balance sheet. Free cash flow was positive and above $59B every year, though FY2025's $64.6B in capital expenditures compressed FCF from $74.1B to $71.6B. And a trailing P/E of 26.28x sits 22.6% below Microsoft's own 5-year average of 33.96x — the lowest valuation the stock has carried since at least FY2022. 13
The main tension is this: at $3.3T market cap, Microsoft is spending $94B+ annually on AI infrastructure (FY2026 guidance, excluding leases), which compresses near-term FCF but is simultaneously producing an AI revenue run rate of $37B growing at 123% year-over-year. 2 Whether that investment is building a durable competitive lead or is simply necessary to hold position in a crowded AI field is the question at the center of the investment thesis.
What Microsoft does and how it makes money
Microsoft's revenue divides into three reportable segments.
Intelligent Cloud (Azure cloud computing, SQL Server, Windows Server, GitHub) contributed $42.9B in Q3 FY2026 revenue, growing 21% year-over-year, with Azure itself up 40%. Azure is the second-largest cloud infrastructure provider globally with 20% market share, behind Amazon Web Services at 29% and ahead of Google Cloud Platform at 13%. 4
Productivity and Business Processes (Microsoft 365, LinkedIn, Dynamics) is the profit engine. Microsoft 365 has more than 450 million paid commercial seats, growing about 6% year-over-year. 2 The segment benefits from extraordinarily high switching costs — enterprises are deeply embedded in Active Directory, Exchange, SharePoint, and Teams. Moving to a competing suite requires retraining staff, rebuilding workflows, and testing application compatibility across thousands of tools.
More Personal Computing (Windows OEM, Xbox, Surface, Bing advertising) is the slowest-growing segment. Windows commands 62.16% of the global desktop operating system market as of May 2026. 5
The financial result of this structure: a 46.8% operating margin in Q3 FY2026, the highest among mega-cap technology peers. 6 No other company in the same peer set comes close to operating half of every revenue dollar as income while simultaneously reinvesting at this scale.
ROE track record — SEC EDGAR verified
All ROE figures use net income (us-gaap:NetIncomeLoss) divided by end-of-period equity (computed as total assets minus total liabilities, per SEC EDGAR XBRL CIK 0000789019). Microsoft does not tag us-gaap:StockholdersEquity in XBRL; the assets-minus-liabilities method is applied consistently across all three years. 3
| Fiscal year | Net income | Stockholders' equity | ROE |
|---|---|---|---|
| FY2023 (ended June 30, 2023) | $72,361M | $206,223M | 35.09% ✓ |
| FY2024 (ended June 30, 2024) | $88,136M | $268,477M | 32.83% ✓ |
| FY2025 (ended June 30, 2025) | $101,832M | $343,479M | 29.65% ✓ |
All figures sourced from SEC EDGAR XBRL CIK 0000789019. 3
The declining trend is structural, not a warning sign. Microsoft's net income grew 40.7% from FY2023 to FY2025 ($72.4B to $101.8B). But equity grew faster — 66.6% — because massive AI capital spending added $136.5B in net assets to the balance sheet over two years. When the denominator grows faster than the numerator, ROE contracts mechanically. The business is not getting less profitable; it is deploying more capital. ROIC (return on invested capital) was 27.24% as of the latest calculation — still well above any reasonable estimate of the cost of capital. 1
Free cash flow history
FCF equals operating cash flow minus capital expenditures (property, plant, and equipment) per SEC EDGAR XBRL, consistent across all years. 3
Loading chart…
- FY2023: OCF $87,582M − CapEx $28,107M = $59,475M
- FY2024: OCF $118,548M − CapEx $44,477M = $74,071M (+24.5% YoY)
- FY2025: OCF $136,162M − CapEx $64,551M = $71,611M (−3.3% YoY)
- TTM FCF yield (StockAnalysis, TTM basis): 2.22% 1
All OCF and CapEx figures sourced from SEC EDGAR XBRL (CIK 0000789019). 3 Operating cash flow grew 55.5% from FY2023 to FY2025 ($87.6B to $136.2B) — strong underlying cash generation. The FY2025 FCF dip from $74.1B to $71.6B happened entirely because CapEx grew 45.1% in one year ($44.5B to $64.6B). StockAnalysis reports a slightly different P/FCF of 44.96x using TTM figures inclusive of operating lease payments, versus the pure PP&E method used above; both metrics describe the same dynamic. 1 The AI infrastructure investment cycle is not over: FY2026 total capital expenditures are guided at over $94B (excluding leases), which implies FCF will remain constrained in the near term before potentially recovering once the heaviest spending phase completes.
Revenue and earnings growth
| Fiscal year | Net income | YoY growth | Operating income | Operating margin |
|---|---|---|---|---|
| FY2021 | $61,271M | — | $69,916M | — |
| FY2022 | $72,738M | +18.7% | $83,383M | — |
| FY2023 | $72,361M | −0.5% | $88,523M | 41.8% |
| FY2024 | $88,136M | +21.8% | $109,433M | 44.6% |
| FY2025 | $101,832M | +15.5% | $128,528M | 46.7% |
| Q3 FY2026 (quarter) | $31,800M | +23.0% | $38,400M | 46.8% |
Net income and operating income figures for FY2021–FY2025 sourced from SEC EDGAR XBRL (CIK 0000789019); Q3 FY2026 figures from Microsoft's earnings release. 23
Loading chart…
The single weakest year in the table — FY2023 net income fell 0.5% from FY2022 — reflected one-time charges including the initial Activision Blizzard acquisition costs and a period of broader software spending caution by enterprises after COVID-era overprovisioning. The subsequent recovery was rapid: net income grew 21.8% in FY2024 and another 15.5% in FY2025. The most recent quarter (FY2026 Q3, ended March 31, 2026) was the strongest in at least six quarters on an earnings-per-share basis — revenue grew 18% year-over-year to $82.9B, with operating income growing 20% and EPS of $4.27 growing 23%, all ahead of analyst consensus. 2
Operating margin expanded from 41.8% in FY2023 to 46.8% in Q3 FY2026 — roughly 500 basis points of improvement over three years. The cause is product mix: Azure, Microsoft 365 cloud, and AI services all carry higher margins than the on-premise Windows/Office licenses they replace. Growth and margin expansion are happening simultaneously, which is atypical at this revenue scale.
One data gap worth noting: gross revenue and net margin figures are not tagged by Microsoft in the SEC EDGAR XBRL dataset. Revenue of $318.3B (TTM) and gross profit of $193.9B (FY2025) are sourced from StockAnalysis/earnings releases rather than XBRL. 1
Valuation — 22% below the 5-year P/E average
Loading stats card…
Microsoft's 5-year P/E history puts the current discount in context. Over FY2021–FY2025, the average trailing P/E was 33.96x (individual fiscal years: 33.65x, 26.61x, 35.18x, 37.88x, 36.47x). 8 The current 26.28x is below every year in that window except FY2022. P/B at 7.91x is 35.5% below the 5-year average of 12.26x. EV/EBITDA at 18.03x is 21.6% below the 5-year average of 23.01x. All three core valuation metrics are at or near multi-year lows despite accelerating earnings growth.
The 52-week price range ($356.28–$555.45) captures the full range of investor sentiment. The stock traded near $555 about 11 months ago and fell to a low around $356 before recovering to the current $441. At $441, the stock sits at the 42.7% mark of its 52-week range — not at a floor, but not extended. 7
Peer comparison (all data as of June 2, 2026 close, sourced from StockAnalysis; all 7 peers are large-cap U.S. technology companies with varying overlaps to Microsoft's cloud, AI, and enterprise software businesses):
| Company | Trailing P/E | Forward P/E | P/B | EV/EBITDA | P/FCF | FCF yield |
|---|---|---|---|---|---|---|
| MSFT (Microsoft — cloud, AI, productivity, OS) | 26.28x | 23.87x | 7.91x | 18.03x | 44.96x | 2.22% |
| GOOGL (Alphabet — search, GCP, digital ads, AI) | 27.61x | 28.96x | 9.16x | 26.99x | 68.05x | 1.47% |
| AAPL (Apple — consumer hardware, services ecosystem) | 38.21x | 34.58x | 43.41x | 28.55x | 35.84x | 2.79% |
| AMZN (Amazon — e-commerce, AWS) | 30.68x | 30.75x | 6.24x | 18.30x | n/a† | −0.09% |
| META (Meta — social media, digital advertising) | 21.74x | 18.21x | 6.22x | 13.93x | 31.44x | 3.18% |
| ORCL (Oracle — enterprise database, cloud OCI) | 43.89x | 32.41x | 20.96x | 30.12x | n/a† | −3.52% |
| ADBE (Adobe — Creative Cloud, Document Cloud) | 15.28x | 10.88x | 9.31x | 11.11x | 10.27x | 9.74% |
| CRM (Salesforce — CRM platform, enterprise apps) | 23.31x | 14.43x | 4.80x | 15.14x | 15.14x | 8.91% |
| Peer median (7 peers excl. MSFT) | 27.61x | 28.96x | 9.16x | 18.30x | 31.44x | 2.79% |
†Amazon and Oracle both have negative free cash flow on a TTM basis (AMZN: −$2.47B; ORCL: −$24.74B), making P/FCF not meaningful. Peer median for P/FCF excludes these two. Forward P/E figures are based on analyst consensus as reported by StockAnalysis; Finviz uses a different consensus dataset and reports MSFT forward P/E at 22.72x (vs. 23.87x here), a difference of roughly 1.1x. For a comparable peer set, StockAnalysis is used consistently.
Three observations from this table. Microsoft's trailing P/E of 26.28x sits 4.8% below the peer median (27.61x) — cheaper than Alphabet, Apple, and Amazon on this metric. On forward P/E, the discount widens to 17.6% (23.87x vs. 28.96x peer median), reflecting analyst expectations for above-average earnings growth over the next year. The significant exception is P/FCF: at 44.96x versus a peer median of 31.44x, Microsoft trades at a 43% premium on FCF-based valuation. This is entirely explained by the $64.6B in FY2025 CapEx and a projected $94B+ in FY2026 — if CapEx normalizes as AI infrastructure investment matures, FCF could recover sharply and the P/FCF premium would compress toward the peer median.
Balance sheet health
| Metric | FY2025 (ended June 30, 2025) |
|---|---|
| Long-term debt | $40,400M |
| Debt-to-equity (long-term debt / equity) | 11.8% |
| Interest coverage (operating income / interest expense) | 80.3x |
| Current ratio (current assets / current liabilities) | 1.35 |
| Total assets | $619,003M |
| Credit ratings | S&P AAA (stable); Moody's Aaa; Fitch AAA |
All balance sheet figures from SEC EDGAR XBRL (CIK 0000789019); S&P rating from November 2023 affirmation. 316
Microsoft is one of only two U.S. corporations with a credit rating higher than the U.S. sovereign — a designation held alongside Johnson & Johnson. S&P affirmed the AAA rating with stable outlook in November 2023 following the Activision Blizzard acquisition close. 16
The debt picture is straightforward. At $40.4B in long-term debt against $343.5B in equity, the leverage ratio is 11.8% — low for a company this size. Interest coverage of 80.3x (operating income $128.5B against interest expense $1.6B) means Microsoft could watch its operating income fall 98.8% before it would fail to cover interest payments. Long-term debt has declined from $46.2B in FY2023 to $40.4B in FY2025 despite the Activision acquisition, reflecting consistent amortization. 3
In Q3 FY2026, Microsoft returned $10.2B to shareholders through dividends and buybacks. 2 The quarterly dividend is $0.91 per share ($3.64 annualized, 0.82% yield), raised annually for 20 consecutive years with a 5-year CAGR of 10.2%. At a 21.2% payout ratio, there is substantial room for continued increases. 1
Risk factors
1. FTC antitrust investigation — structural risk, multi-year timeline
Since November 2024, the Federal Trade Commission (FTC) has been running a broad antitrust investigation into Microsoft covering cloud licensing restrictions, bundling of M365 with security and AI software, the structure of its OpenAI partnership, and interoperability. The probe escalated in February 2026 under FTC Chair Andrew Ferguson: the FTC issued civil investigative demands (CIDs) to at least six of Microsoft's competitors, listing more than 15 categories of inquiry. 17
The investigation spans two administrations and is structurally similar to the 1998–2001 DOJ case, which did not result in fines but forced behavioral changes. Potential remedies if violations are found include forced unbundling of Copilot AI features from M365, mandatory Azure API interoperability, or limits on exclusive terms with OpenAI. A formal complaint has not been filed; current CID status implies a formal complaint is at minimum 6–12 months away, with any trial or remedies taking years beyond that. 18
2. EU DMA cloud investigation — gatekeeper designation risk
In November 2025, the European Commission launched three cloud market investigations: two assessing whether AWS and Azure should be designated as "gatekeepers" under the Digital Markets Act (DMA), and one examining whether the DMA adequately addresses anticompetitive cloud market behavior. The assessment deadline is November 2026. 19
If Azure receives gatekeeper designation, DMA violations carry fines of up to 10% of global annual revenue (theoretical maximum of ~$31.8B based on LTM revenue of $318.3B). But existing DMA remedies are primarily designed for B2C consumer markets; cloud-specific obligations are expected to require separate legislative action before 2028. The timeline for any financial impact is long. On June 3, 2026, the EU also proposed new regulations specifically aimed at reducing reliance on U.S. technology companies in European public sector cloud contracts — an additional headwind for Azure's European public sector pipeline. 19
3. AI capital expenditure return risk
FY2026 CapEx is guided at over $94B (excluding operating leases), versus $64.6B in FY2025 — a projected 45%+ year-over-year increase. Including leases, the figure runs closer to $140B. 20 A Cantor Fitzgerald analyst described the spending trajectory as reflecting "strong demand on the positive side, but remains a concern as there appears no end in sight." 20
The countervailing evidence: Microsoft's AI annual revenue run rate hit $37B in Q3 FY2026 (+123% year-over-year), and CEO Satya Nadella stated: "Our AI business surpassed an annual revenue run rate of $37 billion, up 123% year-over-year." 2 The M365 Copilot AI add-on had 15 million paid commercial seats as of Q2 FY2026 — just 3.33% of the 450M+ total commercial seat base, with each Copilot seat priced at $30/month. 21 The implied penetration upside is large, but Directions on Microsoft analyst Greg DeMichillie noted: "My conclusion is that Office isn't much of an advantage, at least in terms of getting people to shell out money for AI." 21 Copilot monetization at scale has not been demonstrated.
4. Cybersecurity liability and reputational risk
Microsoft's infrastructure has been implicated in several high-profile breaches. In 2023, Chinese intelligence exploited a vulnerability in Microsoft's Exchange Online service to access email accounts at the U.S. State and Commerce Departments. In 2024, Russian intelligence used a Microsoft system to infiltrate federal agency email. The Cyber Safety Review Board concluded: "Microsoft's security culture was inadequate and requires an overhaul." 18 These incidents create ongoing legal exposure and could complicate federal contracts worth billions of dollars, though no material financial impact has been publicly quantified to date.
5. Insider ownership and short interest
Insider direct ownership stands at approximately 1.53% of shares outstanding per Finviz (StockAnalysis reports 0.03%, reflecting a narrower definition of "insider"). 7 Over the past 12 months, the dominant pattern is high-level executive selling through 10b5-1 pre-scheduled plans — not discretionary. Judson Althoff (CEO of Microsoft Commercial) sold $7.1M worth of shares on June 1, 2026, and $6.3M in December 2025. Kathleen Hogan (EVP Strategy) sold $5.0M in March 2026. The sole open-market purchase: Director John Stanton bought $2.0M at an average price of $397.35 on February 18, 2026. 7
Short interest is 77.3M shares (1.06% of float, 2.23 days to cover) — declining from 79.1M shares the prior month. 1 Both figures indicate negligible short pressure.
Near-term catalysts
Next earnings date. Microsoft reported Q3 FY2026 results on April 29, 2026. CFO Amy Hood stated: "We delivered results that exceeded expectations across revenue, operating income, and earnings per share, reflecting strong execution and growing demand for the Microsoft Cloud." 2 Q4 FY2026 results (covering April–June 2026) have not been formally scheduled; based on prior-year timing, late July 2026 is expected (Q4 FY2025 was July 30, 2025). Management guided Q4 revenue at $86.7B–$87.8B, implying continued high-teens year-over-year growth. 2
M365 price increases. Microsoft announced global M365 subscription price increases effective July 2026. Business Standard plans rise 12%; E3 enterprise plans rise 8.3%; E5 enterprise plans rise 6–8%; small business plans increase up to 16.7%. 2 At 450M+ commercial seats, each 1% in average revenue per user increase adds roughly $1.6B in annualized revenue. These price increases flow directly into the Productivity segment in Q1 FY2027 (starting July 2026).
Analyst consensus. 56 analysts cover Microsoft. Consensus rating is Strong Buy (Finviz score: 1.24 out of 5.0, where 1.0 = Strong Buy). Average 12-month price target: $560.89, implying approximately 27% upside from the June 2 close of $441.31. 17 The range spans $415 (Stifel, April 30) to $646 (Bernstein, April 30). Following the Q3 FY2026 earnings, Wells Fargo raised its target from $615 to $625, Citigroup raised from $600 to $620, while Truist cut from $675 to $575 and Evercore cut from $580 to $510. On June 1, 2026, Citizens initiated coverage at Market Outperform with a $550 target. Analyst price targets carry systematic optimism bias; treat directionally rather than literally.
Competitive moat
Microsoft's competitive position rests on three quantifiable advantages that compound over time.
Scale and margin leadership. At 46.8% operating margin in Q3 FY2026, Microsoft generates more operating profit per revenue dollar than any other mega-cap technology peer: Alphabet at 32.0%, Apple at 32.4%, Oracle at 31.9%, Amazon at 11.2%. 6 This margin advantage means Microsoft can invest in AI infrastructure at a rate that would impair free cash flow at most competitors while still growing earnings. A company earning 46 cents of operating profit per revenue dollar absorbs the same dollar of capital spending with far less strain than a company earning 11 cents.
Ecosystem lock-in at enterprise scale. The 450M+ Microsoft 365 commercial seats represent a distribution network that no competitor can replicate quickly. Satya Nadella (Chairman and CEO) has described the strategy as "AI co-pilot in everything" — embedding Copilot into every surface a 450M-user enterprise customer already uses daily. 2 The switching cost for an enterprise to replace Active Directory, Exchange, Teams, and Azure simultaneously is large enough that the median customer does not attempt it. GitHub Copilot, with approximately 4.7 million paid subscribers as of Q2 FY2026 (up 75% year-over-year) and 20 million total users, represents the most direct monetization of this lock-in in the developer tooling market. 21
Azure cloud position with improving share. Azure's 20% cloud infrastructure market share as of Q3 2025 represents a genuine gain — the platform held roughly 18% two years prior. AWS declined from 32% to 29% over the same period. Synergy Research Group's chief analyst John Dinsdale noted: "Amazon's market share has averaged just under 30% over the past four quarters, down from a little over 32% in 2021. Its share is showing gradual erosion as Microsoft and Google continue to close the gap." 4 The Azure revenue growth rate of 40% in Q3 FY2026 compares to AWS at approximately 19–20% and Google Cloud at approximately 34% — Azure is gaining share against the market leader and growing faster than the incumbent.
The counterweight to this moat argument is honest: moats do not guarantee returns at any price. The antitrust risk identified above directly targets the bundling and licensing practices that make the M365 + Azure + Copilot ecosystem so sticky. If enforcement forces Microsoft to open its ecosystem to competing products on equal terms, some portion of the switching-cost moat is regulatory-compelled away.
Bull vs. bear thesis
The bull case has three concrete anchors.
The discount to Microsoft's own history is real and measurable. At 26.28x trailing P/E, the stock is 22.6% below its own 5-year average at a time when the underlying business is stronger — operating margins at record highs, net income at record highs, and Azure at its fastest growth rate in years. Paying below-average multiples for above-average business performance is a tractable valuation argument.
The AI revenue trajectory is not speculative. At $37B annualized and growing 123% year-over-year, Microsoft's AI business already exceeds the total revenue of most S&P 500 companies. 2 The 3.33% M365 Copilot penetration rate, if it converges toward even 15–20% over 3–5 years, adds $20–35B in annual incremental revenue from that product line alone. M365 price increases starting July 2026 provide a near-term revenue step-up that requires no additional customers.
The balance sheet is immovable. With 80.3x interest coverage, an AAA/Aaa credit rating across all three major agencies, and $40.4B in long-term debt against $343.5B in equity, Microsoft has the financial capacity to absorb almost any near-term scenario — regulatory fine, a CapEx cycle longer than expected, or a cyclical revenue slowdown — without financial distress.
The bear case centers on two risks that are neither remote nor fully priced.
The FTC investigation and EU DMA process are not tail risks — they are active proceedings with bipartisan support in the U.S. and clear political backing in Europe. The historical precedent (1998 DOJ Microsoft case) produced 12 years of behavior constraints and created measurable competitive opportunities for rivals during the consent decree period. If a similar outcome materializes, the most profitable pieces of Microsoft's current strategy (AI bundling, cloud licensing lock-in) are exactly what enforcement targets. There is no publicly available probability estimate for these outcomes; calling them definitively manageable or definitively severe would exceed the evidence.
The forward P/E of 23.87x is not cheap relative to the broader market. The S&P 500 trades near 20x forward earnings; Microsoft commands an 19% premium. That premium is justified if EPS grows at the consensus-implied ~19% annually for several years. If growth decelerates toward 8–10% — due to CapEx headwinds, regulatory disruption, or competition from Google and AWS in AI infrastructure — the appropriate forward multiple shrinks toward 18–20x, implying 8–16% downside from current levels on the multiple alone before factoring in any earnings revision.
The specific variable to watch at the July 2026 Q4 earnings report: whether Azure growth sustains at or above 38%, and whether FY2027 CapEx guidance signals a plateau or another increase. A plateau signal would likely re-rate the P/FCF multiple sharply downward toward the peer median.
All financial data sourced from SEC EDGAR XBRL filings (CIK 0000789019), StockAnalysis, Finviz, and the additional sources cited above. Price data represents the June 2, 2026 close. This article is for informational and research purposes only and does not constitute investment advice or a recommendation to buy or sell any security. All data should be independently verified before making any investment decision.
References
- 1StockAnalysis — Microsoft (MSFT) Statistics
stockanalysis.com
- 2Microsoft — Q3 FY2026 Earnings Release
news.microsoft.com
- 3
- 4Synergy Research Group — Cloud Market Share Trends, Q3 2025
srgresearch.com
- 5Statcounter — Desktop OS Market Share Worldwide, May 2026
gs.statcounter.com
- 6
- 7Finviz — Microsoft Corp. (MSFT) Quote
finviz.com
- 8StockAnalysis — Microsoft (MSFT) Financial Ratios
stockanalysis.com
- 9StockAnalysis — Alphabet (GOOGL) Statistics
stockanalysis.com
- 10StockAnalysis — Apple (AAPL) Statistics
stockanalysis.com
- 11StockAnalysis — Amazon (AMZN) Statistics
stockanalysis.com
- 12StockAnalysis — Meta Platforms (META) Statistics
stockanalysis.com
- 13StockAnalysis — Oracle (ORCL) Statistics
stockanalysis.com
- 14StockAnalysis — Adobe (ADBE) Statistics
stockanalysis.com
- 15StockAnalysis — Salesforce (CRM) Statistics
stockanalysis.com
- 16
- 17
- 18
- 19
- 20
- 21Directions on Microsoft — Microsoft Claims 15 Million Paid M365 Copilot Seats
directionsonmicrosoft.com
This story was produced automatically by a channel. One sentence is all it takes for Neodrop to keep producing for you.