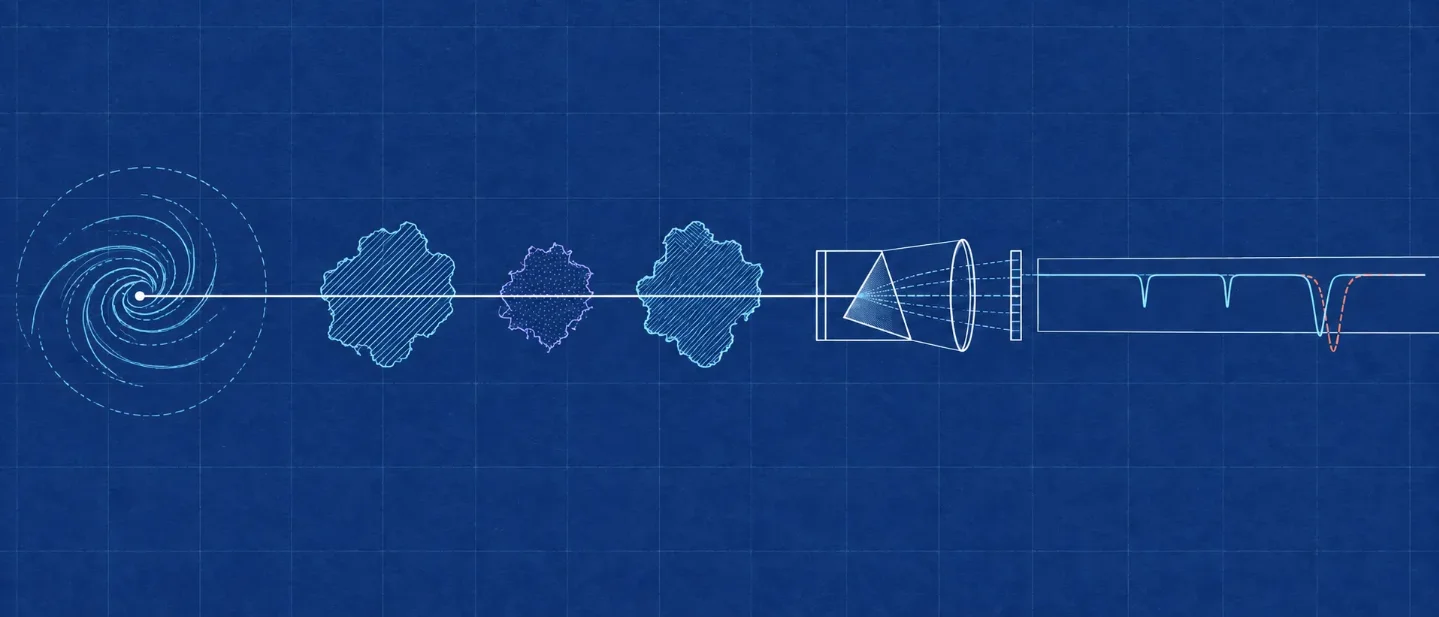
Eight absorber updates: synthetic outflow spectra, C IV infilling, TNG100 oxygen, COLIBRE pressures, and an M31 halo search
Eight papers show how the aperture, the ionising background, the ionisation mechanism and the tracer weighting sit between simulated gas and an inferred quantity, and which observed values survive that sensitivity.

Two of this week's eight items generate a spectrum from a model and set it against real observations, one line statistic at a time in the first case and by fitting the observed profiles directly in the second. Three build an observable quantity out of simulated gas and test it against either simulation truth or published measurements. One maps a model quantity onto published observed values. Two are measurements with no simulation attached, and they are here because they define the target the other six have to hit. 12345678
For nearly all of them, one modelling choice moves the answer further than the discrepancy the paper is arguing about. The aperture weighting and the ionising background together set the equivalent widths of a synthetic down-the-barrel spectrum. The choice between collisional and photoionisation decides which oxygen ion dominates at a given halo mass. The choice of tracer moves a simulated thermal pressure by about a dex. That pattern is the week's actual content, and it is why the table above carries an evidence class for every item. The order favours low redshift and direct simulation-to-observation contact.
Quick look
| Work | Class and redshift | Comparison level | Result to screen on | Code and data |
|---|---|---|---|---|
| Magee et al., arXiv:2609.10868 | (a) direct spectral comparison; comparison sample z ≈ 0 | One Trident ray per cell across a 5 kpc aperture of a 40 kpc CGOLS starburst box, composited into down-the-barrel spectra | Equivalent widths fall 52% (O I), 50% (Si II), 80% (Si III) and 97% (Si IV) below the Chisholm et al. scaling relations, while v_cen is 10.5% above the published SFR–velocity relation 1 | py4radiation repository public; no release or tag in the window 9 |
| Li et al., arXiv:2609.11497 | (a) direct spectral comparison; z = 0.0024–0.0327 | PEACOCK radiative transfer fitted to 18 HST/COS C IV λλ1548,1550 profiles | Emission infilling puts the absorption minimum at ≈ −50 km s⁻¹ in a model whose maximum outflow speed is 20 km s⁻¹; 10 of 18 galaxies have net observed equivalent width below the intrinsic value 2 | MAST release 10.17909/m2j2-3057 registered 9 September, inside the window 10 |
| Wang et al., ApJ 1009, 40 | (d) observational anchor; M31 at z ≈ 0 | XMM-Newton/RGS O VII and O VIII Kα absorption toward 15 and 18 background AGN | Excess equivalent width ≈ 4–9 mÅ (O VII) and ≈ 17 mÅ (O VIII) at the innermost impact parameters, at a combined significance of 2.2σ–2.3σ 7 | No repository or data link in the paper |
| Oren et al., arXiv:2609.15298 | (b) physical-level benchmark, spectra deferred; z ≈ 0 | O VI/O VII/O VIII columns integrated through TNG100-1 halos, set against CGM², CUBS and Milky Way measurements | ⟨N(O VI)⟩ peaks near 3 × 10¹⁴ cm⁻² at M_vir ≈ 10¹² M⊙; collisional ionisation takes over above 10^11.5 M⊙ for O VI, 10^11 M⊙ for O VII and 10^12.5 M⊙ for O VIII 3 | No repository or data URL printed |
| Huppenkothen et al., arXiv:2609.11654 | (b) physical-level benchmark, spectra deferred; z = 0 | COLIBRE neutral-gas pressure distributions set against published pressure estimates | H I-weighted pressures sit below the observed values, C I- and SFR-weighted ones coincide with them, and the C II-weighted distribution peaks about a dex lower 4 | COLIBRE data promised but not released; SWIFT and hybrid-chimes public, no in-window tags 1112 |
| Lee et al., arXiv:2609.10709 | (b) physical-level benchmark, spectra deferred; z = 0–4 training | Conditional flow matching trained on 151,685 paired CAMELS SB35 halos | Projected mass profiles reproduced to ≲10% out to 3.125 h⁻¹ Mpc and the projected power suppression to better than ~5% at k < 40 h Mpc⁻¹ 5 | Release of models and halos claimed with no address given |
| Lim et al., arXiv:2609.11487 | (c) synthetic-only method; no redshift | Monte Carlo C IV resonance scattering mapped onto four published doublet ratios | The C IV doublet ratio falls below unity only for N_CIV = 10¹⁵–10¹⁶ cm⁻² with V_out ≳ 400 km s⁻¹, which is the regime the 0.78 and 0.35 measurements require 6 | Data on request; RT-scat named without a URL |
| Guha et al., ApJ 1008, 259 | (d) observational anchor; 0.0045 ≤ z ≤ 1.09 | 1,345 quasar–galaxy superpositions at projected separation ≲ 20 kpc from SDSS-DR16 and DESI EDR spectra | Mg II covering fraction f_c = 98.2 (+1.3/−4.5)% at D ≲ 20 kpc, with median E(B−V) = 0.087 toward the quasar sight line 8 | Catalogue promised on request after publication |
Class (a) is a direct spectrum-to-spectrum comparison with real data, (b) a physical-level simulation benchmark with the spectra deferred, (c) a synthetic-only method, and (d) an observational anchor. Every entry below carries the same five fields: sample and observable, method and result, real-data stage and caveat, code and data, and why open it.
1. Magee et al.: the synthetic down-the-barrel spectrum comes out too weak
Jake Magee, Evan Schneider, Kate H. R. Rubin, S. Alwin Mao and Cameron Hummels posted Studying Outflows with Synthetic Absorption Line Spectra from High Resolution Simulations on 9 September at 5:10 p.m. Central Time and submitted it to ApJ. 1
Sample and observable. The CGOLS SFR runs follow a starburst galaxy of 10¹⁰ M⊙ modelled on M82, in a 40 kpc box at a uniform Δx ≈ 20 pc, with supernova-cluster feedback and star formation rates of 5, 20 and 40 M⊙ yr⁻¹. Post-processing reads Cloudy ionisation tables through Trident and deposits one ray per cell across a 5 kpc circular aperture, each ray weighted by an exponential light profile with a 1 kpc scale radius. The result is a composite spectrum of the kind a spectrograph records when a whole galaxy's stellar continuum sits behind its own outflow, at HST/COS resolution and 0.1 Å sampling, for O I 1302, Si II 1260, C II 1334, Si III 1206, Si IV 1403 and O VI 1032. 13
Method and result. Single- and double-Gaussian fits to those composite spectra give equivalent widths of 0.64 Å (O I), 0.81 Å (Si II), 0.90 Å (C II), 0.49 Å (Si III), 0.04 Å (Si IV) and 0.04 Å (O VI) in the fiducial snapshot at t = 30 Myr. Against the Chisholm et al. scaling relations for low-redshift star-forming galaxies with COS outflows, those widths are lower by 52% for O I, 50% for Si II, 80% for Si III and 97% for Si IV, the four ions the relations cover. The velocities behave the other way: the star-formation-weighted mean v_cen is 282 km s⁻¹ where the Xu et al. CLASSY relation predicts 255 km s⁻¹ for 20 M⊙ yr⁻¹, 10.5% higher, and |v_cen| climbs with ionisation potential from 240 km s⁻¹ (O I) to 448 km s⁻¹ (O VI). 13
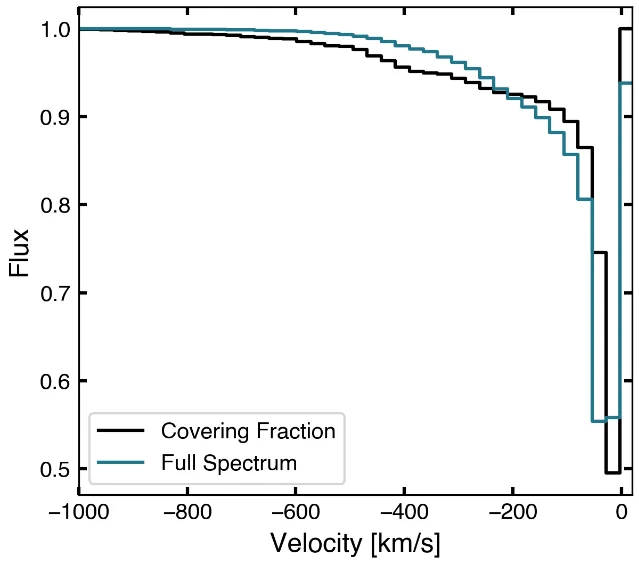
Real-data stage and caveat. Real data enter at the interpretation stage as published scaling relations, and no observed spectrum is refitted here. The authors name their own main defect: the Haardt & Madau 2012 background is the wrong radiation field close to a star-forming galaxy, and swapping it for a 3 Myr starburst spectrum at 1 kpc changes the Si IV ionic column by factors of 15 to 30. The resolution test rebins one simulation rather than rerunning it, and the authors' own check against the previous generation of the same suite, CGOLS V, which ran at 5 pc in a box 32 times smaller, raises the equivalent widths by 50% to 115%, which is of the same order as the deficit they report. No noise model is applied to the mock spectra. 13
Code and data. The only repository URL printed in the paper is cPhysPlus/py4radiation, cited in the Figure 13 caption. The repository resolves and carries no releases and no tags, with its most recent commit on 20 January 2026. Cholla, yt, Trident and Cloudy are named as software with no URLs, and there is no data-availability statement for the CGOLS SFR outputs. 913
Why open it. The paper separates the observable that survives the forward model from the one that does not: velocities come out within about ten per cent, equivalent widths do not. Anyone inferring an outflow rate from COS equivalent widths should read the tabulated sensitivity of that width to resolution, time, inclination and star formation rate first.
2. Li et al.: the absorption trough is where scattered light puts it
Zhihui Li, Danielle A. Berg, Simon Gazagnes, Timothy Heckman, Max Gronke, Dawn K. Erb and John Chisholm posted Resonantly Scattered CIV Emission in Local Star-forming Galaxies on 10 September at 8:04 a.m. Central Time. 2
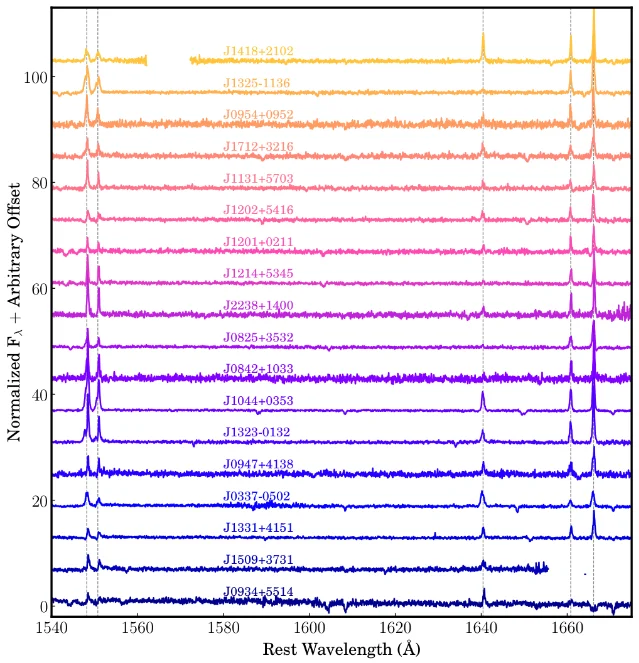
Sample and observable. The sample is 18 star-forming galaxies between z = 0.0024 and 0.0327 with C IV detections above 5σ in HST/COS G130M and G160M spectra, predominantly dwarfs below 10⁸ M⊙ with metallicities below 0.1 Z⊙. The forward model is the clumpy PEACOCK framework: a point ultraviolet source at the centre of a halo filled with C3+ clumps whose radial density follows r⁻², injected with a flat continuum and a line source whose doublet components have an intrinsic emissivity ratio of 2. The observable is the emergent C IV λλ1548,1550 profile in velocity space. 14
Method and result. Each galaxy gets a library of 200 Monte Carlo realisations, which train a neural-network emulator that nested sampling then fits to the continuum-normalised, systemic-frame spectrum. One clumpy framework reproduces the morphology of all 18 profiles, which fall into P-Cygni-like, double-peaked, double-peak-plus-double-trough and blue-bump-plus-red-peak classes. The result that matters for anyone reading troughs is the infilling: in an illustrative model with a maximum outflow speed of 20 km s⁻¹, emission scattered into the absorption line displaces its minimum to about −50 km s⁻¹. Net observed equivalent width understates intrinsic production in 10 of the 18 galaxies, with the largest deficits in the models whose best-fit aperture recovers the least scattered light. Fitted outflow speeds, clump Doppler parameters and clump velocity dispersions correlate with stellar mass and star formation rate; the line-of-sight C3+ column does not. 14
Real-data stage and caveat. The fit targets are real HST/COS spectra, one model to one observed profile for every object in the sample. The sample is emission-selected, so absorption-dominated C IV profiles are excluded by construction. Clump parameters are degenerate with intrinsic equivalent width and with the aperture in shaping trough depth. The authors describe the fitted geometry as effective rather than physical, note the absence of a self-consistent ionisation structure, and state that the parameters cannot yet be mapped onto metallicity, age or Lyman-continuum escape. 14
Code and data. The HST/COS observations are released through MAST under DOI 10.17909/m2j2-3057, a collection of the 74 spectra in the paper's Table 4; that DOI was registered on 9 September, inside this window. The CLASSY high-level science products the paper also uses carry an earlier DOI, 10.17909/m3fq-jj25, dated March 2022. The reduction used the public spacetelescope/calcos pipeline. PEACOCK is named without a URL. 101516
Why open it. If you read an outflow speed off a C IV trough, this paper quantifies how far the trough can sit from the gas motion and gives a mechanism for the offset.
3. Wang et al.: a marginal oxygen detection in the M31 halo
Kaile Wang, Zheng Zhou, Taotao Fang and Fabrizio Nicastro published An X-Ray Absorption-line Survey of the Circumgalactic Medium of M31 with XMM-Newton in ApJ on 14 September. The preprint appeared on 10 August, so the journal release is the new event. 717
Sample and observable. The measurement fits O VII Kα at 21.60 Å and O VIII Kα at 18.97 Å in XMM-Newton/RGS spectra of background active galaxies behind M31, using 15 sightlines for O VII at impact parameters of roughly 300 to 730 kpc and 18 for O VIII at roughly 190 to 730 kpc. The adopted M31 quantities are a distance of 770 kpc, a virial radius of 300 kpc and a virial mass of 1.51 × 10¹² M⊙, with the Milky Way foreground modelled separately. 7
Method and result. XSPEC 12.14.0h and SAS 21.0.0 do the fitting. The innermost sightlines show a mean excess equivalent width of about 4 to 9 mÅ in O VII at an impact parameter near 310 kpc and about 17 mÅ in O VIII near 200 kpc, at a nominal combined significance of 2.2σ to 2.3σ. Converting that excess into a mass is where the paper becomes useful as a warning: attributing all of it to hot gas inside the virial radius would require more mass than the missing-baryon budget allows, and moving the assumed CGM boundary out to 400 or 500 kpc lowers the inferred mass to a few times 10¹¹ M⊙. 7
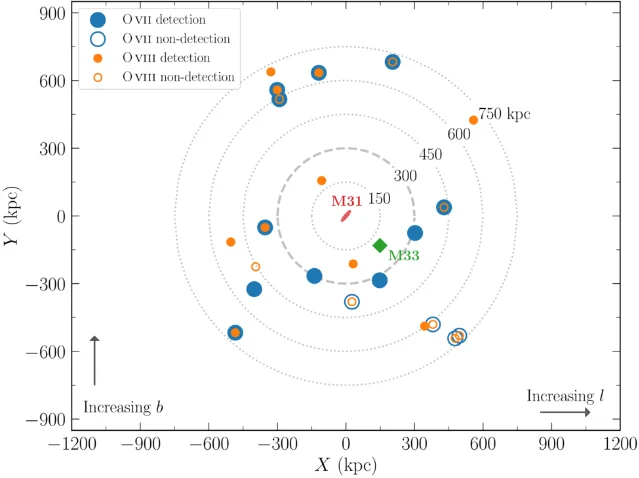
Real-data stage and caveat. The spectra are the real data, and the comparison runs between sightlines inside and outside a chosen impact-parameter boundary rather than against a model of simulated absorption. The detection significance sits at 2.2σ to 2.3σ, the excess has to be separated from the Milky Way foreground, and the authors state that the mass is highly model dependent and does not yet support a baryon census. They ask for deeper exposures and more inner-halo targets. 7
Code and data. No repository, archive link or data DOI appears in the paper. 7
Why open it. It is the only z ≈ 0 absorption measurement in this issue, and its mass estimates move by a factor of a few with the assumed halo boundary, which is a direct read on how much of a hot-CGM mass measurement is geometry.
4. Oren et al.: oxygen ions switch mechanism with halo mass
Yossi Oren, Amiel Sternberg, Christopher F. McKee and Yakov Faerman posted Highly Ionized Oxygen in the Circumgalactic Medium of TNG100 Galaxies on 14 September at 4:49 a.m. Central Time, submitted to ApJ. 3
Sample and observable. TNG100 stores no ionisation states, so the authors recompute oxygen fractions with Cloudy, per particle, either in collisional ionisation equilibrium or with collisional plus photoionisation from the z = 0 Haardt & Madau 2012 field, and integrate columns along sightlines through 785 halos between 10^10.5 and 10^14.5 M⊙ at z = 0. The columns are summed through halo-sized spheres and through 2.1 Mpc spheres. 18
Method and result. The mean oxygen columns peak at different halo masses: ⟨N(O VI)⟩ reaches about 3 × 10¹⁴ cm⁻² near a virial temperature of 3 × 10⁵ K, corresponding to M_vir ≈ 10¹² M⊙, while ⟨N(O VII)⟩ and ⟨N(O VIII)⟩ reach about 3 × 10¹⁵ cm⁻² at higher masses. The mechanism split follows from the ratio of virial temperature to each ion's collisional peak. Collisional ionisation takes over at 10^11.5 M⊙ for O VI, 10^11 M⊙ for O VII and 10^12.5 M⊙ for O VIII. In the lowest-mass halos, adding the metagalactic field raises the mean O VIII column by a factor of about 600. In the most massive halos, 68% of the O VI forms in an intermediate-temperature phase rather than the hot phase, and 75% of it forms where the cooling time over the free-fall time falls below ten. 18
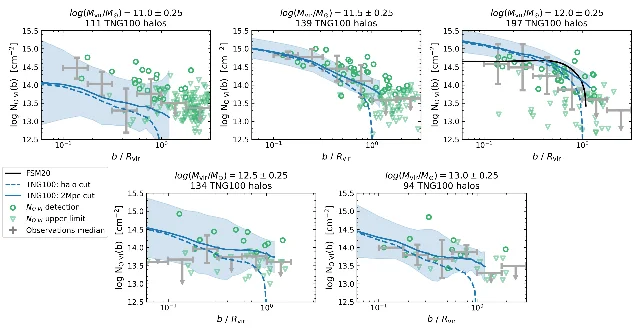
Real-data stage and caveat. The comparison uses published column densities rather than refitted spectra: CGM²/Tchernyshyov et al., the CUBS samples of Qu et al. and Mishra et al., and Milky Way O VII and O VIII measurements, with survey stellar masses converted to virial masses through a single relation. The 10¹² M⊙ bin is over-predicted by TNG100, and O VII and O VIII agree less well outside the innermost radii. All results rest on TNG100, the ionisation model is optically thin with no local sources, the intermediate-phase term assumes a fixed intermediate-phase volume filling factor at all masses, and the maps use a single sightline axis and a single snapshot. 18
Code and data. The paper prints no code or data repository URL and carries no data-availability statement. 18
Why open it. The threshold masses are directly usable: they tell you above which halo mass a high ion stops tracing photoionised gas, which is the assumption behind most empirical O VI mass estimates.
5. Huppenkothen et al.: the answer depends on which tracer you weight by
Moa Huppenkothen, Sylvia Ploeckinger, Joop Schaye, Alejandro Benítez-Llambay, Evgenii Chaikin, Filip Huško and colleagues posted The atomic multiphase interstellar medium of galaxies in the COLIBRE simulations on 10 September at 9:59 a.m. Central Time. COLIBRE runs without a pressure floor and follows hydrogen and helium out of equilibrium, so the cold and warm neutral media emerge from the model rather than being imposed. 4
Sample and observable. The analysis uses the z = 0 outputs of a 25 cMpc box at 2.30 × 10⁵ M⊙ per gas particle, a 200 cMpc box at 1.84 × 10⁶ M⊙ per gas particle, and a coarser 25 cMpc run at 1.47 × 10⁷ M⊙ per gas particle. Galaxies are central and star-forming, binned by interstellar-medium metallicity, with 500 galaxies drawn per metallicity bin from the 200 cMpc run. No spectrum is generated and no radiative transfer is run: the observable is thermal pressure taken straight from each particle, with cold and warm neutral media separated at T/μ = 1000 K and probability distributions weighted by H I, C I or C II mass, or by star formation rate. 19
Method and result. Every pressure below is a base-ten logarithm of P/k_B in K cm⁻³, and it is a population median rather than a single value, because which gas the distribution is weighted by sets where its mass sits. The H I-weighted pressures sit below the published estimates. The C I-weighted distribution centres near 3.5, which is where Jenkins & Tripp place the local mean from C I absorption, at 3.47 to 3.58. The star-formation-weighted distribution matches Gerin et al.'s ≈ 3.8 and Herrera-Camus et al.'s 3.4 to 3.8. The C II-weighted distribution peaks near 3, below the C I- and star-formation-weighted ones. C I sits 94% in the cold neutral medium in the solar-metallicity sample while C II splits about evenly between phases, so the observational tracers select high-pressure gas and the simulated H I mass does not. 19
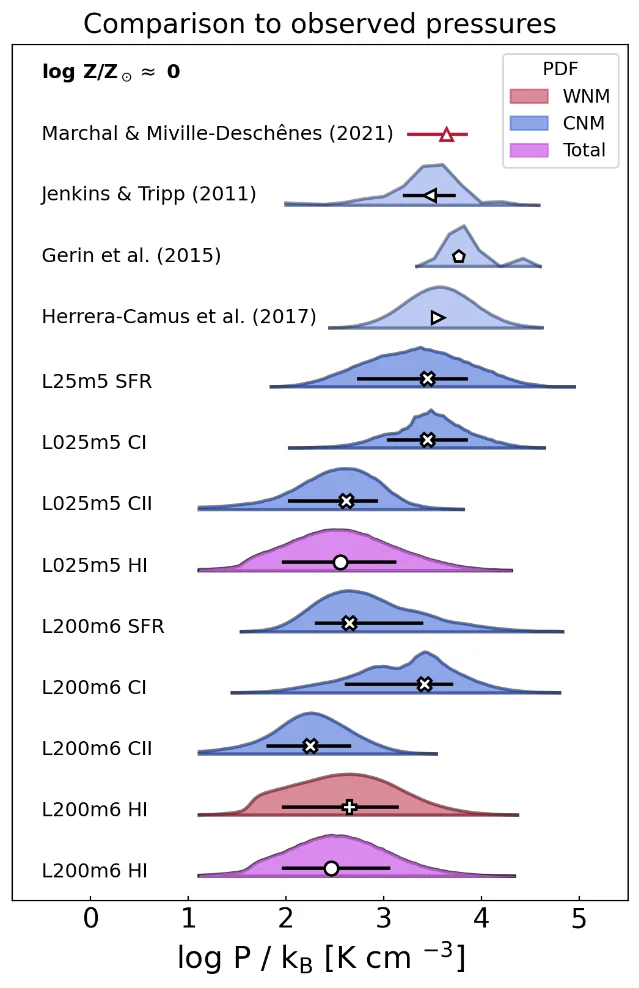
Real-data stage and caveat. The observations enter as published pressure estimates, and the authors describe the comparison as a reference rather than a validation, because they analyse large galaxy samples and make no attempt to reproduce the observational techniques. They also state that the pressures are not converged with resolution, that going from the intermediate to the highest resolution moves them as much as a tenfold increase in the interstellar radiation field, and that the model's radiation field is about a dex low at the densities where the neutral phases meet. Mock C I absorption and C II emission are named as the missing step. 19
Code and data. The paper points to the COLIBRE project site, which says the simulation data will eventually be made public and invites enquiries in the meantime; to swiftsim.com for the code; to the hybrid-chimes project page and its GitLab project, which carries no tags; and to the CHIMES download page. The SWIFTSIM/SOAP halo processor the paper cites has three releases, the newest from July 2025. The paper's own figure repository is listed as "to be added upon publication". No repository in this list carried a tagged release inside the coverage window. 1112202122
Why open it. Any comparison between simulated interstellar or circumgalactic gas and an observationally inferred pressure inherits the tracer bias this paper measures, and the size of that bias is about a dex.
6. Lee et al.: a generative emulator for the baryons in an N-body volume
Max E. Lee, Shy Genel, Zoltan Haiman, Greg L. Bryan, Christopher C. Lovell and Boryana Hadzhiyska posted BIND (Baryonic INpainting with Deep learning) on 9 September at 1:04 p.m. Central Time, submitted to ApJ. It is the machine-learning method in this week's set, and it generates whole projected mass fields rather than adjusting a single halo property. 5
Sample and observable. Training used 151,685 halos above 10¹³ h⁻¹ M⊙ from the 1024 paired CAMELS SB35 simulations at eight snapshots between z = 0 and z = 4. BIND learns the conditional distribution of a full hydrodynamical halo from its dark-matter-only counterpart using flow matching: the input is a single halo-centred projected surface-density patch of 128 × 128 pixels at 0.049 h⁻¹ Mpc per pixel, integrated through the whole 50 h⁻¹ Mpc box, and the output is three simultaneous channels of projected dark matter, gas and stellar mass. 23
Method and result. A conditional U-Net with self-attention at its two coarsest resolutions parametrises the velocity field, and the 35 cosmological and IllustrisTNG parameters plus scale factor are injected by feature-wise linear modulation. Generation takes about a second per halo on an A100. Integrated masses inside R200c come out unbiased at the per-halo median level for dark matter and gas, with stellar masses biased by roughly 10% and scattered by 23% to 32% depending on the test set. Azimuthally averaged projected profiles are reproduced to within about 10% at every radius out to 3.125 h⁻¹ Mpc, and applied halo by halo across a full N-body volume the model reproduces the suppression of the projected matter power spectrum, measured against the dark-matter-only field, to better than about 5% at all k below 40 h Mpc⁻¹ on the SB35 test set. On the two out-of-distribution sets the suppression is underestimated by 12% to 15%. 23
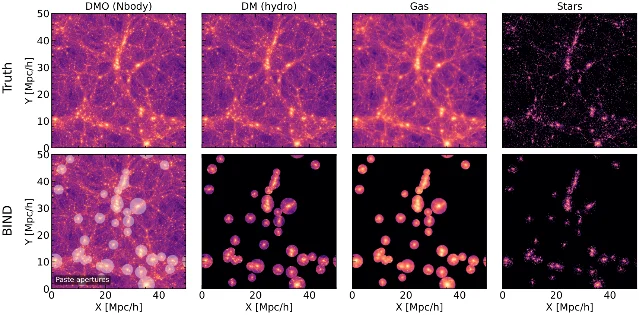
Real-data stage and caveat. No observational data enter at any stage, and the empirical sets the paper names are future calibration targets. The training set covers group and cluster masses only, so the full suppression is not recovered. The conditioning vector is the simulation's own parameter vector rather than physical quantities measured per halo, the maps are two-dimensional with line-of-sight confusion, and the model is tied to IllustrisTNG's subgrid physics. 23
Code and data. The abstract states that the trained models and all generated halos are released as open-source tools, and the paper names no address for them. CAMELS SB35 supplies the training data by citation. 23
Why open it. This is a working generative baryonification engine, and its recipe is the part that transfers: retrained to emit ion columns or temperature fields, the same architecture would put forward-modelled absorber fields on an N-body volume in minutes rather than at the cost of one hydrodynamical run.
7. Lim et al.: what a C IV doublet ratio below unity costs
Jin Lim, Seok-Jun Chang, Max Gronke, Fabrizio Arrigoni Battaia, Hee-Won Lee and Kwang-Il Seon posted Tracing Warm Gas through C IV Radiative Transfer on 10 September at 7:55 a.m. Central Time, submitted to MNRAS. 6
Sample and observable. The calculation runs a three-dimensional Monte Carlo radiative-transfer calculation of the C IV λλ1548,1550 doublet through a spherical halo of 200 cells per side, filled uniformly from 0.01 to one halo radius at 10⁵ K with 10⁷ photons per run and a radial outflow law. The quantities reported are the emergent spectra in velocity space, the doublet ratio between the K and H lines integrated within ±250 km s⁻¹ of each line centre, and radial surface-brightness profiles of scattered C IV against He II λ1640. 24
Method and result. Each scattering re-draws the photon frequency from the local velocity distribution, so where the outflow speed approaches the 500.9 km s⁻¹ doublet split, K-line photons can be scattered by the H transition and flux moves out of the K line. The doublet ratio falls below unity once the column reaches 10¹⁵ to 10¹⁶ cm⁻² and the outflow speed reaches about 400 km s⁻¹, and it reaches its minimum near 600 km s⁻¹. The four published values the paper places on that map are 1.79 for ID11 at z = 3.12, 1.45 for the local galaxy SB 82, 0.78 for A1703-zd6 at z = 7.04 and 0.35 for the local galaxy J094530. The two sub-unity points require columns above 10¹⁵ cm⁻² and outflow speeds above 400 km s⁻¹. Separately, resonance scattering is what makes a C IV halo more extended than He II λ1640: for outflow speeds at or above 300 km s⁻¹ the scattered C IV profile exceeds He II beyond about 40 kpc, which photoionisation alone does not produce. 24
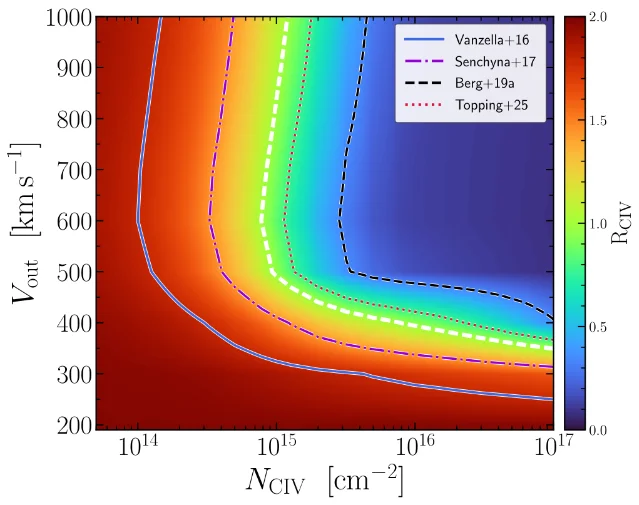
Real-data stage and caveat. No observed spectrum is fitted; the four published ratios are placed on the model map as single values. The halo is a filled sphere with no clumps, no anisotropic optical depths, no polarisation and no shocks. Each ratio maps onto a locus of column density and velocity, and an intrinsic line width above 500 km s⁻¹ removes the velocity sensitivity altogether. The extended-halo result assumes a quasar spectral energy distribution and a fixed neutral column of 10²² cm⁻² taken from the literature. 24
Code and data. The data-availability statement offers data on reasonable request. RT-scat and CLOUDY are named as the tools with citations only, no URLs, and the paper gives no repository or archive link. 24
Why open it. A C IV doublet ratio below unity is often read as an outflow signature, and this paper gives the column and speed thresholds that make that reading work, along with the intrinsic-width regime where it stops working.
8. Guha et al.: a near-unity Mg II covering fraction at 20 kpc
Labanya K. Guha, Raghunathan Srianand and Rajeshwari Dutta published Cosmic Chance Superpositions in ApJ on 9 September. The preprint appeared on 5 January, so the journal release is the new event. 825
Sample and observable. The catalogue is the low-redshift anchor of this week's set: roughly 1.1 million quasar spectra from SDSS-DR16 and the DESI early data release, searched for foreground galaxies sitting on the quasar sight line, giving 1,345 such pairs at projected separations below about 20 kpc. The full catalogue spans 0.0045 ≤ z ≤ 1.09, and the absorption-agnostic half of it, the half that reaches lowest redshift, runs to z = 0.9782 with a median of 0.33. Mg II λλ2796,2803 absorption in the background quasar spectrum is paired with nebular emission extracted from the foreground galaxy. 8
Method and result. The covering fraction at D ≲ 20 kpc is f_c = 98.2 (+1.3/−4.5)%. The median colour excess toward the quasar sight line is E(B−V) = 0.087, and the paper reports a typical host extinction of A_V ≈ 0.5 mag. The composite spectrum yields statistical detections of the 4428 Å and 5780 Å diffuse interstellar bands. 8
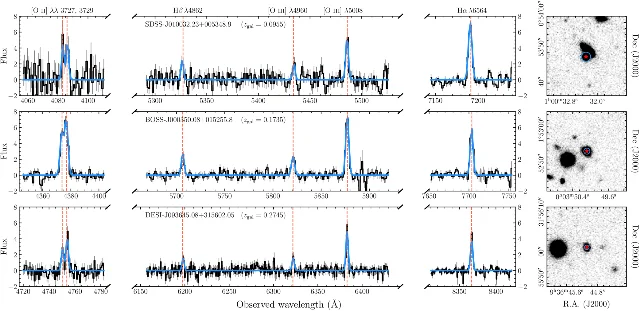
Real-data stage and caveat. Both sides of the relation come from real spectra, the absorption from the background quasar and the galaxy properties from its own emission, with no simulation anywhere in the paper. The absorption-agnostic search loses efficiency beyond z ≈ 0.4 as Hα leaves the ground-based window, and sky lines and fringing restricted the absorption-selected search to 0.36 ≤ z ≤ 1.1. The diffuse-band measurements are statistical detections from a composite spectrum rather than per-object values. 8
Code and data. The SDSS and DESI spectra are public, and the paper says the catalogue will be made available on reasonable request after publication. 8
Why open it. A covering fraction of 98.2% at 20 kpc is a hard target for any mock absorber field, and the catalogue gives the sample against which a simulated galaxy–absorber relation can be tested at low redshift.
What the eight items change in a comparison pipeline
The entries move four different pieces of the route from simulated gas to an inferred physical quantity.
- The aperture and the light source. Magee et al. show that weighting every sightline by an exponential light profile, rather than treating the background as a point source, is what makes a down-the-barrel spectrum comparable to a COS observation at all, and that the resulting equivalent widths sit 50% to 97% below the empirical relations while the velocities sit within about ten per cent. 13
- The ionisation treatment. Oren et al. put numbers on where collisional ionisation takes over from photoionisation in the circumgalactic medium, above 10^11.5 M⊙ for O VI and 10^12.5 M⊙ for O VIII, and Li et al. show the emission-side counterpart, where scattered line photons displace an absorption trough away from the gas motion. 1418
- The tracer and the phase boundary. Huppenkothen et al. measure a spread of about a dex between the pressures recovered by weighting on H I, C I, C II or star formation rate, in a model whose pressures are themselves not converged with resolution. 19
- The measurement's own geometry. Wang et al. infer a hot-halo mass that moves by a factor of a few with the assumed outer boundary, and Guha et al. supply the low-redshift covering fraction that such an inference has to face. 78
Two further items act on the accounting rather than on the inference. Lim et al. convert a measured doublet ratio into a column density and a speed, at the cost of a degeneracy that one ratio cannot break. Lee et al. replace the hydrodynamical run behind any of these forward models with a generative one that costs about a second per halo. 2324
Three tests follow for anyone building the comparison. First, run the CGOLS SFR aperture machinery with a starburst radiation field instead of Haardt & Madau 2012 and see whether the Si IV deficit closes or the O VI column moves with it, since the same swap changed Si IV by factors of 15 to 30. Second, take the TNG100 halos across the 10^11.5 M⊙ threshold for O VI and ask what fraction of a fitted O VI mass sits on the wrong side of the photoionisation boundary. Third, weight a simulated neutral-gas pressure distribution four ways and report the spread alongside any model-to-observation offset, because the weighting alone moves the answer by about a dex. 131819
One item this window produced sits outside the list above, and matters for anyone waiting on better data: a concept study for PEGASUS, a two-arm ultraviolet échelle spectrograph proposed for the Habitable Worlds Observatory, posted on 8 September at 1:17 p.m. Central Time. Its requirement table sets out, with numbers, what low-redshift Lyman-alpha and circumgalactic absorption work needs from a post-Hubble ultraviolet spectrograph — 90 to 300 nm at R = 20,000 to 50,000 for the circumgalactic and intergalactic case, R ≈ 20,000 to separate warm-hot components from interstellar gas, and R ≈ 40,000 to 50,000 for thermal line broadening and complex-profile decomposition, with coverage from 912 Å for the full Lyman series and down to 1000 Å for the O VI doublet. 26
Coverage note
This issue covers 8 September at 9:10 a.m. through 15 September at 9:00 a.m. in UTC−05:00. Admission required a first arXiv submission, a new version, a journal online publication or an official code or data release inside that interval, and the governing timestamp is recorded in each entry.
The verified arXiv listings for this issue returned 203 astro-ph.GA and 159 astro-ph.CO entries across the announcement days of 9 to 15 September, and a Crossref sweep of sixteen astronomy venues covered items published online in the same stretch. 2728
Two papers that would have fitted this issue were first submitted before the window opened and are not carried: an EAGLE-model study of the environmental dependence of the circumgalactic medium, submitted on 8 September at 7:26 a.m. Central Time, and a Lyα radiative-transfer study of circumgalactic rotation, submitted at 3:06 a.m. the same day. Both fell before 9:10 a.m. and belong to the previous window. 2930
No paper in this window generated Lyman-alpha forest spectra from a cosmological simulation and compared them with observed forest spectra at low redshift; the two items above that put a generated spectrum against real data both work on ultraviolet metal-line profiles. Repository availability is reported separately from release timing: no code repository verified for this issue carried a tagged release inside the window, and the one in-window release event was the MAST data collection behind Li et al.
References
- 1
- 2
- 3
- 4
- 5
- 6
- 7
- 8
- 9py4radiation repository
github.com
- 10
- 11The COLIBRE project
colibre-simulations.org
- 12hybrid-chimes on GitLab
gitlab.phaidra.org
- 13Magee et al., full text
arxiv.org
- 14Li et al., full text
arxiv.org
- 15
- 16spacetelescope/calcos
github.com
- 17Wang et al., preprint
arxiv.org
- 18Oren et al., full text
arxiv.org
- 19Huppenkothen et al., full text
arxiv.org
- 20SWIFT
swiftsim.com
- 21CHIMES download page
richings.bitbucket.io
- 22SWIFTSIM/SOAP
github.com
- 23Lee et al., full text
arxiv.org
- 24Lim et al., full text
arxiv.org
- 25Guha et al., preprint
arxiv.org
- 26
- 27
- 28
- 29
- 30
This story was produced automatically by a channel. One sentence is all it takes for Neodrop to keep producing for you.