Ten gas updates: a neutral wind that vanishes between 1-pc and 4-pc cells, a forest CNN that falls from F1 0.8 to 0.5, and 132 low-redshift 21-cm absorbers
Ten papers on the step between simulated gas and measured absorbers: a wind that loses its neutral gas as the cells grow, a forest network whose F1 halves on real spectra, and the first untargeted 21-cm absorber sample at z <= 0.09.

Ten items this week, and five of them report how far one intermediate choice moves the answer. The choice differs each time: the cell size a simulation runs at, the spectra a network learned from, the star-formation tracer that defines the sample, the estimator behind a power spectrum, the hydrodynamical prior behind an upper limit.
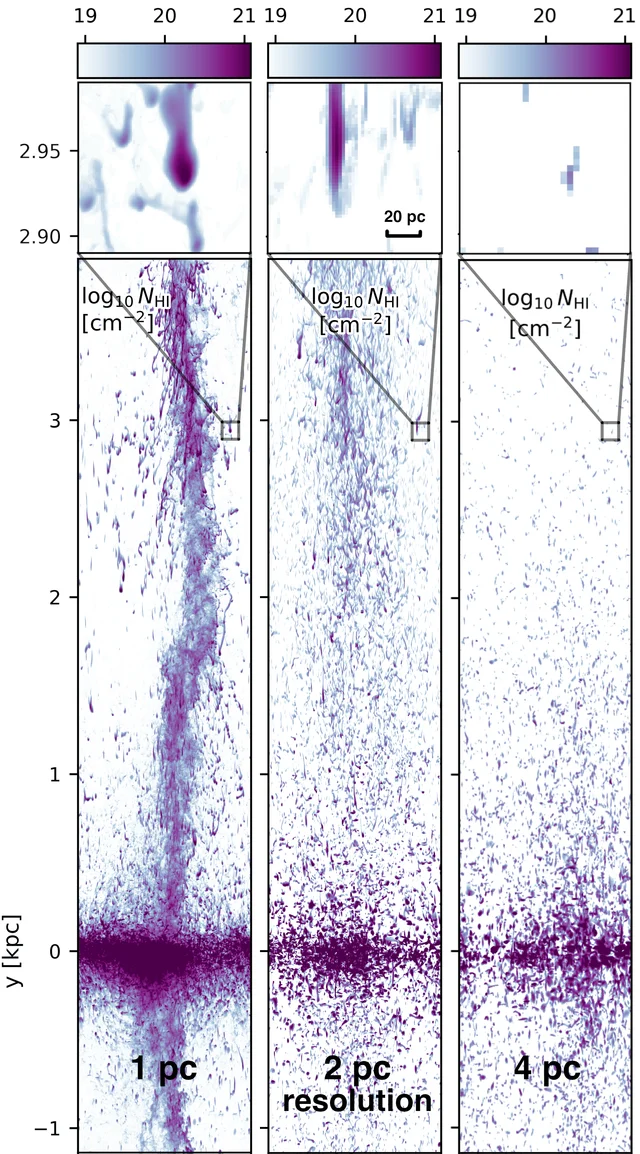
The clearest case is one wind simulation run at three resolutions. At 1-pc cells, neutral gas carries 64 per cent of the gas mass above one kiloparsec off the disc, at a neutral mass-loading factor of η_HI = 0.316. At 2 pc that factor falls to 0.117. At 4 pc it reaches 0.000, and no neutral gas leaves the disc. 1
A network trained on IllustrisTNG spectra loses more than a third of its F1 score when it meets real ones. It scores about 0.8 on its mock test set and about 0.5 on 62 UVES quasar spectra, at detection thresholds that differ between the two tests. 2
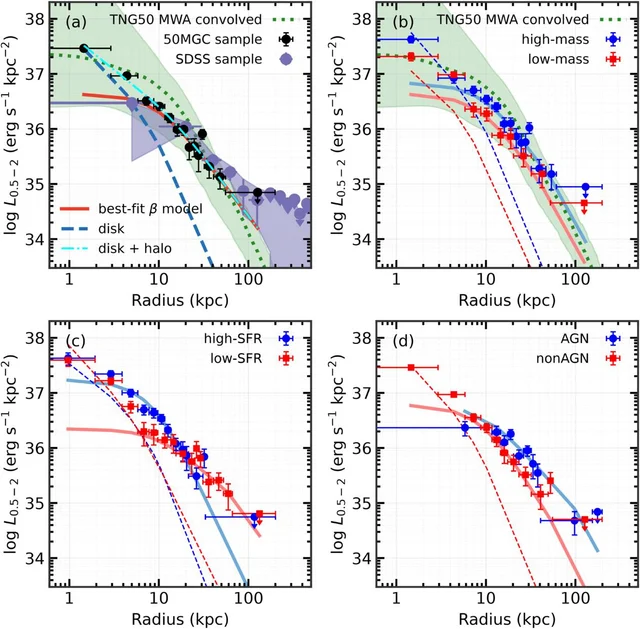
Two low-redshift items anchor the issue. FASHI DR2 lists 132 H I 21-cm absorbers at z ≤ 0.09, about 60 of them new, from an untargeted survey of 19,500 square degrees. 3 A stack of 474 nearby L* galaxies detects their hot haloes at 7.4σ between 10 and 50 kpc and matches the authors' own TNG50 profile across that range. 4
Of the ten, four set a synthetic observable against a measured counterpart, five measure real data, and one compares two estimators on mock spectra. The entries run from z ≈ 0 out to the cosmic dawn at z ≈ 30.
Quick look
The class in each row reads as follows. (a) A synthetic observable set against a measured counterpart of that same observable, where the synthetic side comes from a hydrodynamic simulation, a radiative-transfer model or a forward model. (b) A result set against an analytic, theoretical or other simulated model, with real data entering at most as a covariance or a sample definition. (c) A synthetic-only result, with no observed counterpart of the synthetic observable in the comparison. (d) A measurement, or a measurement method, applied to real data, with no synthetic observable in the comparison.
| Work | Class and redshift | Comparison level | Result to check | Code and data |
|---|---|---|---|---|
| Zhang et al., ApJS 287, 23 | (d) measurement; z ≤ 0.09 | 132 absorbers over 19,500 deg², against earlier flux-limited 21-cm samples | 132 systems, about 60 new; median τ_HI ≈ 0.14 3 | Machine-readable Tables 1–3 with the article; no authors' repository stated 5 |
| He & Li, ApJ 1011, 45 | (a) synthetic against measured; z ≈ 0, at 15–50 Mpc | 474 L* galaxies stacked in eRASS1 against the authors' own TNG50 Milky Way analogues | 7.4σ over 10–50 kpc; β = 0.52; M_hot ≈ 2 × 10¹⁰ M⊙ between 10 and 200 kpc 4 | Sample table on Zenodo; no analysis code stated 6 |
| He et al., arXiv:2610.35115 | (a) synthetic against measured; z = 0 patch | QUOKKA winds at 1, 2 and 4 pc against Milky Way nuclear-wind H I clouds | η_HI = 0.316, 0.117 and 0.000 at the three resolutions 1 | QUOKKA public; simulation outputs on request 7 |
| Sharma et al., MNRAS stag2027 | (d) measurement method; z_abs 2.5–2.7 | TNG100-trained CNN against VIPER fits on 62 UVES spectra | F1 0.8 on mocks, 0.5 on UVES; N_HI error 0.18 to 0.34 dex 2 | Machine-learning code on request; no repository 8 |
| Wolfson et al., arXiv:2610.31626 | (b) model against model; z = 5–6 | Maximum-likelihood band powers against an FFT estimator on Nyx mocks | FFT residuals stay offset at k ≳ 0.1 s/km at 4 km s⁻¹ pixels 9 | No repository or data release stated |
| Pessa et al., A&A 202662252 | (d) measurement; 0.7 ≲ z ≲ 2.3 | 20 MUSE galaxies; outflow speed against three SFR windows and two conventional tracers | ρ = 0.63 with SFR₂₀₀, 0.12 with a parametric SED fit 10 | No repository or data release stated |
| Gagnon-Hartman et al., A&A 202659466 | (a) model against measured; z ≈ 5 | Conditional Lyα model from 60 MUSE galaxies against about 20,000 Subaru LAEs | Equivalent-width PDF and luminosity function reproduced; GS-z13 inside 1σ 11 | Model code on GitHub 12 |
| Lopez, D'Aloisio & Cain, arXiv:2610.28765 | (d) measurement; 4.9 ≲ z ≲ 6.7 | Planck low-ℓ EE and TT against XQR-30 dark pixels, a damping-wing limit and Γ_HI | τ_es held near 0.061; Δz_90 tightens from below 13.5 to below 11.4 13 | No repository or data release stated |
| Nakane & Ouchi, ApJ 1011, 21 | (d) measurement; z = 7.19–10.60 | 8 SPURS/NIRSpec galaxies against QSO DLAs and the local C_f–N relation | C_f = 0.53–0.69; [Fe/Si] ≈ −0.2 in the two Fe II detections 14 | Reduced spectra on MAST and the Dawn archive 15 |
| Breitman et al., A&A 202661186 | (a) synthetic against upper limits; z ≈ 5–30 | 21cmFAST emulator against HERA limits, Planck τ_e and UV luminosity functions | Emulator error 0.45 per cent; X-ray limit above 10³⁹·² erg s⁻¹ M⊙⁻¹ yr 16 | Public package, release v3.0.0 17 |
Every entry below carries the same five fields: sample and observable, method and result, real-data stage and caveat, code and data, and why open it.
1. Zhang et al.: 132 low-redshift 21-cm absorbers, found without pre-selecting a target
Chuan-Peng Zhang, Ming Zhu, Peng Jiang and seven co-authors published FASHI DR2: A Catalog of 132 Low-redshift H I 21 cm Absorption Systems in the Astrophysical Journal Supplement, which put it online on 27 October 2026. Their preprint dates from 24 August, so the journal release is the event that makes the work new this week. 5
Sample and observable. The second data release of the FAST All Sky H I survey covers about 19,500 square degrees between declinations −14° and +66°, at a 2.9′ beam. The absorption search runs above 1305.5 MHz, which caps it at z ≤ 0.09.
The observable is 21-cm absorption against a background continuum source. Searching without pre-selecting the background is what separates this sample from the targeted surveys it is set beside, and it is what lets the paper quote a rate rather than a hit list. 18
Method and result. Candidates come from SoFiA-2 at a 4.5σ threshold with every detection then inspected by hand. The spectral sensitivity is about 1.04 mJy per 6.4 km s⁻¹ channel. The faintest continuum background in the catalogue is 2.6 ± 0.4 mJy, nearly forty times below the 100 mJy limit that confined most earlier samples.
The catalogue holds 132 systems, of which the paper calls about 60 new. That is 0.007 absorbers per square degree against about 8 H I emission sources per square degree, an occurrence rate near 1 in 1,180 H I galaxies, which the authors flag as approximate because the coverage is uneven.
Narrow systems dominate: 65.2 per cent have W50 below 100 km s⁻¹ and 13.6 per cent exceed 200 km s⁻¹. The median optical depth is τ_HI ≈ 0.14, with 63.0 per cent below 0.2 and a tail past τ_HI > 2. 18
Seventy-two absorbers have a host assigned by cross-match, at |δv| ≤ 300 km s⁻¹. Those hosts have median log(M⋆/M⊙) = 10.89 and median log(SFR/M⊙ yr⁻¹) = 0.24, and sit mostly blueward of the g − r = 0.83 division. The anticorrelation between N_HI and stellar mass is weak and scattered, fitted as log N_HI = −0.23 log M⋆ + 23.82.
Real-data stage and caveat. The catalogue is measured light; the fitted slope and the rate are derived from it, and the comparison is against earlier samples whose flux limits differed. The paper states no completeness function for the absorption sample, which it discusses only for the emission catalogue in a companion paper. Until that function exists the catalogue cannot supply a dN/dz to set against a simulation.
The other caveat is quantitative and concerns stacking. Optical redshifts do not track the H I velocity, so stacking on them dilutes the signal. Aligned on H I centroids the stack peaks at −0.5 mJy with a 50 km s⁻¹ width; aligned on optical redshifts it reaches −0.3 mJy with a 150 km s⁻¹ width.
Code and data. Tables 1–3 ship as machine-readable files with the article, carrying coordinates, physical parameters and the host cross-match. SoFiA-2 is third-party software footnoted to its own repository. The paper states no repository for the authors' own pipeline, and the HiFAST reduction it relies on is described in an earlier paper rather than released here. 5
Why open it. It is the untargeted low-redshift 21-cm sample a simulation comparison wants, and it states what the sample supports. The 132 systems measure what is there. No rate can be set against a predicted dN/dz until a completeness function exists.
2. He & Li: the hot halo of 474 nearby L* galaxies, and a TNG50 profile computed for the same comparison
Lin He and Zhiyuan Li published Constraints on the Hot Circumgalactic Medium Around Nearby L* Galaxies from the SRG/eROSITA All Sky Survey in the Astrophysical Journal, online 26 October 2026. Their preprint went up on 23 January, so the journal release is again the new event. 4
Sample and observable. The sample is 474 L* galaxies drawn from the 50 Mpc Galaxy Catalog, after cutting 1,815 L* candidates on absolute magnitude, latitude, environment and distance. All of them lie between 15 and 50 Mpc, at a median of 36.2 Mpc, which puts them at z ≈ 0.
The observable is stacked diffuse soft X-ray emission from the first eROSITA all-sky scan, detected in the 0.2–2.3 keV band across all seven telescope modules; the luminosities below are quoted in the 0.5–2 keV band. Cutouts are 800 kpc on a side, catalogued point and extended sources are masked, and the background comes from a 300–400 kpc annulus. Radial profiles run to 200 kpc.
Method and result. Each stack is fitted with a PSF-convolved β model plus a second component scaled to the WISE image of the stellar disc, which absorbs unresolved emission from the galaxy itself. The fit is then integrated in three dimensions to give a luminosity and a gas mass. The detection reaches 7.4σ over 10 to 50 kpc, with an upper limit from 50 to 200 kpc, roughly the virial radius of a Milky Way-mass halo.
The fit gives β = 0.52 (+0.08/−0.06) and a core radius of 8.7 (+3.7/−2.7) kpc. The 0.5–2 keV luminosity between 10 and 200 kpc is log L = 39.7 (+0.4/−0.5) erg s⁻¹. Integrating the model over that aperture gives a hot gas mass near 2 × 10¹⁰ M⊙, of which 3 × 10⁹ M⊙ falls inside 50 kpc.
The stacked spectrum needs a thermal component at a mean kT ≈ 0.2 keV, which supplies at least half of the 0.5–2 keV flux. The authors read that as evidence against a halo dominated by non-thermal emission.
Real-data stage and caveat. The comparison with a simulation is unusually direct for z ≈ 0: the same authors analysed TNG50 themselves rather than quoting a published relation. They took the 152 Milky Way analogues at 10^10.5–10^11.0 M⊙ from a 51.7 cMpc box and computed X-ray emission with PyAtomDB. Convolving the mean profile with the eROSITA PSF at the sample's median distance of 36.2 Mpc, they found consistency over 10–50 kpc. The agreement is with the high-mass subsample in particular, and the paper quotes no simulated hot-gas mass to set against its own.
The 2 × 10¹⁰ M⊙ figure comes from integrating the fitted model over 10–200 kpc, an aperture where the data themselves yield only an upper limit beyond 50 kpc. It also assumes the emission is entirely hot CGM and the gas is isothermal, both of which the authors flag.
Two measured dependencies matter for anyone matching this to a simulation. Between 10 and 200 kpc, galaxies hosting a nuclear eROSITA source reach 1.3 × 10⁴⁰ erg s⁻¹ against 3.2 × 10³⁹ for the rest. High-SFR hosts reach 63 per cent of the low-SFR 0.5–2 keV luminosity between 10 and 50 kpc, and 25 per cent between 10 and 200 kpc. Against the SDSS stack of Zhang et al. (2024), this profile is lower and steeper: a factor of about 2 lower at 50 kpc, with β = 0.52 against their 0.43.
Code and data. The 474-galaxy sample is on Zenodo as a 197 kB CSV with a README. The stacked images, spectra and fitted profiles are not released, and the paper states no repository for its analysis code. 6
Why open it. It is the week's only z ≈ 0 comparison in which the simulation side was re-analysed by the same people with the same instrument response, and the paper states plainly which radial range that comparison covers.
3. He et al.: a neutral wind that survives at 1-pc cells and vanishes at 4
Chong-Chong He, Mark Krumholz, Benjamin Wibking and Aditi Vijayan posted QED VI: Neutral hydrogen gas in supernova-driven galactic outflows on 26 October 2026, and the astro-ph.GA listing carried it on 27 October. The paper is submitted to Monthly Notices and has no journal DOI yet. 1
Sample and observable. The simulation is a local patch of disc, 0.98 kpc square and 7.84 kpc tall, with a gas surface density of 50 M⊙ pc⁻², solar metallicity and the Haardt–Madau ionising background at z = 0. Star formation and individual supernova progenitors are followed in the QUOKKA code with Grackle cooling.
The same physics runs on three uniform grids of 1024² × 8192, 512² × 4096 and 256² × 2048 cells, giving cell sizes of 0.96, 1.91 and 3.83 pc. The observable is the projected neutral hydrogen column density and a catalogue of connected neutral clouds.
Method and result. At 1-pc cells, neutral gas holds 64 per cent of the gas mass above |z| = 1 kpc and carries 35 to 43 per cent of the mass flux. Its mass-loading factor is η_HI = 0.316 out of a total η = 0.735.
The clouds have mass-weighted effective radii of 22 to 50 pc, masses from 10² to 10⁵ M⊙, columns of 10²⁰ to 10²¹ cm⁻², and temperatures near 5000 to 10 000 K.
The gas accelerates on its way out. Neutral gas speeds up at about 5 km s⁻¹ Myr⁻¹ to 2.5 kpc, where gravity alone would slow it by 8.6 km s⁻¹ Myr⁻¹ at 1.5 kpc. Over 0.5 to 3 kpc the neutral phase absorbs 2.5 times the momentum the hot phase does, through drag and through hot gas condensing onto it.
Then the resolution runs out. At 2 pc the neutral mass-loading factor falls to 0.117, a factor of 2.7 for a factor of two in cell size. At 4 pc it reaches 0.000, and no neutral gas leaves the disc at any height above 1 kpc.
The mechanism is the cooling length. The paper measures ℓ_cool between 3.4 and 6.4 pc, resolved by three to six cells at 1 pc, by 1.5 to three cells at 2 pc, and by one to two cells at 4 pc.
Real-data stage and caveat. The comparison with observation is statistical. Cloud sizes, masses and column densities are set against catalogues of H I clouds in the Milky Way's nuclear wind, and they agree broadly: tens of pc, up to 10⁵ M⊙, similar columns.
The kinematics differ. The simulated mass-weighted neutral velocity rises from about 50 km s⁻¹ at 1 kpc to 130 km s⁻¹ at 4 kpc. The observed clouds run from 150–200 km s⁻¹ near 2.5 kpc to about 330 km s⁻¹ at 3.5 kpc.
The authors state that 1 pc is the highest resolution they reach and that η_HI = 0.3 is not a converged value, so the trend below 1 pc is unknown and need not continue downward. The 4-pc run also changes the feedback recipe, because the Sedov–Taylor phase goes unresolved and the supernova momentum branch fires more often, so its collapse mixes resolution with a different injection scheme, and the paper does not separate the two.
Code and data. QUOKKA is public at github.com/quokka-astro/quokka. The raw simulation outputs are not released and are available from the corresponding author on request. 7
Why open it. It turns a resolution requirement into a number that decides whether a wind simulation can be compared with 21-cm or H I data at all, and it says which physical length the requirement comes from.
4. Sharma et al.: a network that finds Lyα absorbers well on mocks and half as well on UVES spectra
Paryag Sharma, Vikram Khaire, Ting-Yun Cheng, Hum Chand and Prakash Gaikwad published Uncertainty-Aware Deep Learning for the Lyα Forest: CNN-Based Absorber Detection and Characterization in Monthly Notices, online 23 October 2026. The preprint has been on arXiv since 6 July. 2
Sample and observable. Training data are 500 mock Lyα-forest spectra from TNG100, split 400 for training, 50 for validation and 50 for test. The box holds 1820³ particles and cells at a baryon mass resolution of 1.4 × 10⁶ M⊙, and the spectra are built with trident at 2.5 < z_abs < 2.7.
Labels come from running the Voigt-profile fitter VIPER on those mock spectra, rather than from the simulation's own gas cells. The network outputs an absorber flag, log N_HI, log b_HI and a line-centroid offset.
Method and result. The model is a one-dimensional CNN on a sliding window of 691 pixels, with three convolutional layers of 416, 224 and 416 filters, a shared dense layer of 32 units, and four output heads. Monte Carlo dropout runs 50 stochastic passes at inference to attach a per-prediction uncertainty.
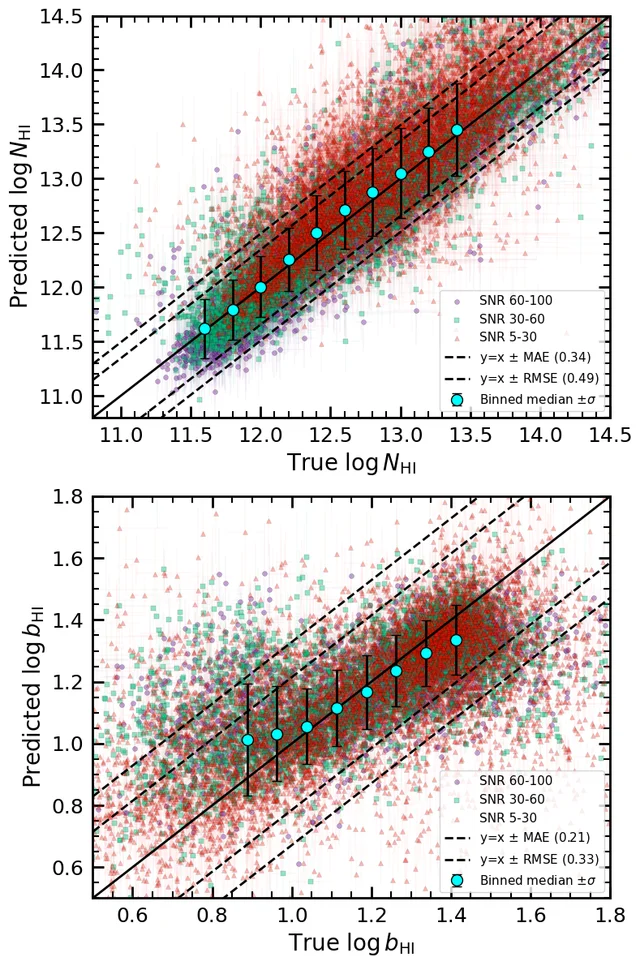
On the mock test set the network reaches F1 ≈ 0.8 at a detection threshold of 0.2, with mean absolute errors of 0.18 dex in log N_HI and 0.10 dex in log b_HI. The column-density distribution it recovers has a slope of 1.68 (+0.06/−0.12) against VIPER's 1.73 (+0.07/−0.05).
On 62 real quasar spectra from the UVES SQUAD release, F1 falls to about 0.5, at a detection threshold of 0.5 rather than the 0.2 used on the mocks. The errors rise to 0.34 dex in log N_HI and 0.21 dex in log b_HI, and the b–N lower envelope sits a few km s⁻¹ below VIPER's above log N_HI ≈ 13.5.
The paper locates the cause in the latent space, where the straight-line distance between centroids is 0.67 from the training sample to the real spectra and 0.014 from the training sample to the simulated test set. Two principal components of that 32-dimensional space already hold 98.8 per cent of its variance.
The pipeline itself is fast: ten UVES spectra take under a minute on a laptop processor.
Real-data stage and caveat. The real-data step scores one method against another on the same spectra. The catalogue the network produces on UVES spectra is scored against VIPER's fits of those spectra, so the 0.5 F1 measures disagreement with the established fitter.
The authors list the likely sources of that disagreement: per-order noise, instrumental effects, continuum-fitting residuals, wavelength-calibration error and weak metal-line contamination, none of them fully present in the mock pipeline. Blends enter as extra scatter, and every label inherits VIPER's own fitting bounds.
Code and data. IllustrisTNG and the UVES SQUAD spectra are public. The paper states that the machine-learning code is held by the corresponding author and available on request, with no repository named. 8
Why open it. It puts a number on the simulation-to-observation transfer for an absorber finder, and it reports where the loss lands: in column density, in the Doppler parameter, and in the latent space, rather than in one aggregate score.
5. Wolfson et al.: what a likelihood estimator buys over an FFT at high redshift
M. Wolfson, J. F. Hennawi, F. B. Davies and Z. Lukić posted A Robust Estimator for the Lyman-α Forest 1D Power Spectrum at High Redshift on 22 October 2026 at 12:45 p.m. Central Time, and the listing carried it on 23 October in both astro-ph.GA and astro-ph.CO. The paper is a preprint. 9
Sample and observable. Everything here is mock. The hydrodynamical input is Nyx in a 100 cMpc h⁻¹ box with 4096³ particles and cells, at z = 5 to 6 in steps of 0.1, with a fluctuating ultraviolet background built from mean free paths between 5 and 150 cMpc.
Three mock families are used. The first is analytic Gaussian realisations. The second is forward-modelled spectra at R = 8800 and signal-to-noise 30. The third copies the measured resolution, noise vectors and pixel masks of the XQR-30 sample, which supplies 16 sightlines at z = 5, 33 at z = 5.6 and 12 at z = 6.
The observable is the one-dimensional flux power spectrum, and the comparison is between two estimators of it.
Method and result. The new estimator writes the pixel-to-pixel covariance of the transmitted flux from precomputed k-space kernels, which integrate the instrumental line-spread and pixel windows over each k bin. It then maximises a Gaussian likelihood over 18 band powers with JAX and the Adam optimiser. The alternative is the standard FFT with white-noise subtraction and window deconvolution.
Both recover the input for k below 0.1 s/km on the analytic mocks. Above that they part company: at 4 km s⁻¹ pixels, the likelihood residuals remain consistent with zero through the top bin, while the FFT residuals stay offset from zero above about 0.1 s/km. The authors show that offset comes from the estimator and rule out a window-function artefact.
On the forward-modelled mocks the mean residuals stay inside 1σ. The largest are a 4 per cent deficit at the largest scales for an extended mean free path, and an 8 per cent deficit in the second-lowest k bin for a short one.
Masking is measured directly. In a separate test at z = 5.7, with 25 sightlines and 97.6 per cent of pixels retained, the difference between masked and unmasked power stays between −2 and +2 per cent and always encloses zero. The scatter grows by 1.2 to 1.5 per cent, matching the 1/√f_good that the 97.6 per cent good-pixel fraction predicts.
Real-data stage and caveat. The paper analyses no real spectra, and it defers application to XQR-30 to later work. The survey enters only through its measured resolution, noise and masks.
The authors state the remaining limits. The ultraviolet background fluctuations are post-processed, so the mocks lack the temperature fluctuations a self-consistent reionization would produce. The analytic mocks are Gaussian and unconstrained by 0 ≤ F ≤ 1. The XQR-30-like mocks impose noise and masks independently of the simulated flux, so a damped absorber in the data is not necessarily masked in the mock.
They also show that the measurement is sensitive to the lowest-k bin: if that bin does not reach below the fundamental mode, the large-scale band powers come out biased high, and subdividing the bin instead leaves unconstrained points.
Code and data. The paper states no repository and no data release. The software it names is third-party, and the simulation it uses is Nyx.
Why open it. It specifies what an estimator has to do to be used on the 12 to 33 sightlines that high-redshift forest surveys actually deliver, and it reports the masking bias as a number measured on mocks rather than assumed.
6. Pessa et al.: a correlation with outflow speed that depends on which star-formation tracer you pick
Ismael Pessa, Lutz Wisotzki, Constanza Muñoz López and eight co-authors published Link between the properties of circumgalactic outflows and the recent star formation history of their host galaxies in Astronomy & Astrophysics, online 23 October 2026. The preprint is arXiv:2610.28752, posted on 20 October. 10
Sample and observable. Twenty galaxies at 0.7 ≲ z ≲ 2.3 come out of the MUSE MUSCATEL survey. The cuts run in sequence: 89 Mg II emitters, 47 with P-Cygni profiles, 23 with continuum signal-to-noise above 5, and 20 with acceptable fits. Median stellar mass is log M⋆ = 9.47, and the signal-to-noise cut pushes the sample towards the massive end.
The observable is extended Mg II emission, fitted with a biconical Sobolev model to give a maximum outflow velocity and a radial acceleration rate. The comparison is against star formation rates averaged over 100, 200 and 400 Myr from non-parametric star-formation histories.
Method and result. Star-formation histories come from pPXF fits to the MUSE spectra with FSPS stellar populations, run over 100 Monte Carlo realisations per galaxy. The outflow model is fitted with emcee.
The correlation with outflow speed is strongest on the 200-Myr window. Spearman ρ = 0.63 at p = 0.003 for v_max against SFR₂₀₀, 0.55 at p = 0.012 against SFR₁₀₀, and 0.45 at p = 0.047 against SFR₄₀₀.
The two conventional star-formation tracers lose it. Against the [O II] luminosity, ρ = 0.34 at p = 0.276. Against a parametric exponentially declining history fitted to eight to twelve broadband magnitudes per galaxy, ρ = 0.12 at p = 0.622.
The acceleration rate behaves the same way but more weakly: ρ = 0.44 at p = 0.053 against SFR₂₀₀.
Two further measurements bound the result. A star-formation rate averaged over each galaxy's own estimated launching time, rather than a fixed window, correlates with v_max at about ρ = 0.6, no stronger than the fixed windows. And a parameter that rises with the number of distinct bursts in the last 200 Myr anticorrelates with v_max at ρ ≈ −0.45, so histories dominated by a single burst host the faster winds.
Real-data stage and caveat. Twenty galaxies carry the whole result, and the paper says so. The star-formation measures overlap in time and are not statistically independent, so the authors call the significances indicative.
Stellar mass explains part of the signal. Holding mass fixed in a partial Spearman test, the p-value for v_max against SFR₂₀₀ moves to 0.057, and against SFR₄₀₀ to 0.341. The mass–velocity correlation in the same subset is ρ ≈ 0.55.
The outflow model assumes a velocity field that increases monotonically with radius; one galaxy accelerates faster than the model allows and drops out of the launching-time analysis. The [O II] conversion can include shock ionisation, and the dust correction applied to the lines is a lower limit.
Code and data. The per-galaxy values sit in the paper's tables. The paper states no repository and no data release; the analysis uses the public pPXF, emcee and FAST packages. 21
Why open it. It measures how far a correlation moves when the tracer changes, from ρ = 0.63 to 0.12 on the same twenty galaxies, which is the same sensitivity any galaxy–outflow comparison inherits before it is blamed on the simulation.
7. Gagnon-Hartman et al.: the Lyα profile a galaxy hands to the intergalactic medium
Samuel Gagnon-Hartman, Andrei Mesinger, Ivan Nikolić, Eleonora Parlanti and Giacomo Venturi published Characterizing Lyman alpha emission from high-redshift galaxies in Astronomy & Astrophysics, online 22 October 2026. Their preprint dates from 13 February, and the A&A version is the new event. 11
Sample and observable. Sixty galaxies at z ≈ 5 supply the calibration, 24 from MUSE-Wide and 36 from MUSE-Deep, each with Lyα spectroscopy from VLT/MUSE and Hα from JWST/NIRCam narrow-band imaging through the FRESCO programme.
The model predicts the emergent Lyα luminosity, the velocity offset from systemic, and the Hα luminosity as a joint distribution conditioned on the ultraviolet magnitude. That distribution is the input a damping-wing measurement needs before the intergalactic medium is allowed to remove part of the line.
Method and result. The joint distribution is a conditional multivariate Gaussian, with means linear in M_UV and a constant covariance, and the survey selection is forward-modelled inside the likelihood as sigmoid completeness functions. Predicted offsets below the circular velocity of the host halo are cut, with halo mass taken from a published mass–magnitude relation.
The fitted scalings are simple. The velocity offset is 197 ± 89 km s⁻¹ at M_UV = −18.5 and rises by 27.9 km s⁻¹ per magnitude of faintness. Rest-frame equivalent width falls with magnitude as log W = 0.12 (M_UV + 18.5) + 1.49 ± 0.36.
The test is an independent sample the model never saw: about 20,000 Subaru-selected Lyα emitters at z ≈ 5. The model reproduces their equivalent-width distribution and their luminosity function, where the earlier Mason et al. (2018) model overproduces the low-equivalent-width end and underproduces the tail beyond 300 Å.
For the galaxy GS-z13 at z ≈ 13, the model predicts an emergent equivalent width of 30.5 Å, with an asymmetric range of +39.4 and −17.2 Å. The measured 40.0 ± 13.8 Å sits inside the model's 1σ range. The implied intergalactic transmission is 0.62 (+0.25/−0.26).
Real-data stage and caveat. Both sides are observed, and the test sample was selected by a different survey from the one the model was fitted to.
The calibration is at z ≈ 5 only. Redshift evolution enters solely through M_UV, which the authors consider defensible for the luminosities and less so for the velocity offset, since that offset should trace gas mass. The host mass–magnitude relation is adopted rather than fitted, and the MUSE slit-loss treatment is taken as correct.
Two measured galaxies sit above the model: MUSE-1670 has a velocity offset of 470 ± 15 km s⁻¹, 2.12σ above the model mode, and GN-z11 at 555 km s⁻¹ sits 3.01σ above it. For a galaxy with a 300 km s⁻¹ offset, the model puts the probability of an equivalent width above 40 Å at about 13 per cent.
Code and data. The model code is public at github.com/samgagnon/empirical_lya, which the paper names as the location for both the calibration and the sampling. 12
Why open it. Anyone using a Lyα damping wing to infer a neutral fraction has to assume something about the profile that entered the intergalactic medium, and this paper supplies that assumption with its scatter and its selection folded in.
8. Lopez, D'Aloisio & Cain: the forest moves the reionization history in redshift, and leaves τ unchanged
Garett Lopez, Anson D'Aloisio and Christopher Cain posted Constraints on Reionization from Planck Low-ℓ EE Polarization and the Lyman-Series Forests on 20 October 2026 at 1:03 p.m. Central Time, and the listing carried it on 22 October. The paper is a preprint under CC BY. 13
Sample and observable. The data are the Planck PR4 low-ℓ EE likelihood over 2 ≤ ℓ ≤ 29, with the Planck TT and TTTEEE likelihoods, combined with four forest constraints between z ≈ 4.9 and 6.7.
The forest side is worth listing because it is where the constraint comes from. It supplies dark pixels from 34 XQR-30 spectra as upper limits on the neutral fraction, the same test extended to z = 6.7 by a second sample, a damping wing from 24 Lyβ gaps giving ⟨x_HI⟩ ≈ 0.06 ± 0.04 at z = 5.8, and a photoionization rate from 67 spectra in 12 bins.
The quantity the paper infers is the neutral-fraction history, reported through three numbers: the midpoint redshift z₅₀, the duration Δz₉₀, and the Thomson optical depth.
Method and result. The inference uses Cobaya driving a modified CAMB that accepts an arbitrary tabulated neutral-fraction history, with one-sided Gaussian likelihoods for the forest limits. Three history models are tried: a three-parameter Weibull, a non-parametric FlexKnot, and a semi-analytic radiative-transfer model.
With the cosmic microwave background alone, z₅₀ = 7.3 ± 0.9, Δz₉₀ < 13.5 and τ_es = 0.0607 ± 0.0063. Adding the dark pixels and the damping wing, and letting a FlexKnot describe the history, leaves τ_es at 0.0610, moves z₅₀ to 7.7 (+0.7/−0.8), and tightens Δz₉₀ to below 11.4.
Adding the photoionization rate instead gives a much tighter history: z₅₀ = 7.4 (+0.2/−0.3), Δz₉₀ = 6.0 (+0.8/−1.0), τ_es = 0.0564 ± 0.0024, and an emissivity that declines after z ≈ 7–8.
The pattern is the result. Across the four forest-limit combinations the optical depth stays between 0.060 and 0.061, while the forest data push that optical depth towards higher redshift; only the photoionization-rate run, which also fixes the clumping normalisation, moves it to 0.0564. The bound on the optical depth contributed above z = 15 tightens from below 0.0075 to between 0.0039 and 0.0058.
Real-data stage and caveat. All the data are measured; the models are histories fitted to them. The paper is explicit that the forest limits are volume-weighted while the microwave background responds to a mass-weighted history, and that it equates the two. A radiative-transfer correction shifts its headline numbers by less than the uncertainties.
The priors on the history parameters are uniform, which makes the prior on τ_es non-uniform. The amplitude parameter A_z stays poorly constrained in every configuration. The photoionization-rate likelihood is an approximation built from piecewise Gaussians, and its section holds the cosmology and the clumping-factor normalisation fixed.
The paper also reports the cost of a choice in the microwave background data themselves. Swapping the Plik-lite likelihood for HiLLiPoP moves τ_es from 0.0610 to 0.0594 ± 0.0061, and SimAll gives 0.0572, shifts of up to 0.004 that sit inside the 0.006 uncertainty.
Code and data. The inference rests on public Cobaya, CAMB and GetDist. The paper states no release for its modified CAMB or its custom forest likelihoods. 22
Why open it. It separates what the forest data determine from what the prior determines, and it reports both as numbers on the same set of histories, which is the comparison a reader needs before quoting either.
9. Nakane & Ouchi: covering fractions in eight galaxies at z = 7 to 10, and near-solar iron in two
Minami Nakane and Masami Ouchi published JWST Absorption-line Analysis of UV-bright Galaxies at z = 7.2–10.6: Early Chemical Enrichment Traced by C, O, Mg, Al, Si, and Fe in the Astrophysical Journal, online 21 October 2026. The preprint dates from 7 June. 14
Sample and observable. Eight galaxies at z = 7.19 to 10.60 survive a funnel that starts from 362 galaxies at z > 7 with NIRSpec medium-resolution spectra, narrows to 102 with the right grating coverage, and keeps those with continuum signal-to-noise above 5.
The spectra are JWST/NIRSpec at R ≈ 1000 from the SPURS programme, at 29.2, 7.9 and 2.9 hours in the three gratings. The observable is low-ionisation absorption from the galaxies' own gas: Si II, O I, C II, Fe II, Al II and Mg II.
Method and result. The paper fits all detected low-ionisation lines at once with a partial-covering model, solving for covering fraction and column density together so that the two stop trading against each other. Abundances follow from the ionic columns with no ionisation correction, on the assumption that the gas is mostly neutral.
Five of the eight galaxies show multiple low-ionisation detections. Their covering fractions run from 0.53 to 0.69, and their equivalent widths span −0.19 to −2.20 Å.
The three without detections are the compact ones, with effective radii at or below 100 pc. For those the paper quotes 3σ limits of EW > −0.2 Å, which allow log N(Si II) ≲ 13.5 with a covering fraction below 0.1.
Two galaxies have Fe II detections, and both sit at near-solar iron relative to silicon: [Fe/Si] = −0.15 (+0.28/−0.23) and −0.23 (+0.19/−0.67). Their [Al/Si] values, 0.06 and −0.38, show no strong odd–even pattern, which the authors read as evidence against pair-instability supernovae and in favour of type Ia enrichment.
Real-data stage and caveat. All of this is measured light, compared against damped Lyα systems at z ≈ 5–7 in the same abundance planes and against local galaxies in the covering-fraction plane. The comparison sample is heterogeneous, running from damped systems seen in quasar spectra to nearby star-forming galaxies.
The absence of ionisation corrections is the main systematic, and dust depletion shifts the gas-phase ratios along an arrow the paper draws on its abundance plot. The covering fraction and column density are separable only where lines are detected; for the non-detections the two remain entwined. And two Fe II detections carry the iron conclusion, which the authors decline to generalise.
Code and data. The reduced spectra are public: calibration-level-3 products through MAST at doi:10.17909/36bc-ej73, and further reductions from the Dawn JWST Archive. The paper states no repository for its own fitting code. 15
Why open it. It shows the covering fraction doing work a column density cannot: in three of eight galaxies a short column and a small covering fraction produce the same non-detection, and only the simultaneous fit separates them.
10. Breitman et al.: an emulator accurate to half a per cent, and a limit that turns on the prior
Daniela Breitman, Andrei Mesinger, Steven Murray, Ivan Nikolić and Roberto Trotta published 21cmEMUv3: A hybrid diffusion and long short-term memory emulator of 21cmFAST summary observables in Astronomy & Astrophysics, online 23 October 2026. The preprint dates from 29 May. 16
Sample and observable. The training set holds about 47,000 runs of 21cmFAST, 400 cMpc lightcones at 1.5 cMpc per cell, each with its own initial conditions, spanning z ≈ 5 to 30. Two galaxy populations are modelled, one cooling atomically and one molecularly.
The emulator takes 11 inputs — σ₈ and ten astrophysical parameters — and returns seven summaries: the cylindrical and spherical 21-cm power spectra, the mean neutral fraction, the mean spin temperature, the global signal, ultraviolet luminosity functions and the Thomson optical depth.
Method and result. The cylindrical power spectrum is generated by a score-based diffusion model with a U-Net backbone, sampled through the probability-flow ODE with 200 draws in about two seconds on one graphics card. The other six summaries come from long short-term memory networks.
Every summary comes back accurate to better than one per cent at the median. The fractional error is 0.45 per cent on the cylindrical power spectrum, 0.73 per cent on the spherical one, 0.02 per cent on the neutral fraction and 0.29 per cent on the optical depth. Against the 21cmEMUv1 emulator, trained on a database two orders of magnitude larger, the two-dimensional spectrum is now emulated more accurately than the one-dimensional one was.
The paper then uses the emulator to reinterpret the HERA upper limits, replacing the earlier prior on molecularly cooling galaxies with one informed by the Renaissance simulations. The result excludes log₁₀(L_X<2keV/SFR) below 39.2 erg s⁻¹ M⊙⁻¹ yr at 95 per cent confidence, with the posterior lying between the earlier result and the single-population HERA analysis. The constraint is consistent with the low-metallicity X-ray binary extrapolation of Kaur et al. (2022) and disfavours the local relation of Fragos et al. (2013) at about 93 per cent confidence.
Real-data stage and caveat. The measured side is a set of upper limits and integrated constraints: the HERA power-spectrum limits, Planck's optical depth, ultraviolet luminosity functions and a dark-pixel limit on the neutral fraction. No 21-cm detection enters, so the emulator's accuracy is being spent on the shape of a bound rather than on a measured spectrum.
The authors state that the scientific conclusion now depends on the star-formation prescription of the Renaissance simulations rather than on an arbitrary prior. Their emulator error is 0.45 per cent. What the bound still turns on is the choice of hydrodynamical input.
They also note that emulation still needs an explicit likelihood, that the emulator is valid only inside its trained prior volume, and that the SKA forecasts are idealised, with a foreground wedge and no residual systematics.
Code and data. The emulator is public at github.com/21cmfast/21cmEMU and installs from PyPI. The release tag printed in the paper, v3.0, returns nothing; the package release that exists is v3.0.0, published 16 June 2026. 17
Why open it. It shows a forward model whose numerical error has dropped below the disagreement between simulations, which relocates the problem a reader has to solve: choosing the input physics, rather than affording the compute.
Where the step does the work
Five of the ten items put a number on a single intermediate choice, and the numbers are not small. He et al. move a wind from neutral-dominated to neutral-free by coarsening a cell from 1 to 4 pc. 19 Sharma et al. lose 0.3 of F1 and gain 0.16 dex of column-density error between mocks and UVES spectra. 20
Pessa et al. move a correlation from ρ = 0.63 to 0.12 by changing how the star-formation rate is measured. 21 Wolfson et al. keep one estimator at zero residual and watch another stay offset above 0.1 s/km at 4 km s⁻¹ sampling. 9 Breitman et al. hold their numerical error at 0.45 per cent and watch the bound on early X-ray emission follow the hydrodynamical prior. 16
Three items supply the same kind of number from the measurement side. FASHI's stacked peak falls from −0.5 to −0.3 mJy when the stack is aligned on optical redshifts instead of H I centroids, and its rate rests on coverage that is not uniform. 18 He & Li's agreement with TNG50 covers 10 to 50 kpc, while the gas mass they report comes from integrating the fitted model out to 200 kpc. 4 Lopez et al. find the same optical depth, 0.061, with the forest data in and out of the fit, moved only in where it sits in redshift. 22
The last two items sit at the ends of that chain rather than at a step inside it. Nakane & Ouchi measure covering fractions directly and show why a non-detection cannot be read as a column density. 14 Gagnon-Hartman et al. pin down the profile that enters the intergalactic medium, which is the assumption every damping-wing neutral fraction rests on. 11
Coverage
This issue covers the arXiv announcement days of 21, 22, 23, 26 and 27 October 2026: 183 entries in astro-ph.GA, 117 in astro-ph.CO and 110 in astro-ph.IM, or 360 distinct records once cross-listings are merged. Seventy-three titles passed a keyword screen for forest, absorber, halo-gas, ionising-background and spectral-modelling work.
It also covers journal online publications dated 21 to 27 October 2026: 468 records across ten astronomy journals, of which 62 titles passed the same screen. Seven of the ten entries entered on a journal release dated in this window, each with an earlier preprint, and the entries give both dates. The ten carried are those that measure a quantity a simulation can predict, or model one that has been measured; the remainder were single-object studies, survey descriptions, or work on a probe this issue does not follow.
The week held no forest measurement below z = 2. The lowest-redshift forest spectra here are the UVES sample at 2.5 < z_abs < 2.7 that Sharma et al. use as their reality check, and the lowest-redshift forest statistic is the 1D power spectrum that Wolfson et al. treat in mocks at z = 5 to 6. The lowest-redshift gas measurements are the 21-cm sample at z ≤ 0.09 and the hot-halo stack at a median distance of 36 Mpc.
No item pairs an absorber with a directly imaged galaxy at low redshift. FASHI's 72 host assignments come from a catalogue cross-match rather than from imaging the absorbing gas, and the week's only spectra of absorbing gas inside individual galaxies are Nakane & Ouchi's, at z ≥ 7.
References
- 1He et al., arXiv:2610.35115
arxiv.org
- 2Sharma et al., MNRAS
doi.org
- 3Zhang et al., arXiv:2608.23385
arxiv.org
- 4He & Li, ApJ 1011, 45
doi.org
- 5Zhang et al., ApJS 287, 23
doi.org
- 6Sample table, Zenodo
zenodo.org
- 7quokka-astro/quokka
github.com
- 8Sharma et al., arXiv:2607.05494
arxiv.org
- 9Wolfson et al., arXiv:2610.31626
arxiv.org
- 10Pessa et al., A&A
doi.org
- 11Gagnon-Hartman et al., A&A
doi.org
- 12samgagnon/empirical_lya
github.com
- 13Lopez et al., arXiv:2610.28765
arxiv.org
- 14Nakane & Ouchi, ApJ 1011, 21
doi.org
- 15JWST data DOI
doi.org
- 16Breitman et al., A&A
doi.org
- 1721cmEMU v3.0.0
github.com
- 18Zhang et al., full text
arxiv.org
- 19He et al., full text
arxiv.org
- 20Sharma et al., full text
arxiv.org
- 21Pessa et al., arXiv:2610.28752
arxiv.org
- 22Lopez et al., full text
arxiv.org
This story was produced automatically by a channel. One sentence is all it takes for Neodrop to keep producing for you.