Accenture (ACN) — fortress fundamentals at a 5-year valuation trough
Accenture plc (NYSE: ACN) clears all three hard screening criteria definitively — ROE of 26.72%/26.77%/24.29% in FY2023–FY2025 (SEC EDGAR XBRL verified), free cash flow accelerating to $12.5B TTM, and a trailing P/E of 14.30× that is 51% below its 5-year historical average and at the peer-group median. The central tension is a genuine bull/bear split on AI disruption: the market has re-rated the entire IT services sector lower on fears that AI will cannibalize Accenture’s consulting and BPO revenue, but the company’s own GenAI bookings are running at $2.2B per quarter (+76% year-over-year) and the balance sheet is an AA−-rated fortress with net cash and 43× interest coverage. Q3 FY2026 earnings on June 18, 2026 are the next material data point.

Current price: $174.43 (June 8, 2026 close) · Market cap: $107.1B · Sector: Technology / IT Services & Consulting 1
Accenture plc (NYSE: ACN) passes all three hard screening criteria with room to spare. Return on equity has held above 24% every year from FY2023 through TTM — never once threatening the 15% floor. Free cash flow has been positive and growing, reaching $12.5B on a trailing-twelve-months basis. And after a 45% drawdown from its 52-week high of $321.77, the stock's trailing P/E of 14.30× sits roughly 51% below its own 5-year average and at the peer-group median. 1
The tension in this profile is not between quality and price — quality is undeniable and the price is cheap relative to history. The tension is between two plausible interpretations of why the stock is cheap: either the market is over-discounting AI disruption fears and has handed investors a generational entry point into the global IT services leader, or AI genuinely cannibalizes a meaningful slice of Accenture's $72B revenue base and the current valuation is the new normal. The Q3 FY2026 earnings report on June 18, 2026 is the next data point that will sharpen that debate.
What Accenture does and how it makes money
Accenture plc is a global professional services company headquartered in Dublin, Ireland, founded in 1989. 2 With 779,000 employees across more than 120 countries and FY2025 revenue of $69.7B, it is the largest IT services firm in the world — roughly twice the scale of the next-largest competitor. 3
The business helps organizations modernize their technology infrastructure and operations. Revenue splits roughly 50/50 between Consulting (strategy, transformation advisory) and Managed Services (running outsourced operations and IT systems). Five industry groups account for all revenue: Products (30%), Health & Public Service (20%), Financial Services (19%), Communications/Media/Technology (17%), and Resources (13%). 4
What makes the model structurally durable is the consulting-to-operations flywheel. Accenture typically enters a large client through strategy or technology consulting, then expands into multi-year managed services contracts that provide stable, recurring revenue. Approximately 80% of large deals span multiple service lines, creating natural cross-sell and switching costs. About 215 "Diamond" clients — each generating more than $100M annually — anchor the revenue base, with no single client exceeding 10% of total revenue. 2
ROE track record: FY2023–FY2025 with SEC EDGAR verification
Accenture has sustained ROE well above 15% for years, but the trend since the FY2021–FY2022 peak deserves attention. 5
| Fiscal year | Net income (SEC) | Shareholders' equity (year-end) | SEC-computed ROE | StockAnalysis ROE | Discrepancy |
|---|---|---|---|---|---|
| FY2021 (ended Aug 2021) | — | — | — | 31.87% ✓ | — |
| FY2022 (ended Aug 2022) | — | — | — | 32.63% ✓ | — |
| FY2023 (ended Aug 2023) | $5,907M | $22,106M | 26.72% ✓ | 28.47% | +1.75pp |
| FY2024 (ended Aug 2024) | $6,877M | $25,693M | 26.77% ✓ | 26.67% | −0.10pp |
| FY2025 (ended Aug 2025) | $6,872M | $28,289M | 24.29% ✓ | 25.51% | +1.22pp |
| TTM (ended Feb 28, 2026) | $7,648M | — | — | 24.10% ✓ | — |
Methodology disclosure: SEC EDGAR XBRL figures use
us-gaap:NetIncomeLoss (attributable to parent) divided by year-end us-gaap:StockholdersEquity from Accenture's 10-K filings (CIK 0001467373). 6 StockAnalysis uses average shareholders' equity, which produces a modestly higher result in years when equity is growing. Both methods confirm every year clears 15% by a wide margin. The directional trend — declining from the FY2021–FY2022 peak of 31–33% to the current 24% range — is consistent across both sources. All three hard-criteria years (FY2023–FY2025) are confirmed against SEC filings with discrepancies of ≤1.75 percentage points. 56The ROE decline from 33% to 24% over four years is worth examining. It is not driven by a deteriorating business — net income grew from $5.9B (FY2023) to $7.6B (TTM). The primary cause is equity base expansion: shareholders' equity grew from $22.1B to $28.3B as retained earnings accumulated. That is a healthy form of ROE compression, not a warning sign.
Free cash flow: consistent and accelerating
Accenture's FCF profile is one of the cleanest in the IT services sector. 7
Loading chart…
| Period | OCF | CapEx | FCF | FCF margin | YoY change |
|---|---|---|---|---|---|
| FY2023 | $9,524M | $528M | $8,996M | 14.0% | — |
| FY2024 | $9,131M | $517M | $8,614M | 13.3% | −4.2% |
| FY2025 | $11,474M | $600M | $10,874M | 15.6% | +26.2% |
| TTM (Feb 28, 2026) | $13,080M | $583M | $12,497M | 17.3% | — |
SEC EDGAR XBRL independently confirms FY2023–FY2025 OCF and CapEx figures to within $1M rounding. 6
FCF yield (TTM): $12,497M ÷ $107,089M market cap = 11.67%. This means the business is generating cash at roughly 1× its annual cost of financing on a trailing basis. P/FCF is 8.57× — the lowest in Accenture's recent history. For context, FCF per share on a TTM basis is $20.36, against a stock price of $174.43. 1
The FY2024 dip to $8.6B FCF was temporary — driven by a record $6.6B acquisition spend on 46 deals that year (which consumed working capital). FY2025's rebound to $10.9B and TTM's further acceleration to $12.5B suggest the elevated acquisition year was a one-time deployment, not a structural deterioration.
Valuation: deepest discount in five years, in line with peers
Loading stats card…
Metrics as of June 8, 2026 close. 1
Against Accenture's own 5-year history. All three core valuation multiples are near their deepest historical discounts: 58
| Multiple | Current | FY2021–FY2025 average | Discount to history |
|---|---|---|---|
| Trailing P/E | 14.30× | 29.00× | −50.7% |
| P/B | 3.44× | 7.96× | −56.8% |
| EV/EBITDA | 8.33× | 17.14× | −51.4% |
This compression is not an earnings story — EBIT grew 6.6% YoY in FY2025 and EBITDA grew 7.7%. The valuation reset is driven entirely by stock price decline: the market re-rated the entire IT services sector lower on AI disruption concerns. 9
Against sector peers. Once the historical premium is stripped away, Accenture trades at the peer-group median: 10111213
| Company | Trailing P/E | Forward P/E | P/B | EV/EBITDA | One-line description |
|---|---|---|---|---|---|
| ACN (Accenture) | 14.30× | 12.22× | 3.44× | 8.33× | Global #1 IT services; AI-exposed consulting |
| IBM (Int'l Business Machines) | 24.88× | 22.36× | 8.00× | 19.38× | Hybrid cloud/AI + enterprise services |
| CTSH (Cognizant) | 11.52× | 9.14× | 1.67× | 6.34× | IT services/outsourcing; closest ACN comp |
| INFY (Infosys) | 15.09× | 15.28× | 5.08× | 10.70× | Global IT consulting; India-based |
| EPAM (EPAM Systems) | 13.86× | 7.24× | 1.49× | 5.88× | Custom software development |
| Peer median | 14.48× | 12.21× | 3.38× | 8.52× | — |
| ACN vs. median | −1.2% | +0.1% | +1.8% | −2.2% | — |
For most of the past decade, Accenture carried a structural premium to this peer group — it was larger, more profitable, and more diversified. Today it trades at parity. The one multiple where Accenture stands out unfavorably is PEG: at 1.73× versus the peer median of 1.22×, Accenture's growth expectations relative to its current P/E remain higher than peers, meaning the forward P/E discount prices in accelerating EPS growth that still needs to materialize. 1
Revenue and earnings growth
Revenue growth has been lumpy but the direction since FY2024 is favorable. 7
| Period | Revenue | YoY growth | Net income | Operating margin | Net margin |
|---|---|---|---|---|---|
| FY2021 | $50,533M | — | $5,907M | 15.1% | 11.9% |
| FY2022 | $61,594M | +21.9% | $6,877M | 15.2% | 11.4% |
| FY2023 | $64,112M | +4.1% | $6,872M | 13.7% (trough) | 10.9% |
| FY2024 | $64,897M | +1.2% | $7,265M | 14.8% | 11.4% |
| FY2025 | $69,673M | +7.4% | $7,678M | 14.7% | 11.2% |
| TTM | $72,110M | +7.3% | $7,648M | 14.4% | 10.8% |
Three dynamics stand out. First, the FY2022–FY2024 growth slowdown (from +22% to +1%) reflected a post-pandemic normalization of enterprise IT budgets, not a competitive loss. Second, the FY2023 operating margin trough (13.7%) was driven by $1,063M in restructuring and optimization charges — a one-time item that distorted the year; underlying profitability was roughly in line with adjacent years. Third, the FY2025 reacceleration to +7.4% revenue growth, combined with margin recovery back to 14.7%, confirms the slowdown was cyclical. 7
FY2026 guidance is 2–5% local-currency revenue growth, with approximately a 1% drag from reduced US federal government spending. Analysts forecast a 3-year EPS CAGR of 7.7%. 1 Gross margin has been notably stable throughout — ranging from 31.9% to 32.6% across all measured periods — reflecting consistent pricing power in the face of cost pressures.
Balance sheet health
| Metric | Value | Context |
|---|---|---|
| Total cash | $9,410M | — |
| Total debt | $8,350M | — |
| Net cash position | $1,060M ($1.72/share) | Net cash — rare for a $107B company |
| Debt / equity | 0.25× | Versus IBM's 2.11× |
| Interest coverage (EBIT/interest) | 43.14× | EBIT $11.34B; interest ~$263M |
| Current ratio | 1.34× | Healthy; cash > near-term obligations |
| ROIC | 27.19% | Well above estimated WACC of ~9.6% |
Debt maturity schedule (from Accenture's Q1 FY2026 10-Q): 15
| Maturity | Amount | Coupon |
|---|---|---|
| FY2026 remainder | $100M | Commercial paper (4.1% avg rate) |
| FY2028 | $1,100M | 3.90% senior notes |
| FY2030 | $1,200M | 4.05% senior notes |
| FY2032+ | $2,700M | 4.25%–4.50% senior notes |
| Total | $5,100M | Fixed rate; no financial covenants |
The nearest meaningful maturity is the $1.1B tranche due in calendar 2027. At TTM FCF of $12.5B, Accenture can repay it comfortably from operating cash flow within five weeks of generation. S&P Global Ratings affirmed the AA− / A-1+ issuer credit rating (outlook: Stable) in October 2024, characterizing the $5B bond issuance as "opportunistic balance sheet optimization" rather than a shift to more aggressive financial policy. 1416 Fitch rates Accenture A+/F1. Moody's assigned an A1 issuer rating at its 2009 initial assessment. These ratings place Accenture among the most creditworthy non-financial companies in the US equity market.
Risk factors and red flags
Insider selling: 12-month pattern is entirely sells. Insider ownership stands at 0.06%–0.26% of shares outstanding. Every insider transaction over the past 12 months has been a sale — zero purchases. CEO Julie Sweet sold approximately $3.28M across 23 transactions in the past six months. CFO Angie Park, COO Kate Hogan, and all other C-suite officers have been net sellers without any offsetting buys. 17 This is the sharpest contrast with yesterday's NKE profile, where the CEO was actively buying. Low insider ownership in a professional services firm is not unusual — restricted stock grants are the compensation currency and executives routinely diversify — but the unbroken sell-only pattern warrants a note.
Short interest surge: up 34% in one month. Short interest stands at 24.15 million shares (3.94% of float, 4.27 days to cover). More significantly, this figure jumped 34% from 18.0 million shares in the prior month, the sharpest single-month acceleration in the measurement period. 17 The surge coincides with the Truist downgrade on June 1, 2026, when Truist analyst Arvind Ramnani cut the rating from Buy to Hold at a $210 target, citing AI potentially cannibalizing parts of Accenture's core services and ongoing client budget pressure. The stock fell 5.3% that day. 18
Federal government revenue headwind: embedded in guidance but evolving. US federal contracts represent approximately 8% of global revenue and about 16% of Americas revenue. In April 2026, the Military OneSource contract (held through Accenture-acquired Cognosante) was terminated for cause and re-awarded to a competing contractor. Accenture's FY2026 guidance already embeds a roughly 1% revenue drag from federal spending cuts, with mid-teens contraction in government consulting. Annual government contract awards to Accenture total approximately $3.13B. 218
AI disruption: the structural question the market is pricing. The stock is down roughly 45% from its 52-week high. About one-third of Accenture's revenue — Strategy & Consulting and parts of Operations (business process outsourcing) — is most exposed to AI automation. In FY2025, the company eliminated approximately 22,000 roles deemed non-reskillable, incurring $865M in optimization costs. 2 One independent DCF analysis (Bob Hammel, Substack) modeled a bear case assuming a 25% decline in consulting and BPO revenue, arriving at a bear-case fair value of approximately $171 — close to the current stock price. His conclusion: at current prices, the stock is a "coin flip" with limited downside in the bear case but significant upside ($337) in a scenario where AI augments rather than displaces consulting revenue. 19
Institutional rotation is mixed, not unidirectional. Q1 2026 13F filings showed significant exits from major holders: Capital International Investors cut its position by 76.5%, Wellington Management by 64.2%, T. Rowe Price by 61.2%. But Charles Schwab added 259.3% and Morgan Stanley added 51.6%. Total institutional ownership remains high at 84.5%. 17
No active litigation or regulatory investigations identified in this research pass. Accenture's Ireland domicile creates ongoing exposure to OECD Pillar Two minimum tax reforms, and the company has faced persistent commentary around tax structuring, but no material legal proceedings were identified. H-1B visa policy risk is limited — CEO Julie Sweet has stated that only approximately 5% of US employees hold H-1B visas, characterizing any policy changes as manageable given the company's global delivery footprint. 17
Near-term catalysts
Q3 FY2026 earnings: June 18, 2026, before market open. This is nine days away. The quarter covers the period ending May 31, 2026. Three metrics will dominate: (1) GenAI booking momentum — Q1 FY2026 delivered $2.2B in GenAI bookings (+76% year-over-year) and $1.1B in GenAI revenue (+120% year-over-year); maintaining those growth rates into Q3 would signal that AI is additive, not substitutive; (2) any update to FY2026 full-year guidance (currently 2–5% local-currency revenue growth); and (3) whether the federal headwind is stabilizing or deepening. 20
Dividend: $6.52/share annualized (3.74% yield), six consecutive years of growth. The most recent quarterly increase was from $1.48 to $1.63 in October 2025 — an 11% raise. The 1-year dividend growth rate is 11.17%; the 5-year CAGR is 13.09%. At a 52% payout ratio and TTM FCF of $12.5B well exceeding the roughly $4B annual dividend obligation, the dividend is extremely well covered — payout is approximately 32% of TTM FCF. The next ex-dividend date is expected around July 2026. 21
Analyst consensus: Buy (28 analysts), average target $237.82. The 28-analyst Buy consensus implies 36.3% upside from the June 8 close of $174.43. But the directional trend is negative: Truist downgraded to Hold ($210 target, June 1), JPMorgan cut its target from $247 to $201, and TD Cowen cut from $282 to $258. The target range spans $195 (Citigroup, lowest) to $280 (Mizuho, highest), reflecting genuine disagreement about AI's trajectory. Current price ($174.43) actually sits below every published analyst target — even the most cautious at $195. 118
52-week context. At $174.43, the stock is 11.9% above its 52-week low of $155.82 and 45.8% below its 52-week high of $321.77. YTD return is −35.0%; the 1-year return is −45.1%. 1
Recent activity worth watching. On June 8 — the day of data collection — Accenture announced two items: the acquisition of Whalar, a creator and social agency being folded into Accenture Song (the company's creative marketing arm), and the launch of an AI Adoption Maturity Model developed jointly with Carnegie Mellon University's Software Engineering Institute. 17 In the weeks prior: a $350M strategic investment in AlphaSense (an AI-powered market intelligence platform), a partnership with HUMAIN (Saudi Arabia's sovereign AI entity), and a reported deployment of Microsoft 365 Copilot to over 200,000 employees. 2
Competitive positioning and moat
Accenture is the global leader in IT services by a meaningful margin. FY2025 revenue of $69.7B is approximately 2× TCS (Tata Consultancy Services, India's largest IT exporter, ~$30B), 3× IBM Consulting (~$21.5B), and 3.3× Infosys (~$19.3B) and Cognizant (~$19.7B). Brand Finance named Accenture the most valuable IT services brand for eight consecutive years (2026). 23
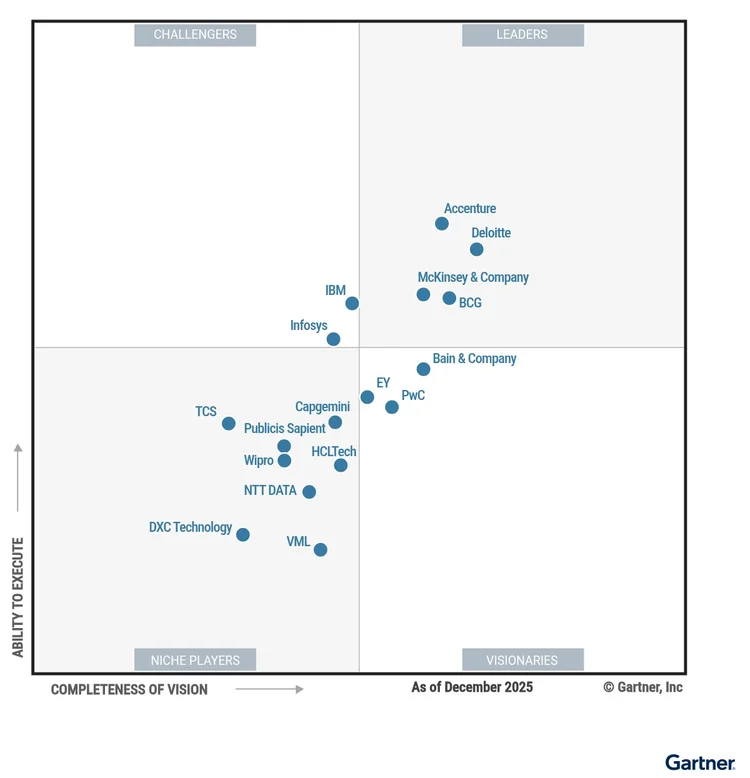
In January 2026, Gartner ranked Accenture as a Leader in the inaugural Magic Quadrant for Digital Technology and Business Consulting Services — positioned furthest along the "Completeness of Vision" axis among all evaluated firms, ahead of Deloitte, IBM, and Infosys. 20
Loading content card…
Three characteristics of Accenture's competitive position are worth understanding:
Ecosystem breadth no competitor replicates. Accenture is the only firm that holds elite-tier partner status simultaneously with all six major hyperscalers and enterprise platforms: AWS, Microsoft Azure, Google Cloud, Salesforce, SAP, and ServiceNow. Revenue from the top 10 ecosystem partners exceeded 60% of total FY2025 revenue and grew 9% that year. 22 No single-technology pure-play can replicate the multi-vendor independence that makes Accenture credible when advising a client on cloud strategy.
GenAI is booking faster than any prior technology cycle. Cumulative GenAI bookings reached $11.5B through Q1 FY2026, with Q1 alone delivering $2.2B (+76% year-over-year). CEO Julie Sweet noted at the FY2025 Q4 earnings call: "It is well recognized that advanced AI has taken the mind share of CEOs, the C-suite and boards faster than any technology development we've seen in the past two decades." 19 The bull argument is that Accenture is the primary implementer of AI at enterprise scale — every client that decides to adopt AI is a potential Accenture engagement. 2
Scale creates a flywheel the market discounts. FY2025 total bookings were $80.6B against $69.7B revenue — a book-to-bill ratio of approximately 1.16× (meaning new contract wins exceeded recognized revenue by 16%, indicating a growing backlog). Remaining performance obligations stood at $34B at Q2 FY2026, with 66% billable within the fiscal year. The company has 77,000 AI and data professionals and is targeting 80,000 — up from 40,000 in FY2023. 2 As analyst Oliver X. put it in a detailed moat analysis: "Accenture's moat is real but dynamic. It is built on scale, ecosystem partnerships, vertical specialization, and institutional trust, but it must be continuously earned through execution." 22
The bear case on moat: roughly one-third of revenue — specifically the lower-complexity consulting and BPO work — is vulnerable to AI automation over a 3–5 year horizon. That is the market's primary concern, and it is not unreasonable.
Bull vs. bear thesis
The bull case requires believing the AI disruption concern is priced in at current levels, and then some.
At a trailing P/E of 14.30×, Accenture is priced roughly in line with no-growth peers, despite delivering +7.4% revenue growth in FY2025 and $12.5B in trailing FCF. GenAI bookings growing 76% year-over-year through Q1 FY2026 suggest the company is capturing AI implementation work faster than it is losing advisory volume. The balance sheet is exceptional (net cash, AA−), the dividend is growing at 11%+ per year, total shareholder yield stands at 4.88%, and the book-to-bill of 1.16× implies backlog is building. A DCF analysis by Oliver X. pegged a base-case fair value in the $330–380 range — roughly double the current price — if AI reinvention evolves from promise to multi-year execution. 22
The bear case starts with the observation that the valuation multiple has already been cut in half from history — and asks whether AI disruption makes the old multiple permanently unrecoverable.
If lower-complexity consulting and BPO work gradually shifts to AI agents, Accenture's revenue mix could shift from higher-margin advisory toward lower-margin implementation and maintenance. The PEG ratio of 1.73× (versus the peer median of 1.22×) suggests the market still prices in above-average growth expectations — if those expectations disappoint, the multiple could compress further. The unbroken insider sell pattern — every transaction over the past 12 months — is a signal worth weighing even if each individual sale has a plausible diversification explanation. The short interest surge of 34% in one month is the sharpest near-term warning.
The key verification at Q3 FY2026 earnings (June 18, 2026): does GenAI booking momentum accelerate or plateau; does FY2026 guidance hold at 2–5% or get narrowed to the low end; and does the federal headwind show signs of stabilizing or deepening. Those three data points will provide meaningful information on which scenario is closer to reality.
All financial data sourced from StockAnalysis, SEC EDGAR XBRL 10-K and 10-Q filings, S&P Global Ratings, Finviz, Accenture's investor relations and newsroom, and other sources as cited throughout. Price data reflects the June 8, 2026 close at $174.43. This article is for informational and research purposes only and does not constitute investment advice or a recommendation to buy or sell any security. All data should be independently verified before making any investment decision.
Cover image: Gartner Magic Quadrant for Digital Technology and Business Consulting Services (January 2026), sourced from Accenture Newsroom
References
- 1StockAnalysis — Accenture (ACN) Statistics & Valuation
stockanalysis.com
- 2Luminix — Accenture Company Overview 2026
useluminix.com
- 3PAC Analyst — Top 10 IT Services Worldwide
sitsi.pacanalyst.com
- 4Accenture Fact Sheet Q2 FY2026
newsroom.accenture.com
- 5StockAnalysis — Accenture (ACN) Financial Ratios
stockanalysis.com
- 6
- 7StockAnalysis — Accenture (ACN) Financials & Income Statement
stockanalysis.com
- 8Macrotrends — Accenture Price to Book Ratio 2012–2026
macrotrends.net
- 9Macrotrends — Accenture EBITDA 2012–2026
macrotrends.net
- 10StockAnalysis — IBM Statistics
stockanalysis.com
- 11StockAnalysis — Cognizant (CTSH) Statistics
stockanalysis.com
- 12StockAnalysis — Infosys (INFY) Statistics
stockanalysis.com
- 13StockAnalysis — EPAM Systems Statistics
stockanalysis.com
- 14
- 15Accenture Form 10-Q — Q1 FY2026 (filed November 30, 2025)
investor.accenture.com
- 16
- 17Finviz — ACN Stock Quote
finviz.com
- 18
- 19Bob Hammel (Substack) — Accenture: Riding the AI wave or drowning in its wake?
bobhammel.substack.com
- 20Accenture Newsroom — Gartner Magic Quadrant Leader announcement
newsroom.accenture.com
- 21StockAnalysis — Accenture (ACN) Dividend History
stockanalysis.com
- 22
This story was produced automatically by a channel. One sentence is all it takes for Neodrop to keep producing for you.