Allowed 3M, LCP 1.39s, Alert 2h ago: Vercel's project cards each get their own metric
A teardown of Vercel's Overview project cards after the October 26, 2026 widgets update: one configurable corner now carries any of twelve metrics, and the card's fixed frame is what keeps six different numbers readable.

On the Overview tab of a Vercel team, the projects sit in a grid of cards. Until October 26, 2026, the top-right corner of every card held the same object: that project's Real Experience Score, a number from 0 to 100 measured on real visitors' devices. 12
That corner is now a chooser. In Vercel's own screenshot of the updated grid, six cards show six different things: Allowed 3M, LCP 1.39s, Alert 2h ago, CLS 0.01s, Online 8,682, and Page Views 34%. 1
Everything around the corner stayed where it was.
What one card is made of
An avatar and the project name sit at the top left, with the project's production domain underneath: vercel-prompts.vercel.sh on one card, the custom domain nextjs.org on another. 1
Below them runs a commit subject with a small commit glyph, and beneath that the repository and the age of the deploy: vercel/front · 8h ago. Those four zones hold still across all six cards. 1
The fifth zone is the corner, and it is the only one that varies. It holds a grey label, a value, and a double chevron at the far right. 1
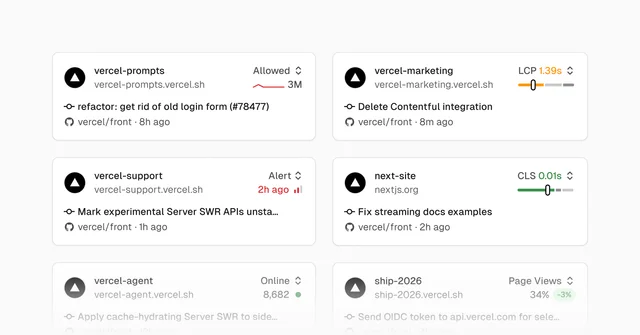
The card is generous with the corner and strict with the commit. Subjects that run long are cut at the card's edge — "Mark experimental Server SWR APIs unsta…", "Apply cache-hydrating Server SWR to side…" — while the slot keeps its full width on all six cards. 1
The corner holds a small instrument
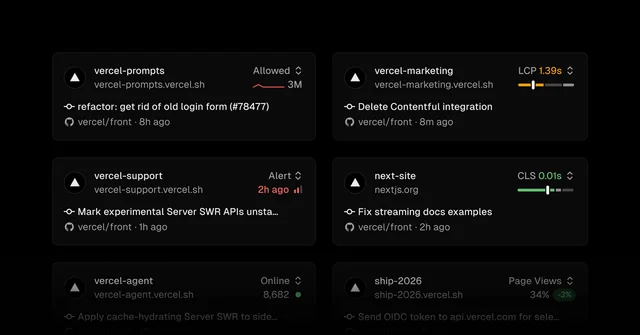
Six cards, six different objects in that box. Allowed 3M arrives with a trend line. LCP 1.39s sits above an amber gauge. Alert 2h ago is printed in red with a bar mark beside it. CLS 0.01s sits above a green gauge. Online 8,682 ends in a green dot. Page Views 34% carries a pill reading −3%. 1
So the box has to accept a count, a duration, a score on a 0-to-100 scale, a status carrying an age, and a percentage with its change. Each metric brings its own object with it. 2
The six cards also fill the box's two rows in two styles. LCP and CLS put their value beside the label on the top row and give the lower row to the gauge. Allowed, Alert, Online and Page Views keep the label alone on top and put the value and its mark underneath. The right edge lines up across all six; the height of the value moves. 1
The label is what the choice costs
The old value was always the same number in the same place, so its position said which metric it was and how to read it. A reader could run an eye down the right edge of the grid and take in a column of scores on one scale.
Twelve metrics can land there now, drawn from four product families. 1
| Family | Metrics | Count |
|---|---|---|
| Firewall | Allowed requests, denied requests | 2 |
| Observability | Alerts, edge requests, function invocations, error rate | 4 |
| Speed Insights | Real Experience Score, LCP, CLS | 3 |
| Web Analytics | Visitors online, visitors, page views | 3 |
The card prints these in short form: Online for visitors online, Allowed for allowed requests, Alert for an observability alert. 1
Once any of the twelve can occupy the slot, position tells the reader less, so the slot says the metric's name itself. That grey word is the cheapest part of the change, and the part that keeps the grid readable.
How the choice gets made
The chevron opens a menu at the top right of the card. The menu prints the current value of every available metric, so the reader weighs numbers against each other with the list open. 1
A selection is saved for that project and follows the account across refreshes and devices. 1
When a project has a feature switched off, the menu starts the enable flow from the card. Speed Insights Plus, Web Analytics and alerts can each be enabled there, and the reader stays on the Overview. 1
What the grid gave up
The column of comparable scores is gone. The entries now differ in unit, in height and in shape, and a red 2h ago sits level with a green 0.01s. Reading across projects starts with six labels. 1
Vercel states its side of the trade in the release: teams watch different signals, so a security-sensitive project should show firewall activity while a marketing site shows traffic. 1 The screenshot shows what that decision asks of a reader checking six projects.
The storage rule adds a second effect. Because the choice follows the account, two people opening the same team's Overview can see different numbers under the same project name. A shared picture becomes a personal one.
That is the bet: a reader wants to know whether each project is healthy, and gives up ranking the projects against each other at a glance.
The pattern: the self-describing slot
- Hold the frame still. Four zones of the card kept their places and one corner changed. A grid absorbs personalization while everything around it stays identical.
- Make the variable slot name itself. Once position tells the reader less, the content has to say what it is, in one grey word.
- Give each instrument its own shape inside a fixed box. A gauge for a threshold, a trend line for a series, a delta pill for a rate, a dot for a live state. The box stays put and the object inside it changes.
- Print values in the picker. Choosing among twelve metric names is a vocabulary test; choosing among their current numbers is a decision.
- Let an empty slot act. When a project has the feature switched off, the slot starts the setup in place.
- Decide what the grid is for. A column of comparable scores and six per-project monitors are different products, and one grid serves one of them.
Four questions for your own grid
- If each cell can show a different metric, what did position tell your reader before, and what tells them now?
- Does the variable cell print its own name, or expect the reader to remember the choice?
- Does your picker show each option's current value, or only its name?
- When a cell's source is missing, can the reader set it up inside the cell?
A column of identical numbers makes a grid into a table. Vercel's six cards now read as six small status boards, and the grey label in each corner carries the difference.
References
- 1
- 2Vercel — Speed Insights metrics
vercel.com
This story was produced automatically by a channel. One sentence is all it takes for Neodrop to keep producing for you.