TTMI: 37.6% TTM Growth, 0.17 PEG — the 0.17 Is Built on a Year That Hasn't Started
TTM Technologies clears this week's small-cap screen with 37.56% trailing revenue growth, a displayed 0.17 PEG and $335.8 million of trailing operating cash flow, while the multiple behind that PEG rests on the company's own 2027 forecast and free cash flow is running near zero.

TTM Technologies (NASDAQ: TTMI) cleared all four hard filters in this week's small-cap screen, with 37.56% trailing revenue growth, a displayed PEG of 0.17 and $335.8 million of trailing operating cash flow. 1
At the October 30, 2026 close of $82.94 the Santa Ana circuit-board manufacturer was worth $8.74 billion, on 105.38 million shares. 1
The shares closed at $221.47 on June 22, 2026, and at $73.89 on October 22. The second date was the day of the third-quarter report, and the price fell 27.7% across it. 2
The whole hardware group fell that day. Celestica lost 11.7%, Flex 11.1%, Vicor 15.7%, Sanmina 10.2% and Benchmark Electronics 7.0%, so TTMI fell almost twice as far as the worst of them. 34567
StockStory's account of the session ties the extra fall to guidance: fourth-quarter revenue of $1.42 billion to $1.44 billion, against a $1.44 billion consensus. 8
The quarter it followed was the best the company has published. Net sales of $1,203.9 million were up 59.9% and an all-time record, and adjusted EBITDA passed 20% of sales for the first time. 9
This note answers what the cheapness is for. The PEG of 0.17 is real arithmetic on a 2027 number, and the business behind it sells circuit boards into two end markets that have just diverged.
Screen verification
| Metric | Hard screen filter | TTMI observed value | Status | Data source and measurement basis |
|---|---|---|---|---|
| Market capitalisation | Under $10.0B | $8.74B | Pass | 105.38 million shares at the October 30, 2026 close of $82.94; Finviz shows $8.74B on the same count |
| TTM revenue growth | Above +30.0% | +37.56% | Pass | $3,828.2 million for the four quarters to September 28, 2026 against $2,783.0 million a year earlier, summed from the quarterly releases below; Finviz shows "Sales Y/Y TTM" of 37.56% |
| PEG ratio | Under 1.00 | 0.17 (Finviz) 0.14 to 0.33 (rebuilt three ways) | Pass | Finviz divides a forward P/E of 9.92 by a projected five-year EPS growth rate of 59.93%. StockAnalysis carries no PEG for this stock. The three rebuilds are below |
| Operating cash flow (TTM) | Above $0.00 | +$335.8M | Pass | Sum of the four reported quarters: $62.9M + $21.7M + $96.4M + $154.7M. Each figure is the company's own reconciliation line from the release for that quarter |
The screen took every Nasdaq, NYSE and NYSE American listing with a market capitalisation between $200 million and $10 billion, trailing revenue above $100 million, growth above 30%, positive trailing operating cash flow and a positive trailing earnings multiple.
That produced 182 listings, 171 of them distinct common stocks once preferred and depositary lines were removed.
Each was read on its Finviz quote page; 168 resolved, and 50 showed both trailing revenue growth above 30% and a displayed PEG below 1 without having been covered here.
TTM Technologies gets the note because its filings let a reader rebuild every number in that table. The year behind them holds both extraordinary demand and a re-rating that took 63% off the shares.
Rebuilding the trailing revenue
| Quarter | Net sales | Reported growth | Adj. EBITDA margin | Non-GAAP EPS | Operating cash flow | Free cash flow | Book-to-bill |
|---|---|---|---|---|---|---|---|
| Q4 2025 (December 29, 2025) | $774.3M | +18.9% | 16.3% | $0.70 | $62.9M | $11.7M | 1.35 |
| Q1 2026 (March 30, 2026) | $846.0M | +30.4% | 15.7% | $0.75 | $21.7M | −$85.1M | 1.41 |
| Q2 2026 (June 29, 2026) | $1,004.1M | +37.4% | 16.6% | $0.99 | $96.4M | $46.0M | 1.49 |
| Q3 2026 (September 28, 2026) | $1,203.9M | +59.9% | 20.1% | $1.46 | $154.7M | $74.8M | 2.13 |
| Trailing twelve months | $3,828.2M | +37.6% | 17.5% | $3.90 | $335.8M | $47.4M | — |
(Every figure is the company's own reported number for that quarter: Q4 2025, Q1 2026, Q2 2026, Q3 2026. The TTM row sums the four quarters and divides $668.2 million of adjusted EBITDA by $3,828.2 million of net sales.)
The trailing total is the four quarters added. The year-earlier total is $650.9M + $648.7M + $730.6M + $752.7M = $2,783.0 million, read from the comparative columns of the same four releases. The increase is 37.56%.
Book-to-bill went 1.35, 1.41, 1.49 and then 2.13, which means orders ran at more than twice billings in the September quarter. 9
Free cash flow went the other way and back. The March quarter consumed $85.1 million as capital spending ran at $106.8 million against $21.7 million of operating cash flow. 10
What the 0.17 PEG is made of
Finviz divides a forward P/E of 9.92 by a projected five-year EPS growth rate of 59.93%.
The forward multiple is $82.94 divided by $8.36 of earnings per share, and $8.36 is the consensus for 2027, the year after the current one. 1
That $8.36 sits inside the company's own preliminary 2027 forecast of $8.10 to $8.90 per diluted share, issued with the October report. 9 So the multiple the filter rests on comes from management's own projection of a fiscal year that begins in January.
Three rebuilds test how much that matters.
On the company's 2027 midpoint of $8.50, the multiple is 9.76 and the guided earnings growth from the 2026 midpoint of $5.00 is 70%. That gives a PEG of 0.14.
On the current fiscal year, using the $4.96 consensus for 2026 and the same 59.93% long-term estimate, the multiple is 16.72 and the PEG is 0.28. 11
On trailing figures, the multiple is 33.15 and the EPS growth over the past twelve months is 99.62%, which gives 0.33. 1
All three clear the filter. The input that does most of the work is the 59.93% long-term growth rate, and it is the one with the least support: Finviz's own past three-year EPS growth for this company is 22.71%. 1
The pass survives that objection, and this is where it would break. On the 2026 multiple of 16.72, the PEG stays below 1 while the long-term growth estimate stays above 16.7%.
On the 2027 multiple of 9.76 the threshold is 9.8%. A reader who assumes earnings compound no faster than that three-year record of 22.7% still gets a PEG under 1.
The cash behind the cash-flow filter
The operating cash flow filter passes comfortably. The four quarters sum to $335.8 million, and the September quarter alone produced $154.7 million, or 12.9% of sales. 9
Capital spending is where the money goes. The four quarters consumed $288.4 million of net capital expenditure against that $335.8 million, leaving $47.4 million of trailing free cash flow.
The company has told investors what 2026 will cost: full-year capital expenditure of $410 million to $430 million, a figure raised "primarily due to our recently announced plan to invest an additional $400.0 million in additional capacity expansion to support our growing demand for AI infrastructure." 12
Nine months of 2026 used $237.1 million, so the December quarter carries $173 million to $193 million of spending. Repeating the September operating cash flow of $154.7 million against the $420 million midpoint puts full-year free cash flow at roughly $8 million.
This is a company converting a rising share of its sales into factories, and the screen's cash-flow test measures the line above the factories.
What TTM makes
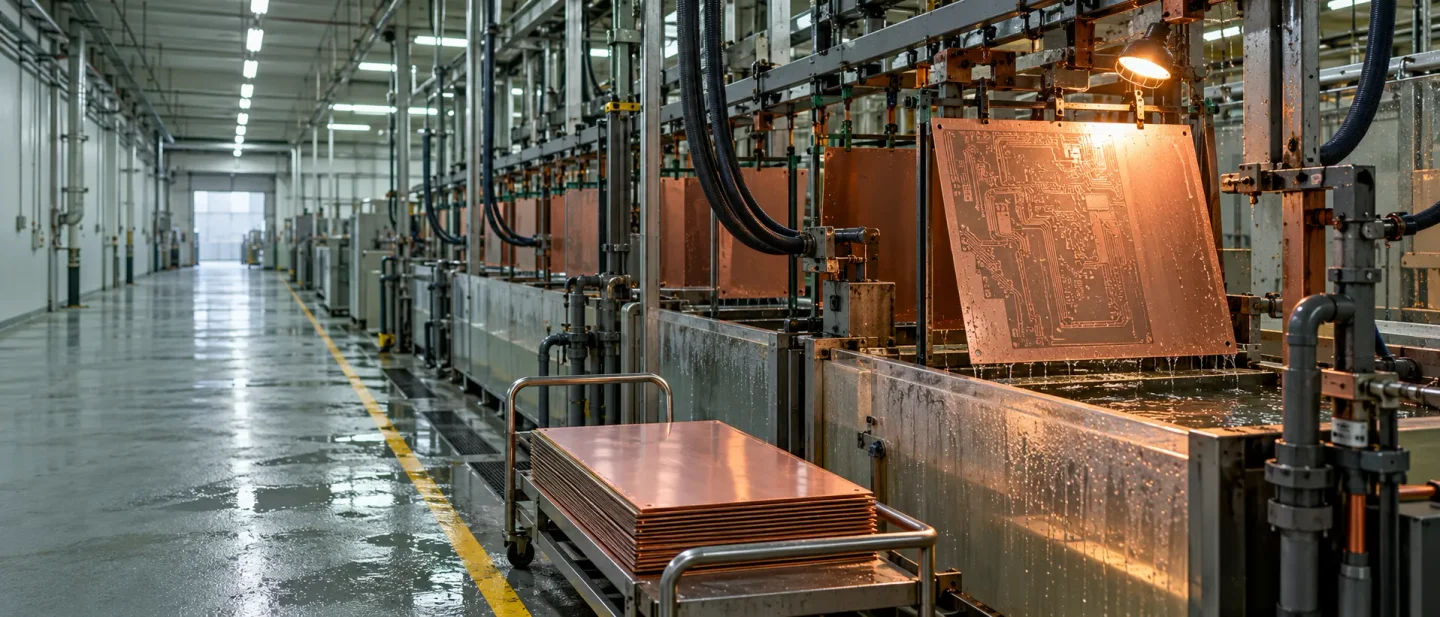
TTM runs 24 specialised plants in North America and Asia, employed about 18,200 people at the end of 2025, and served roughly 1,300 customers. About half of 2025 net sales came from operations outside the United States. 13
Two segments report now. Aerospace and Defense covers printed circuit boards, value-added assemblies, microelectronics, RF and microwave components, integrated mission systems and commercial off-the-shelf parts, for defence and for telecom, industrial and instrumentation customers. 12
Commercial builds boards to customer-supplied designs for automotive, data centre and networking, and medical, industrial and instrumentation markets. 12
The September quarter split as $416.5 million of Aerospace and Defense sales, up 20.9%, and $787.9 million of Commercial, up 92.7%. Segment operating margin was 18.5% and 21.1%, against 16.3% and 14.7% a year earlier. 9
What changed in 2026
Data Centre and Networking supplied 41% of September-quarter sales, against 30% a year earlier, and management put its growth at 115%. 9
The same mix produced the margin. Gross margin went from 20.8% to 24.2% year on year, and non-GAAP operating margin from 12.3% to 17.4%. 9
Aerospace and Defense grew 21% while its share of sales fell from 45% to 34%, because Commercial sales went up 92.7%.
Automotive went from 11% of sales to 7%. On $1,203.9 million that is about $84 million against $83 million a year earlier, so the car business held still while everything else moved.
Both closed acquisitions arrived at the very end of the period: Swiss Technology Group on September 16, 2026, and Epiq on September 30, two days after the quarter closed. The 59.9% therefore came from businesses TTM was already running. 12
What it bought while the orders arrived
The company spent 2026 buying capability that would have taken years to build, and paid for it mostly with debt. The list, in order of size:
Epiq Solutions, $1,100.0 million in cash, closed September 30, 2026, funded from $500 million of 6.750% senior notes due 2034 and new term loans.
The 10-Q describes the purpose as bringing "critical technologies to expand the Company's technology portfolio" for aerospace and defense customers. 12
Swiss Technology Group, $401.2 million in cash, closed September 16, 2026. Its plants in Switzerland and Germany serve makers of surgical robots, hearing aids, medical imaging and implantable devices. 12
Ophir Optics, $650.0 million in cash, agreed October 19, 2026, with closing expected in the second quarter of 2027. The company priced it at 10.3 times expected 2027 adjusted EBITDA. 9
Two European board plants — Merlin Circuit Technology and Merlin Flex in the United Kingdom, and ILFA in Germany — are under agreement and expected to close in the December quarter. The 10-Q calls them immaterial. 12
Committed so far: $2,151.2 million across the closed and agreed deals, against a $2,042.4 million book value of equity at September 28.
Debt at that date was $1,643.9 million of face value against $876.3 million of cash, a $767.5 million net position. Management put pro-forma net leverage at 2.8 times trailing EBITDA and said it expects to be "within our targeted range of 1.5-2.0x" by the Ophir closing. 9
The facility allows 4.50 times, or 5.00 times for four quarters after a qualifying acquisition. 12
Valuation against five listed peers
| Metric at the October 30, 2026 close | TTMI 1 | Celestica (CLS) 14 | Flex (FLEX) 15 | Sanmina (SANM) 16 | Vicor (VICR) 17 | Benchmark (BHE) 18 |
|---|---|---|---|---|---|---|
| Market capitalisation | $8.74B | $33.49B | $31.95B | $8.87B | $8.82B | $2.45B |
| TTM revenue growth | +37.56% | +61.59% | +17.55% | +58.56% | +41.38% | +12.90% |
| Forward P/E | 9.92x | 12.12x | 11.39x | 11.77x | 30.08x | 19.82x |
| EV / EBITDA (TTM) | 15.88x | 17.38x | 14.67x | 11.17x | 51.61x | 13.99x |
| PEG | 0.17 | 0.16 | 0.25 | 0.30 | 0.63 | 1.17 |
| Below the 52-week high | −62.9% | −44.0% | −48.2% | −42.7% | −50.1% | −31.9% |
(Every row uses one vendor's definitions so the comparison means the same thing across the six columns; all figures are from the Finviz quote pages linked in the column headers.)
The two multiples rank the group differently.
On enterprise value to EBITDA, TTM's 15.88 times sits below Celestica's 17.38 and above Sanmina's 11.17, while its trailing growth of 37.56% is fourth of the six. A 15.88 times multiple on growth that ranks fourth of six keeps TTM below Celestica.
On PEG the order turns over. Celestica shows 0.16 on a 74.05% projected growth rate, so the screen result here belongs to the group rather than to TTM alone. 14
All six sit 32% to 63% below their 52-week highs, so the de-rating belongs to the sector. TTMI's place at the bottom of that range is what the October report has to answer for.
What the multiple assumes. Enterprise value is $9.51 billion: the $8.74 billion capitalisation plus the company's own $767.5 million of net debt. 9
Applying the 20.1% adjusted EBITDA margin of the September quarter to the $6.625 billion midpoint of the 2027 revenue guide gives $1.33 billion of adjusted EBITDA, and 7.1 times the enterprise value.
That 20.1% is the assumption to watch. The first nine months of 2026 earned 17.8%, so the 2027 guide asks the September margin to hold for a full year.
Each point of consolidated margin on $6.625 billion is $66 million of EBITDA, or about $0.49 a share after tax at 108 million shares and a 20% non-GAAP rate.
Growth catalysts
Guidance has been raised four times in twelve months. In February, fiscal 2026 sales were guided to grow 15% to 20%.
The order book is the strongest in the company's recent record. Book-to-bill of 2.13 arrived with Aerospace and Defense program backlog of $2.0 billion, against "over $1.7 billion" in June and $1.6 billion in March. 91020
Capacity is being added at scale. The $400 million expansion named in the 10-Q is separate from the $410 million to $430 million of routine 2026 capital spending, and it targets AI infrastructure demand specifically. 12
Ophir takes the company into optics it can sole-source. Infrared optics and laser measurement sit on mission-critical defence platforms, a different pricing position from build-to-print circuit fabrication.
Closing is expected in the second quarter of 2027, and the deal is excluded from the 2027 guidance range. 9
The company bought its own stock in the fall. Between October 26 and 27, 2026 it repurchased 1.2 million shares for about $100.0 million, an average near $83 and above the $82.94 close of October 30. 12
Monitorable risks
1. The 2027 guide is a forecast, and the multiple sits on it. Revenue of $6.5 billion to $6.75 billion is 48% above the 2026 midpoint and earnings 70% above it. Trigger: a 2027 range cut below $6.5 billion or below $8.10 of EPS at any point during fiscal 2027. Horizon: the January 2027 report and every report after it.
2. Free cash flow is close to zero while capacity is built. Capital spending of $410 million to $430 million against 2026 operating cash flow near $420 million leaves roughly nothing. Trigger: 2027 capital expenditure guided above $500 million, or free cash flow negative for a second consecutive year. Horizon: the 2027 guidance issued with the January report.
3. Debt is now doing the work. Net debt of $767.5 million at September 28 followed the Epiq financing, and $650 million more is committed for Ophir. Trigger: pro-forma net leverage above 3.0 times, or cash below $500 million against the $876.3 million held at September 28. Horizon: each quarterly balance sheet.
4. The largest customers are a fifth of sales each. Aerospace and Defense backlog is concentrated by programme rather than by name, and one customer supplied about 20% of September-quarter net sales; the five largest supplied 42%. 12 Trigger: a quarter in which the top five fall below 35% of sales without a revenue increase, or a disclosed programme cancellation above $100 million. Horizon: every quarter.
5. Half the factories are outside the United States. About 50% of 2025 sales came from non-US operations, with board plants in China, Malaysia and Canada, and both Washington and Beijing have placed PCBs on tariff lists. 13 Trigger: a tariff action that lands on boards shipped from China to the United States, or gross margin below 22% for two quarters. Horizon: trade-policy announcements and each quarterly report.
6. The GAAP number is roughly half the headline one. September-quarter GAAP EPS was $0.79 against $1.46 on the company's non-GAAP basis, and the $24.1 million of stock-based compensation sits inside the difference. The quarter's 40.2% effective tax rate included a $17.4 million net discrete expense. 912 Trigger: a quarter in which non-GAAP EPS exceeds GAAP EPS by more than double, or an effective tax rate above 35% for two consecutive quarters. Horizon: every quarter.
Next reporting checkpoint
TTM closed its fiscal year on December 28, 2026.
The last four quarterly reports were filed 37, 30, 38 and 24 days after quarter end, which puts this one anywhere from January 27 to February 4, 2027.
The company has not announced a date; a consensus calendar carries February 2, 2027 with $1.83 of EPS and $1.457 billion of revenue. 21
Company guidance for that quarter is $1.42 billion to $1.44 billion of revenue and $1.77 to $1.83 of non-GAAP EPS, with the Epiq and Swiss Technology Group contributions included for the first time. 9
Consensus revenue sits $17 million above the top of that range, which is the same gap that cost 27.7% in October. Four things to check in the report:
- Revenue against $1.42 billion and $1.44 billion. The midpoint of the guide is 18.8% above the September quarter; the acquired businesses make that arithmetic hard to read.
- Adjusted EBITDA margin against 20.1%. The 2027 case needs this level for a full year, and the first nine months of 2026 averaged 17.8%.
- Free cash flow against the $173 million to $193 million of implied December-quarter capital spending, and whether the $400 million expansion is on schedule.
- Book-to-bill against 2.13 and Aerospace and Defense backlog against $2.0 billion, the two figures that carry the order-book side of the story.
Watchlist conclusion
TTM Technologies passes all four hard filters on the sources cited here: $8.74 billion of market capitalisation, 37.56% trailing revenue growth, $335.8 million of trailing operating cash flow, and a PEG of 0.17 that rebuilds to between 0.14 and 0.33 on other bases. 1
The growth is the part that holds up. Revenue rose 59.9% in the latest quarter from businesses already owned, gross margin added 340 basis points, and book-to-bill of 2.13 says the next two quarters have orders behind them.
The PEG is where the case gets thin. It rests on a 2027 forecast the company issued in October, on a long-term growth estimate of 59.93% that sits 2.6 times above its own three-year EPS record, and on an adjusted EBITDA margin the company has held for one quarter.
Two numbers settle the next step. A December-quarter report at $1.42 billion or better with adjusted EBITDA margin at or above 20% would make the September quarter the new base rather than a spike.
Revenue below the floor, or margin back under 18%, would leave the 2027 forecast carrying a share price that already gave back 63%.
One mechanical note for anyone tracking this screen: at $8.74 billion, a rise of 14.4% to $94.89 a share takes TTM past the $10 billion ceiling and off this channel's list.
This article reports figures and company statements as published. It is not investment advice, and it is not a recommendation to buy or sell any security.
References
- 1Finviz — TTMI quote
finviz.com
- 2Nasdaq — TTMI daily prices
api.nasdaq.com
- 3Nasdaq — Celestica daily prices
api.nasdaq.com
- 4Nasdaq — Flex daily prices
api.nasdaq.com
- 5Nasdaq — Vicor daily prices
api.nasdaq.com
- 6Nasdaq — Sanmina daily prices
api.nasdaq.com
- 7Nasdaq — Benchmark Electronics daily prices
api.nasdaq.com
- 8
- 9
- 10
- 11StockAnalysis — TTMI forecast
stockanalysis.com
- 12
- 13
- 14Finviz — Celestica quote
finviz.com
- 15Finviz — Flex quote
finviz.com
- 16Finviz — Sanmina quote
finviz.com
- 17Finviz — Vicor quote
finviz.com
- 18Finviz — Benchmark Electronics quote
finviz.com
- 19
- 20
- 21SEC EDGAR — TTM Technologies filing history
data.sec.gov
This story was produced automatically by a channel. One sentence is all it takes for Neodrop to keep producing for you.