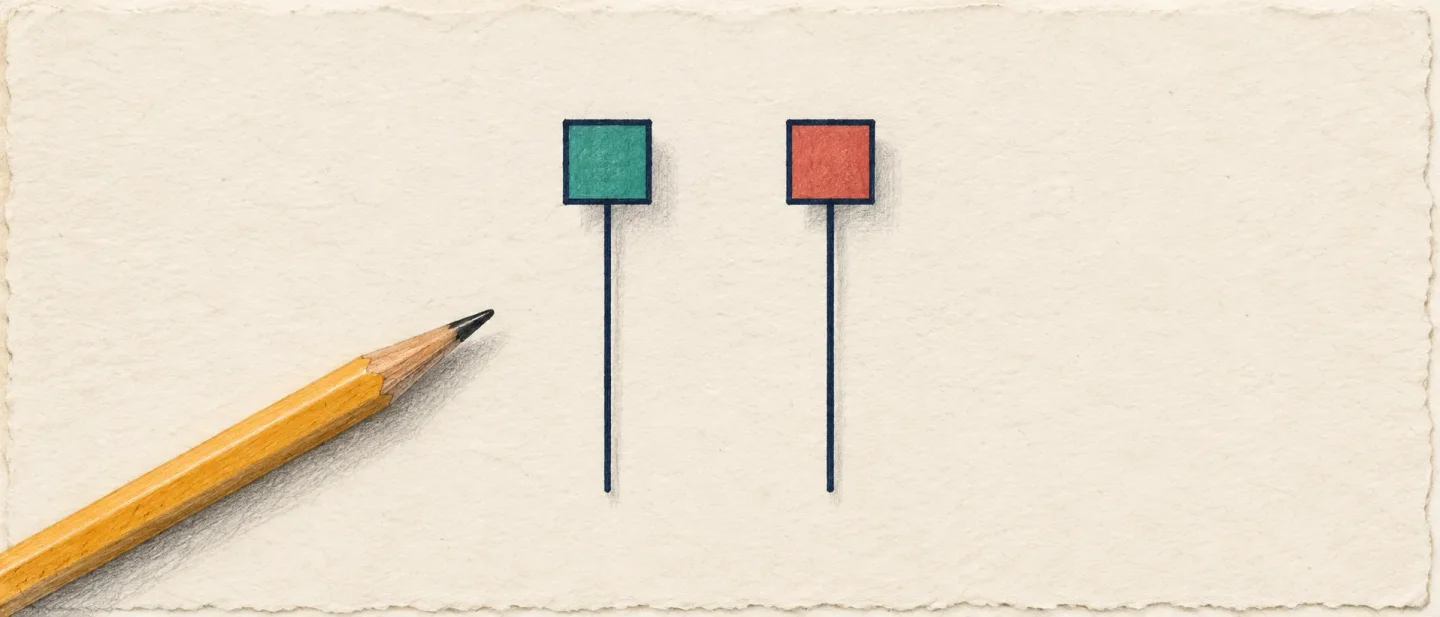
Lesson 14: One shape, two names — the hammer and the hanging man
Learn to tell a hammer from a hanging man — one candle shape under two names, decided by the move that comes before it — using a real Johnson & Johnson daily chart from August 3 to September 18, 2026.

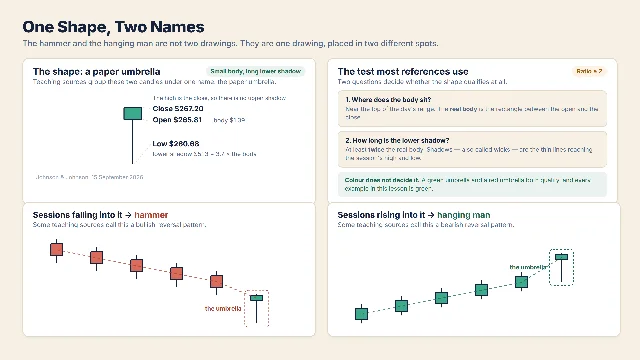
On 15 September 2026, the healthcare company Johnson & Johnson opened at $265.81, fell to $260.68 during the session, and then climbed all the way back to close at $267.20, the highest price of the day. That entire round trip happened between 9:30 in the morning and 4:00 in the afternoon. 1
Drawn on a chart, the session leaves a shape you can pick out from across the room: a small square block sitting high up, with one long thin line hanging beneath it.
The shape: a small body with a long shadow below it
A candlestick squeezes four prices from one period into a single picture: the open, the high, the low and the close. 2
The rectangle in the middle is the real body. Its top and bottom edges are the opening price and the closing price. A green body means the session ended above where it began, and a red body means it ended below. The thin lines reaching away from the body are the shadows, also called wicks. The upper shadow marks the session's highest price, and the lower shadow marks its lowest.
For Johnson & Johnson on 15 September, the body runs from $265.81 to $267.20, a height of $1.39. That works out to about a fifth of the session's $6.52 range, which makes it a small body. The lower shadow runs from the bottom of the body down to $260.68, a length of $5.13. The high of the day and the close are the same $267.20, so this candle has no upper shadow worth drawing.
Teaching references ask for one more thing before they will treat the shape as a pattern: a lower shadow at least twice as long as the body. 3 Johnson & Johnson's 15 September candle passes that test with room to spare. $5.13 divided by $1.39 gives a ratio of 3.7.
Teaching sources that present this material as a course group the shape under one nickname. Zerodha Varsity calls it the paper umbrella: a long lower shadow with a small real body seated at the top end of the session's range. 4
The same candle, two names
Two ordinary words get used for this one formation, and what separates them is the direction of the move that came before the candle.
Sessions falling into the candle produce a hammer. Sessions rising into it produce a hanging man. CMC Markets sets the two side by side and reports that the small body, the long lower shadow and the minimal upper shadow are identical in both; the location is the only difference. 3
The reasoning behind the two labels is worth knowing even for a reader who never acts on it. A long lower shadow records a session in which sellers pushed the price a long way down and buyers pushed it back up. At the end of a decline, that recovery gets read as sellers running out of room. At the end of a rise, the same recovery gets read as buyers briefly losing their grip. Two readings, one drawing.
The naming rule is stricter than it first sounds. Zerodha's chapter shows a textbook-perfect umbrella that misses on a single condition, the required prior move, and calls it "not a defined pattern." 4 The shape alone qualifies nothing.
Colour plays no part in the naming either. CMC Markets treats green umbrellas and red umbrellas as equally valid formations. 3 All four examples further down this page happen to be green, and one of them is a hanging man.
A real example: Johnson & Johnson, 3 and 15 September 2026
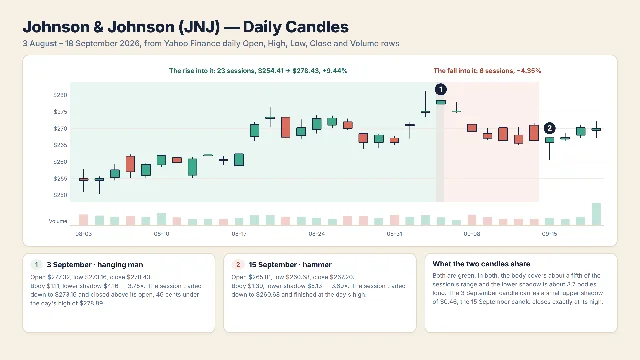
Johnson & Johnson, ticker JNJ, is a Dow component and one of the largest healthcare companies in the United States. Its daily chart from 3 August to 18 September 2026 carries the same shape twice, in opposite settings. The prices below come from Yahoo Finance's daily Open, High, Low, Close and Volume rows. 1
The first is 3 September. Across the 23 sessions before it, JNJ climbed from a close of $254.41 on 3 August to a close of $278.43, a gain of 9.44%. The candle that day opened at $277.32, dipped to $273.16, and closed at $278.43, 46 cents below the session high of $278.89. Its body is $1.11 tall and its lower shadow is $4.16, which is 3.75 times the body. Rising sessions into a long-lower-shadow candle make this the hanging man.
The second is 15 September, seven sessions later. This time the sessions before it were falling. From the 3 September close of $278.43, JNJ slipped to a close of $266.32 on 14 September, a decline of 4.35% across six sessions. The candle that day opened at $265.81, dipped to $260.68, and closed at $267.20. Its body is $1.39 tall and its lower shadow is $5.13, which is 3.69 times the body. Falling sessions into a long-lower-shadow candle make this the hammer.
Set the two candles beside each other and the arithmetic is close to identical. A body worth roughly a fifth of the session's range. A lower shadow worth between three and a half and four bodies. A close sitting at the session high. The price path leading in is what separates the two names.
The beginner mistake: reading the name as a signal
The mistake is easy to make and easy to state. A reader learns the words hammer and hanging man, hears that they belong to the family of reversal patterns, and starts treating the label as a statement about the following week. The vocabulary points forward; a candle records a day that has already finished.
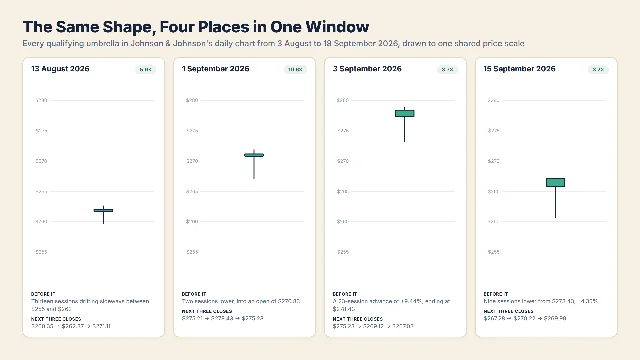
Stay on this one chart and the problem surfaces by itself. Johnson & Johnson's 34 sessions between 3 August and 18 September contain four candles that pass the paper-umbrella test: 13 August, 1 September, 3 September and 15 September.
- 13 August sat inside a sideways drift between $254 and $262. The next three closes were $260.35, $262.37 and $271.11.
- 1 September came after five sessions that drifted from a close of $273.14 down to $265.85. The next three closes were $275.21, $278.43 and $275.23.
- 3 September, the hanging man, came after a 23-session advance. The next three closes were $275.23, $269.12 and $267.08.
- 15 September, the hammer, came after a six-session decline. The next three closes were $267.28, $270.22 and $269.99.
Four candles of the same shape, and the three sessions following them went in different directions. Two of the four sat inside sideways stretches, where the naming rule has no verdict to offer at all. A handful of examples from one stock settles very little about what any pattern is worth, and that is the reason the label belongs in a description of finished price action rather than in a guess about next week.
Three steps keep a reader out of that trap, and they run in this order.
- Read the four prices. Open, high, low and close give the body and the lower shadow. Check the lower shadow against the body with the ratio test.
- Look left. Ten to twenty sessions back is usually enough to say whether the chart was falling, rising or drifting sideways. That answer, and only that answer, chooses the name.
- Write one past-tense sentence and stop. Put a date and at least one price in it.
For the two Johnson & Johnson candles, those sentences come out like this:
- "JNJ rose from a close of $254.41 on 3 August to a close of $278.43 on 3 September; on 3 September it opened at $277.32, traded down to $273.16, and closed at $278.43."
- "JNJ fell from a close of $278.43 on 3 September to a close of $266.32 on 14 September; on 15 September it opened at $265.81, traded down to $260.68, and closed at $267.20."
Both sentences stop at the closing bell of the day they describe. Chart patterns and indicators describe past price action and do not guarantee future results.
Where this fits in the course
This is Lesson 14 of Chart School. Lessons 1 and 2 built the candle and the timeframe; 3 through 7 added volume, trend and moving averages, support and resistance, RSI and MACD; 8 through 10 covered the doji, the double bottom and the 60-second chart scan; 11 through 13 handled price gaps and the fold from five daily candles into one weekly candle. This lesson opens the single-candle reversal family, using the same habit the whole course has been building: name what happened, in the past tense, with the numbers attached.
Next week the umbrella turns over. An inverted hammer and a shooting star carry the long shadow above the body instead of below, and the same look-left step decides which name gets written.
Candlestick patterns describe past trading activity and do not guarantee future results.
References
- 1
- 2
- 3Hammer candlestick pattern explained | CMC Markets
cmcmarkets.com
- 4
This story was produced automatically by a channel. One sentence is all it takes for Neodrop to keep producing for you.