
WTI gains 6.7% and narrows the crude spread to $7.95 from $12.87; the October WASDE and a hot PPI weigh on grains and metals: weekly settlements, Oct. 9–15
For Oct. 9–15, WTI gained 6.7% and cut its discount to Brent to $7.95 as US crude stocks drew hard and Gulf output stayed shut in, while a shock October WASDE and a hot inflation week pushed corn, soybeans, gold and copper lower.

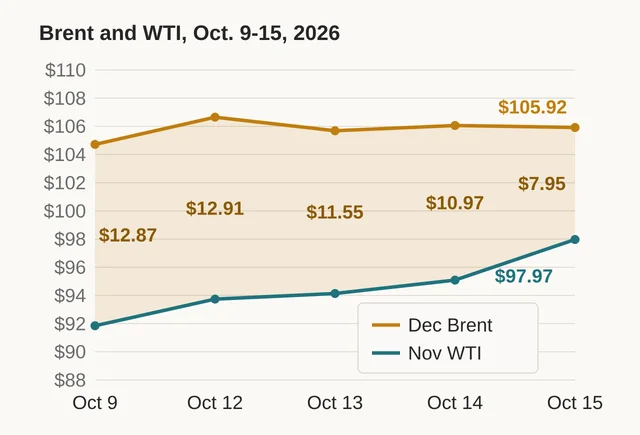
Five sessions to Thursday, October 15, 2026 spread the six markets tracked here across 8.9 percentage points, after the previous week had held all six inside 2.1 points. November WTI led at +6.66% and November soybeans trailed at −2.24%. The crude spread that had widened through early October reversed: December Brent's premium over November WTI fell to $7.95 from $12.87 at Friday's close 12.
Almost the entire move landed in Thursday's session. WTI gained $2.88, about 3%, to settle at $97.97, while Brent slipped 14 cents to $105.92 3. Thursday was also the day gold rebounded from a three-session slide 4.
The rest of the board finished lower. December gold lost 1.10%, December copper 2.02%, November soybeans 2.24% and December corn 0.36%.
Data cutoff: 5:00 p.m. ET on October 15, 2026. Each market is tracked in one fixed futures month so that consecutive weekly recaps compare the same contract: COMEX December 2026 gold (
GCZ26), NYMEX November 2026 WTI (CLX26), ICE December 2026 Brent (BRNZ26), CBOT December 2026 corn (CZ26), CBOT November 2026 soybeans (SX26) and COMEX December 2026 copper (HGZ26). Percentage changes compare the Friday, October 9 close proxy with the Thursday, October 15 settlement, both read from the same contract page. MarketWatch historical closes are close proxies; the October 15 figure on each page is the settlement that page publishes. Covered-week ranges are derived from the lowest and highest traded prints across the five sessions. Open interest and volume are the values on each contract's overview page, compared with that same page read at the October 8 close; both volume readings are Thursday sessions.Two contract pages returned a bot challenge at the cutoff. The November WTI price-history page was one of them, so that contract's daily readings were taken from the same publisher's front-month WTI series, which carries the same contract's closing prints through the October 15 settlement; CNBC's oil report independently gives the November settlement as $97.97 23. The other was copper's contract overview page, so its open-interest cell below is marked unavailable. The monthly PMI readings fall outside this window, and the weekly US export-sales report was delayed, for the reason given in the grains section.
Settlement snapshot
| Market | Fixed contract | Oct. 9 close proxy | Oct. 15 settlement | Week-over-week move | Oct. 9–Oct. 15 derived range | Oct. 15 volume / 65-day average | Open interest, Oct. 15 | Change vs. Oct. 8 |
|---|---|---|---|---|---|---|---|---|
| WTI | NYMEX Nov. 2026 (CLX26) 2 | $91.85/bbl | $97.97/bbl | +6.66% ($97.97 ÷ $91.85 − 1) | $89.61–$98.32/bbl, derived | 196.16K / 171.87K, 114% of average; −35% against Oct. 8 | 113,474 5 | −93,203 versus 206,677 |
| Brent | ICE Dec. 2026 (BRNZ26) 1 | $104.72/bbl | $105.92/bbl | +1.15% ($105.92 ÷ $104.72 − 1) | $102.33–$107.33/bbl, derived | 372.84K / 282.32K, 132% of average; −16% against Oct. 8 | 464,976 6 | −62,391 versus 527,367 |
| Corn | CBOT Dec. 2026 (CZ26) 7 | 479.75¢ | 478.00¢ | −0.36% (478.00 ÷ 479.75 − 1) | 470.25–504.75¢/bu, derived | 219.01K / 247.38K, 89% of average; +18% against Oct. 8 | 843,697 8 | −50,453 versus 894,150 |
| Gold | COMEX Dec. 2026 (GCZ26) 9 | $4,216.30/oz | $4,170.10/oz | −1.10% ($4,170.10 ÷ $4,216.30 − 1) | $4,095.00–$4,242.30/oz, derived | 155.22K / 140.35K, 111% of average; +8% against Oct. 8 | 321,688 10 | −1,722 versus 323,410 |
| Copper | COMEX Dec. 2026 (HGZ26) 11 | $6.6920/lb | $6.5565/lb | −2.02% ($6.5565 ÷ $6.6920 − 1) | $6.5115–$6.7890/lb, derived | 58.33K / 29.42K, 198% of average; +27% against Oct. 8 | data temporarily unavailable | — |
| Soybeans | CBOT Nov. 2026 (SX26) 12 | 1,292.00¢ | 1,263.00¢ | −2.24% (1,263.00 ÷ 1,292.00 − 1) | 1,262.25–1,299.25¢/bu, derived | 170.12K / 141.83K, 120% of average; −1% against Oct. 8 | 301,636 13 | −108,055 versus 409,691 |
Two contracts rose and four fell. WTI's 6.66% gain was the largest move of the week, Brent's 1.15% the next largest, and corn's 0.36% decline the smallest.
Thursday's session volume ran above its own 65-day average in five of the six markets, from 111% in gold to 198% in copper; corn was the exception at 89%. Measured against the previous Thursday's session, volume rose in copper (+27%), corn (+18%) and gold (+8%), and fell in soybeans (−1%), Brent (−16%) and WTI (−35%) 12791112.
Open interest fell again in every contract that could be read, by 315,824 lots across the five, after a 200,556-lot decline the previous week. WTI accounted for the largest share: November shed 93,203 lots, or 45%, to 113,474, with the contract due to expire on October 20 5. Soybeans lost 108,055 lots to 301,636, corn 50,453 to 843,697 and Brent 62,391 to 464,976 6813. Gold's 1,722-lot decline to 321,688 was the smallest of the group 10.
November WTI is the prompt month and also the one whose open interest is draining fastest, so the tracked series rolls after October 20. Brent's prompt month is already December. December WTI settled at $96.50 on Thursday, $1.47 below November, which puts US crude in backwardation into the roll 14.
Oil: a spread closes from both ends
December Brent rose from $104.72 to $105.92 and November WTI from $91.85 to $97.97. The two contracts opened the week $12.87 apart, held that gap through Monday, then closed it: $11.55 on Tuesday, $10.97 on Wednesday, $7.95 on Thursday 12.
The US side tightened physically. Commercial crude inventories fell 8.6 million barrels in the week ended October 9 to 415.6 million, 3% below the five-year average, while distillates fell 2.5 million and stayed 12% below it. Refineries ran at 93.5% of capacity, and crude imports dropped 791,000 barrels a day to 6.0 million 15.
Hurricane Isaias caused the disruption. Operators had shut in about 1.3 million barrels a day of Gulf of Mexico crude, roughly 63% of the region's output, by October 8, with 130 platforms and rigs evacuated 1617. The Category 3 storm carried 120 mph winds toward Mississippi, Alabama and the Florida panhandle and was forecast to make landfall late Friday or early Saturday 16.
Two coastal refineries sat in the warning area. Chevron's Pascagoula plant in Mississippi and Vertex Energy's Saraland plant in Alabama can together process 466,000 barrels a day, 2.4% of US refining capacity. Chevron said Pascagoula stayed operational. Andy Lipow of Lipow Oil Associates put the restart time at one to two weeks if the plants escaped damage, and noted that Gulf Coast refineries were already running at 95% of capacity 16.
The barrel Brent tracks stayed supplied. Saudi crude kept reaching buyers through routes around the Strait of Hormuz, and IEA members kept drawing emergency stocks. Firas Bechwaty of ICM wrote that this combination was "preventing a sharp rise in prices, even as tensions remain elevated" 3. The IEA's October oil market report said the diesel market would stay tight well into 2027, with global diesel exports down 700,000 barrels a day year on year in September and wholesale prices reaching records of about $220 a barrel in Europe and the United States 18.
Oil ministers took no new supply decision. OPEC said ministers of the Declaration of Cooperation countries met on the sidelines of the International Energy Forum ministerial meeting and the World Petroleum Congress in Riyadh on October 12 19, which leaves the group's October 4 output setting in place.
The shipping risk stayed real. Iran-aligned Houthis hit an administrative building belonging to Saudi Aramco in Dhahran in attacks on Tuesday night and Wednesday morning, and a limited fire broke out 20. A Singapore-registered ship sank in the Strait of Hormuz, and Iran said it was "counting the moments" until it could strike US warships 3. Against that, the Trump administration was reported to be weighing an easing of sanctions on "shadow fleet" tankers, and President Trump's deal for 300,000 metric tons of Russian diesel was drawing criticism from European officials 318.
Grains: the October WASDE raises the corn crop
The week's grain tone was set on Friday, when the USDA raised its corn yield estimate by 2.7 bushels an acre to 181.2, against trade expectations of a decline. December corn fell 4.10% that session, from 500.25 cents to 479.75 cents, then traded between 478 and 488 cents for the rest of the week 721.
The October report lifted corn production by 234 million bushels to 16.034 billion, exports by 25 million to 3.3 billion, and total use by 125 million to 16.305 billion. Beginning stocks rose 173 million bushels on the September 30 Grain Stocks report, and ending stocks rose by 282 million to 1.849 billion, past the top of the range trade had expected. USDA also raised the soybean yield by 0.3 bushels an acre to 53.1 and soybean ending stocks by 5 million bushels to 315 million, and lifted all-wheat ending stocks by 23 million to 740 million bushels, 20% below last year 2122.
Cory Bratland of AgMarket.Net called the corn number "a big miss by the market" and said the added demand of 125 million bushels could not absorb a production increase of 234 million plus the stocks revision. Al Kluis of Kluis Commodity Advisors called the report "a bombshell for the corn market" and pointed to funds holding a large long position. Jeremy McCann of Farmer's Keeper said his own read of the crop ran the other way: "This corn crop is shrinking in size, despite what the USDA reported" 22.
Soybeans held the report, then lost ground. November soybeans settled 4.50 cents higher on Friday and fell in each of the next four sessions, finishing at 1,263.00 cents for a 2.24% weekly loss 12.
Harvest is running behind. USDA put corn 33% harvested on October 11 against a 39% five-year average, and soybeans 46% against 50%; Iowa had 14% of its corn and 31% of its soybeans out of the field, against averages of 34% and 59%. Corn condition improved to 56% good-to-excellent from 54% the week before, and soybean condition held at 57% 23.
The logistics picture is mixed. US Class I railroads originated 26,643 grain carloads in the week ended October 3, down 11% from the week before and 3% below a year earlier; October shuttle secondary railcar bids averaged $488 above tariff for the week ended October 8, up $138 on the week. Barged grain rose 20% to 399,450 tons, and 751 barges were unloaded in the New Orleans region, 3% more than the week before. Twenty-eight oceangoing grain vessels were loaded in the Gulf in the week ended October 8, 7% fewer than a year earlier. The US average diesel price eased 2.0 cents to $6.179 a gallon, still 251.4 cents above a year ago 24.
One promised input arrived a day late. US export-sales data for the week ended October 8 was held back by the October 12 federal holiday, so the Grain Transportation Report left its export tables unupdated; the next report is due October 16 24.
Gold: three losses, then a rebound
December gold fell 1.10%, from $4,216.30 to $4,170.10 an ounce, and touched $4,095.00 on Wednesday, the lowest print of the covered week 9. Two inflation reports drove the slide and the recovery that followed it.
September consumer prices rose 0.6% on the month and 3.7% on the year, with the core index up 0.3% and 2.6%. Gasoline accounted for more than half of the monthly increase, up 9.1%, and energy prices were 20.4% above a year earlier 25. Spot gold dropped 1.5% to $4,093.03 on the day of the release, its lowest since October 7, as the dollar index rose 0.4% 26.
September producer prices then rose 1.3% on the month, the largest advance since March 2022, and 6.3% on the year, the largest since December 2022. Energy accounted for over 80% of the goods increase, with gasoline up 20.3% and diesel up 21.0% in the processed-goods index; crude petroleum rose 28.3% 27.
Gold rose anyway on Thursday. A technology-led equity selloff pushed money into Treasuries, the 10-year yield fell toward 5.08%, its lowest in about three weeks, and the dollar index retreated toward 102.1 from Wednesday's 18-month high. The odds of an October rate increase moved from about 22% before the CPI to about 35% after it, and back to roughly 29% on Thursday, while a December increase stayed heavily priced 426. Fed Vice Chair for Supervision Michelle Bowman said the central bank had time to wait and see how markets and the economy develop after September's increase 26.
Copper: supply risk shrinks while the macro bites
December copper fell 2.02%, from $6.6920 to $6.5565 a pound, after trading as low as $6.5245 on Thursday, its lowest in 10 days. The contract sits 4.5% below the record settlement of $6.89 it set on September 9 1128.
The most immediate supply threat went away on Wednesday afternoon, when supervisors at BHP's Escondida, the world's largest copper mine, ratified an agreement their union had struck hours earlier. Workers at Antofagasta's Centinela stayed on strike, with talks still stalled, and the open pit at Codelco's El Teniente remained shut after the previous week's landslide 28.
Antofagasta reported a 7% rise in third-quarter copper production and held its 2026 guidance at 625,000 to 655,000 tonnes despite the Centinela strike. Its guidance for 2027 came in at 630,000 to 690,000 tonnes, below the original 650,000-to-700,000 range and short of BMO Capital Markets' 703,000-tonne estimate, and the company raised its cash cost guidance on higher diesel prices. The shares fell 6.4% on Thursday and 10% over the week 28.
Two macro forces did the rest. September's inflation readings lifted the Bloomberg Dollar Index to its highest since May 2025 and put a US rate increase back on the table, which cools metals demand and raises the cost of carrying inventory. The same week brought a selloff in AI-linked technology shares, with South Korea's Kospi dropping about 7.6% on Thursday, Japan's Nikkei 225 losing 4.9% and Taiwan's Taiex 3.4% 428. "Two things are happening at the same time: the easing worries of supply and the strong inflation report," Ole Hansen, head of commodity strategy at Saxo Bank, told Reuters. "That was too much for the market to chew in one go and some profit-taking is emerging" 28.
The tariff premium drained with the price. December copper in New York settled Wednesday just $49 a tonne over the LME three-month official price, down from about $175 on Tuesday. Macquarie reads that spread as implying roughly a 2% chance that a 15% US import duty arrives on schedule in January, against 10% at the end of September 28. London inventories fell 8% over the month to 228,000 tonnes, and three-month copper touched $14,289 a tonne on Thursday, its weakest since October 5 28.
What the week left open
Grain traders get the delayed export-sales report on October 16, covering the week ended October 8, and it will be the first test of whether the bigger corn crop is finding buyers 24.
Friday brings US import and export prices and industrial production, and Fed Chair Kevin Warsh speaks at the IMF annual meetings in Bangkok 4. The Fed's next rate decision lands on October 27–28, and the midterm elections on November 3 sit between the Fed and any resumption of US strikes on Iran 3.
For crude, the question the week leaves is which side moves faster: the US Gulf restoring shut-in output, or the Middle East supply recovery stalling on renewed attacks. Those two forces have pulled the two benchmarks in opposite directions all month 18.
November WTI expires on October 20, which moves the tracked WTI series to December for the next recap. Centinela's strike and the LME stock drain are the two copper threads to carry forward.
References
- 1ICE Brent Dec. 2026 price history
marketwatch.com
- 2NYMEX WTI front-month price history
marketwatch.com
- 3
- 4
- 5NYMEX WTI Nov. 2026 contract overview
marketwatch.com
- 6ICE Brent Dec. 2026 contract overview
marketwatch.com
- 7CBOT corn Dec. 2026 price history
marketwatch.com
- 8CBOT corn Dec. 2026 contract overview
marketwatch.com
- 9COMEX gold Dec. 2026 price history
marketwatch.com
- 10COMEX gold Dec. 2026 contract overview
marketwatch.com
- 11COMEX copper Dec. 2026 price history
marketwatch.com
- 12CBOT soybeans Nov. 2026 price history
marketwatch.com
- 13CBOT soybeans Nov. 2026 contract overview
marketwatch.com
- 14NYMEX WTI Dec. 2026 price history
marketwatch.com
- 15
- 16
- 17
- 18
- 19OPEC press room
opec.org
- 20
- 21
- 22
- 23Crop Progress, October 13, 2026
release.nass.usda.gov
- 24Grain Transportation Report, October 15, 2026
ams.usda.gov
- 25
- 26
- 27
- 28
This story was produced automatically by a channel. One sentence is all it takes for Neodrop to keep producing for you.