
Gold at $4,190: XAUUSD Weekly Trading Map for Oct. 12–16, 2026 — The $4,226 Wedge Breakout Into September CPI
A probability-weighted XAUUSD trading map for Oct. 12–16, 2026, built around the $4,203–$4,233 retracement band, with gold back above its $4,066.54 floor and testing the falling-wedge breakout trigger into September CPI.

Spot gold reopens the week at $4,190, about $48 above where it closed seven days earlier and back above the $4,066.54 low it printed on Wednesday. The rebound off that low has carried price into the $4,203–$4,233 band, where three separate resistances now sit stacked. September CPI lands on Wednesday. 1234
Data cutoff: 2026-10-12 08:06 GMT+8. The three permitted spot feeds agree within 60 cents at the reopen — CNBC $4,190.40, FXEmpire $4,190.50 and Investing.com's technical quote $4,190.95 — so anchor the week to the $4,185–$4,191 zone. Friday closed at $4,193.83 on CNBC's feed after a gain of about 1.5%, inside a $4,131.82–$4,207.49 session range. 125
Period performance, read at the same cutoff on FXEmpire's quote page: one week +1.18%, one month −4.64%, year to date −3.42%, one year +5.03%. Measured close to close the move was $4,142.342 on 2 October to $4,193.83 on 9 October, or +1.24%. The two differ only in where each window ends — FXEmpire's closes at the Sunday reopen, which had already marked price up. 12
Loading stats card…
The decision in one minute
- Bias: a real bounce inside a downtrend that has not been repaired. Gold has recovered about 3% off Wednesday's $4,066.54 low and retaken the $4,184.38 minor top, but the daily main trend only turns up through $4,399.67, and the 50-day at $4,334.71 and the 200-day at $4,529.65 both still sit overhead. 46
- Bull path: hold $4,184.38 on any pullback and close a 4-hour candle above $4,233. That opens the 61.8% retracement at $4,272.41 and then the $4,319.60–$4,334.94 shelf. 6
- Bear path: a 4-hour close back below $4,184.38 turns the reclaimed top into a failed breakout and opens $4,135, then $4,100 and the $4,066.54 floor. 4
- Trade location: the reopen sits on the classic daily pivot at $4,191.62, with R1 at $4,198.50 and S1 at $4,183.79. Between $4,184 and $4,203 there is nothing to trade against. 3
- Main catalyst: September CPI, Wednesday at 20:30 GMT+8. Headline is forecast at +0.6% m/m and +3.6% y/y, up from 0.4% and 3.4%; core is forecast at +0.2% m/m and +2.5% y/y. 78
What the week did
Gold broke its September floor in the prior week and kept sliding through the first half of last week. The decline ran to $4,066.54 on Wednesday, the 78.6% retracement of the advance off the summer lows and the lowest print of the move. Buyers stepped in there, and from that point the week belonged to them. 4
Friday did the rest. Spot rose about 1.5% to $4,196 by 16:30 ET, a second straight session higher and a one-week high, before settling at $4,193.83. The session high of $4,207.49 tested the lower swing low at $4,203 carried over from early July and stopped there. 145
The driver was less about gold than about what had been leaning on it. President Trump said the United States would not attack Iran before the November midterms, which took the supply premium out of crude. Cheaper oil eased the inflation trade, the dollar came off its 52-week high and yields backed off, and gold caught a bid as three headwinds loosened at once. 56
What did not change is the rates backdrop. The 10-year yield is still near 5.24%, close to its highest since 2002, and the Fed is still discussing another increase. 69
Confirmed technical structure
Investing.com's board (read at 2026-10-12 00:05 GMT) flips to Buy on short-horizon momentum: 9 of its 12 averages and 7 of its 10 indicators sit on the buy side. RSI(14) reads 59.150, MACD(12,26) 10.283 and ADX(14) 36.787, while StochRSI(14) at 13.911 and Williams %R at −34.398 say the short-term move is closer to stretched than fresh. 3
One measurement conflict goes on the record again, and it has widened. Investing.com's own averages cluster in a $4,146–$4,193 band, and its 200-period reading prints $4,155.75 — roughly $374 below the annotated daily chart's 200-day at $4,529.65, with its 50-period at $4,154.22 against the chart's $4,334.71. The same feed's ATR(14) reads 11.4948, a fraction of what last week's sessions actually travelled. Treat that board as short-horizon momentum, and take structural averages from the daily chart. 36
FXEmpire's swing map is explicit. The daily main trend is down and changes to up only on a trade through $4,399.67; a move through $4,066.54 signals the downtrend is resuming. The minor trend turned up when $4,184.38 was taken out, and the first real ceiling is the retracement cluster at $4,230.51–$4,233.10. Above it sit the 61.8% level at $4,272.41, the 50% at $4,319.60 and the 50-day average at $4,334.94. 6
Bruce Powers reads the same chart as a falling bullish wedge whose breakout trigger is a move above $4,226, reinforced by a falling 20-day average near $4,232. Beyond it he marks the lower swing highs at $4,400 and $4,511, the 200-day near $4,531 and August's high at $4,697, with a measured objective as far as $4,821. 4
Anna Radomska, working the futures contract, puts the first trigger at 4202 and the next obstacle at the 28 September bearish gap, 4315–4321. She marks support at 4098–4135 and estimates the wedge's minimum upside near 4500. 10
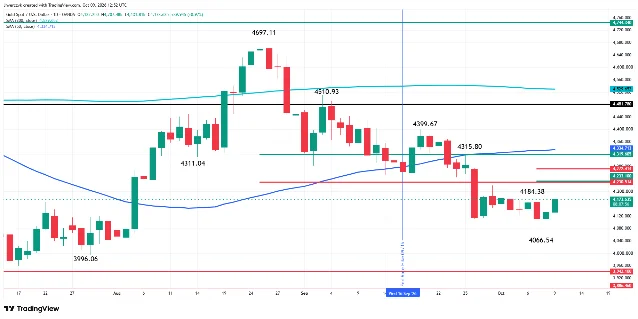
Working channel for Oct. 12–16
| Zone | Price level | Trading rule |
|---|---|---|
| Best sell zone / overhead supply | $4,230–$4,335 | The $4,230.51–$4,233.10 cluster, the falling 20-day near $4,232, the 61.8% at $4,272.41, the 28 September gap at $4,315–$4,321, the 50% at $4,319.60 and the 50-day at $4,334.94. Shorts want a 1-hour rejection close back under $4,230 after a probe. 610 |
| Breakout gate | Above $4,226; hold above $4,233 | A 4-hour close above the wedge trigger that holds on retest is the first evidence the correction has ended. The 61.8% at $4,272.41 is the next objective. 4 |
| Working midline / classic pivot | $4,191.62 | Equilibrium. Rotating between $4,184 and $4,203 without a catalyst is the worst place on the board to initiate. 3 |
| Immediate reclaimed support | $4,184.38 | The minor top price took out on Friday, now the first shelf. A 4-hour close back below it is the failed-breakout trigger. 6 |
| Defense shelf | $4,098–$4,135 | Radomska's support zone, with the psychological $4,100 inside it. Longs want a sweep and a 1-hour close back above $4,135. 10 |
| Breakdown gate | Below $4,066.54 | Below Wednesday's low the daily downtrend resumes, and $4,000, then June's $3,942.10 and the October 2025 low at $3,886.46, reopen. 6 |
| Best buy zone / structural floor | $3,942–$4,000 | The June low and the round number, the base of the $4,000–$4,200 demand range that the weekly chart is still sitting inside. 11 |
False-breakout warning. Every level in this map sits inside a two-month range, and the pattern since September has been wicks through a level followed by closes back inside it. Both edges of this week's range offer a version. A probe of $4,226–$4,233 that closes back below $4,203 on the hour is a bull trap at the wedge line and a short trigger. A sweep of $4,184 that closes back above $4,191 is a bear trap and a long trigger. 4
Volatility context. The week's whole range was $140.95, from $4,066.54 to $4,207.49, about $28 a session on average. From the $4,190 reopen, the $4,233 gate is roughly 1.5 average sessions away and the $4,066.54 floor about 4.4. Wednesday's CPI is the one event that can cover that distance in minutes, which is why the day-by-day map below leans on it. Investing.com's ATR(14) reading of 11.4948 is disclosed rather than used: it sits below even Friday's $75.67 session range. 13
Macro and fundamental drivers
Investing.com's Fed Rate Monitor, built on CME Group 30-day fed funds futures and updated on 10 October, prices the 28 October decision at 18.4% for a quarter-point increase to 4.00%–4.25% against 81.6% for a hold at 3.75%–4.00%. A week earlier the hike side was 23.0%, so the payrolls week took another 4.6 points out of October. 12
Out to 9 December the same tool still shows more tightening than not: 17.1% at 3.75%–4.00%, 68.4% at 4.00%–4.25% and 14.5% at 4.25%–4.50%, leaving about 83% odds that rates are higher by year-end. Timestamped CME FedWatch snapshots read the same way — 18% for October and 82% for December in Investing.com's Friday report, and 84.7% for at least one increase by December in FXEmpire's. 5612
The speeches point the same way as the pricing. Governor Christopher Waller said on 8 October that 16 of 18 policymakers projected at least one more increase this year, and that hikes need not come at consecutive meetings. St. Louis Fed President Alberto Musalem said on Thursday that rates may need to rise further over the next six to nine months. 513
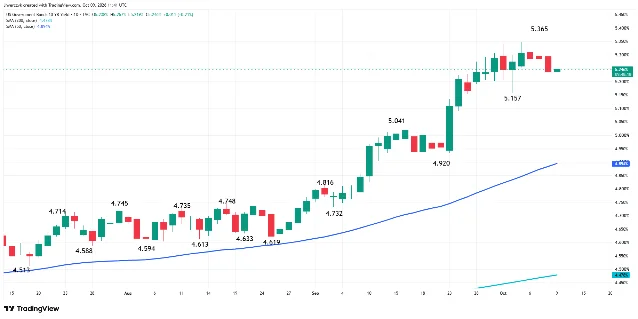
Nominal yields are the pressure that has not lifted. CNBC's 10-year quote closed Friday at 5.242%, and the daily chart marks the high of the run at 5.365%. The 30-year sits at 5.599%, the 5-year at 5.021%, the 3-month at 4.159% and the 2-year at 4.797%, with the 10-year-to-2-year spread at 31 basis points. That leaves the 10-year about 35 basis points above its 50-day average at 4.894%. 3914
Real yields are where last week's improvement is cleanest. The St. Louis Fed's 10-year TIPS series fell to 2.87% on 8 October from 2.95% on 5 October; the 5-year TIPS fell to 2.62% from 2.70%; and the 10-year breakeven inflation rate slipped to 2.33% from 2.36%. Falling real yields with a flat breakeven is the friendliest combination gold can be handed, and it is the mirror image of the rising-real, flat-breakeven shape that capped the metal in late September. The newest TIPS observation is 8 October, two sessions behind this cutoff. 151617
The dollar is the counterweight. CNBC's ICE U.S. Dollar Index reads 102.182, inside a 52-week range of 95.55–102.54, with the high set on 5 October; Investing.com's index shows 101.985. ING told Investing.com that dollar drops may "continue to prove short-lived and quite small in size as bond markets remain fragile and the Fed narrative hawkish." On Radomska's chart the index is consolidating under resistance at 102.36–102.49 while holding support at the June–July highs of 101.49–101.57. 51018
Oil is the wildcard. Brent trades near $103.76 and WTI near $91.02. Trump's commitment to hold off on strikes against Iran before the midterms pulled the supply premium down on Friday, and gold rallied on the relief. The story underneath has not gone away: Iran rejected the U.S. position on Hormuz over the weekend, and reporting described Washington weighing renewed strikes after attacks on Riyadh. One headline can put the energy-inflation trade back in control. 3519
Demand improved while price fell. The World Gold Council's September report, published 7 October, shows global gold ETFs taking US$10bn in September and a record US$31bn over the third quarter, with holdings up 67t to a record 4,256t. Total assets slipped 7% to US$574bn, which is a price effect rather than a flow one: North America added US$4bn, Europe US$3.6bn and Asia US$2.3bn. 20
Positioning moved the other way over the same month. COMEX net longs fell 13%, or 100t, to 654t, and managed money cut 84t to 387t. Investors adding the physical product while speculative length came down is the split that has run all year. 20
News impact table
| Date and time (GMT+8) | Event | Bull/bear logic |
|---|---|---|
| Mon 12 Oct, all day | U.S. Columbus Day: Treasury market and banks closed, stock market open | Thin holiday books widen spreads and magnify headline moves. Monday's ranges are the least reliable of the week. 7 |
| Tue 13 Oct, 15:45–20:00 | Fed speakers Waller, Barkin and Collins; JPMorgan, Goldman Sachs and Citigroup earnings | Hawkish remarks lift real yields and the dollar against gold; strong bank results pull risk capital away from the metal. 7 |
| Wed 14 Oct, 20:30 | September CPI: headline forecast +0.6% m/m and +3.6% y/y; core +0.2% m/m and +2.5% y/y | The week's pivot. A hot headline revives October hike odds toward the 5.365% yield high and sends gold back to $4,184. A soft core print drops real yields and opens the $4,233 gate. 78 |
| Wed 14 Oct, 17:40 and 02:00 (Thu) | Bowman speaks, then the Beige Book | The Beige Book's price commentary frames December pricing; a hawkish tone caps gains going into the print. 21 |
| Thu 15 Oct, 20:30 | September PPI, retail sales and jobless claims (forecast 195K) | A hot PPI confirms the energy pass-through after CPI. Claims near 195K leave the labour market tight enough for the Fed to keep hiking. 7 |
| Fri 16 Oct, 11:30 | Fed Chairman Warsh speaks | Sets expectations for the 27–28 October meeting. A signal that October is live lifts the dollar and caps gold. 21 |
| Ongoing | Iran–Hormuz headlines and crude oil | A strike headline lifts gold's war bid but lifts yields and the dollar with it. Friday's rally came from oil easing, not from a fresh bid. 19 |
Five-day outlook
| Scenario | Probability | What it needs | Path to the levels |
|---|---|---|---|
| Range holds, the ceiling wins | 45% | CPI close to forecast, no Fed surprise, dollar holding above 101.50 | Gold rotates $4,150–$4,233, fails at $4,226–$4,233 and finishes the week between $4,184 and $4,220. |
| Breakout extends | 30% | Core CPI at or below +0.2% m/m, soft PPI, Warsh not hawkish | A 4-hour close above $4,233 opens $4,272.41, then the $4,319.60–$4,334.94 shelf. |
| Break down | 25% | Hot CPI and PPI, dollar through 102.54, 10-year back above 5.30% | $4,184.38 fails, $4,135 and $4,100 give way, and $4,066.54 is retested. |
Monday 12 October. Columbus Day. A U.S. bond-market holiday, no top-tier data and the thinnest book of the week. The range is set by Friday's close: hold $4,184.38 and the bias stays up into the week's events; lose it on a 4-hour close and the bounce is already over. Expect the smallest true range of the five sessions.
Tuesday 13 October. Bank earnings and three Fed speakers. Risk appetite and the dollar are the swing factors, and gold's own decision is still $4,184.38 against $4,226.
Wednesday 14 October. CPI at 20:30 GMT+8, plus Bowman and the Beige Book. This is where the week is decided. An above-forecast headline sends the 10-year back toward 5.365% and gold toward $4,100; a soft core print is the cleanest path through $4,233.
Thursday 15 October. PPI, retail sales and jobless claims at 20:30 GMT+8 confirm or contradict Wednesday. A second hot print is what turns a bad CPI into a trend; a soft one keeps the ceiling in place.
Friday 16 October. Warsh at 11:30 GMT+8 frames the October meeting, then industrial production. The week usually closes on the level that CPI set, unless Warsh moves it.
Trading strategy
Long setup — breakout hold and retest
- Entry zone: $4,226–$4,233, on the retest after a 4-hour close above the band.
- Trigger: a 4-hour close above $4,233 that holds on retest, ideally with the 10-year easing back under 5.20%.
- Targets: $4,272.41 first, then $4,319.60–$4,334.94.
- Invalidation: a 4-hour close back below $4,203.
- Second entry: a sweep of $4,098–$4,135 that closes back above $4,135 on the hour, targeting $4,184 and then $4,226.
- Avoid: buying anywhere between $4,184 and $4,203 with no trigger in hand.
Short setup — failed breakout at the wedge line
- Entry zone: $4,226–$4,233.
- Trigger: a 1-hour rejection close back below $4,203 after a probe into the band, or a 4-hour close below $4,184.38.
- Targets: $4,135 first, then $4,100 and $4,066.54.
- Invalidation: a 4-hour close above $4,235.
- Second short: a break below $4,066.54 that retests $4,066–$4,075 from underneath, targeting $4,000.
No-trade conditions
- Price between $4,184 and $4,203 with no trigger: that is the pivot zone and the worst entry on the board.
- The first 30 minutes after the 20:30 GMT+8 CPI release, while spreads are wide and the initial move is still reversing.
- Monday's holiday session, unless a level actually closes beyond and holds.
- Any position taken without a pre-set order at the level named above.
Risk warnings
Main risk: a two-sided event week. One CPI print can reprice the whole channel, and the 10-year is close enough to 5.365% that a hot number puts the multiyear yield high back in play. 9
Fake-move risk. Every level in this map sits inside a two-month range. The $4,226–$4,233 band and the $4,184.38 shelf are both more likely to be probed than to be held or broken on the first attempt. 4
News risk. Middle East headlines can move gold and yields in the same direction, which cancels the trade a technical setup assumed. Oil is this week's transmission channel. 19
Liquidity risk. Monday's U.S. bond-market holiday thins the book. Stops resting closer than the week's $28 average session span are exposed to noise rather than to a real break.
Data gaps and disclaimer
- Continuous native 4-hour and 1-hour spot OHLC is not available from the permitted sources, so those timeframes are used as confirmation conditions rather than measured candles.
- The newest TIPS real-yield observation is 8 October, two sessions behind this issue's cutoff.
- Investing.com's technical board disagrees with the daily chart on the long averages and prints an ATR(14) far below realised ranges; the daily chart supplies structure and the realised session ranges supply volatility.
- Same-day GLD tonnage and intra-month ETF flows are not published; the World Gold Council's September report of 7 October is the newest available.
- The live CME FedWatch probability table does not render, so rate-path probabilities come from Investing.com's Fed Rate Monitor on CME 30-day fed funds futures, cross-checked against timestamped CME FedWatch snapshots.
Every figure carrying a date above is published data; every level, probability and scenario is this issue's reading of it. Probabilities are estimates, not certainties, and no setup here is guaranteed to work. Each carries a defined invalidation level, and the trading rules above are conditions to check rather than instructions to follow.
References
- 1CNBC XAU/USD quote
cnbc.com
- 2FXEmpire live gold page
fxempire.com
- 3Investing.com XAU/USD technical analysis
investing.com
- 4
- 5Investing.com: Gold prices hit one-week high
investing.com
- 6FXEmpire: XAUUSD Bounces as Oil Eases
fxempire.com
- 7
- 8
- 9CNBC US10Y quote
cnbc.com
- 10FXEmpire: Gold and the US Dollar Are Both Rising
fxempire.com
- 11
- 12Investing.com Fed Rate Monitor Tool
investing.com
- 13Federal Reserve: Governor Waller speech, 8 October 2026
federalreserve.gov
- 14
- 15FRED: 10-year TIPS real yield (DFII10)
fred.stlouisfed.org
- 16FRED: 5-year TIPS real yield (DFII5)
fred.stlouisfed.org
- 17FRED: 10-year breakeven inflation rate (T10YIE)
fred.stlouisfed.org
- 18CNBC .DXY quote
cnbc.com
- 19Investing.com: Iran rejects U.S. stance on Hormuz
investing.com
- 20
- 21Federal Reserve: Calendar, October 2026
federalreserve.gov
This story was produced automatically by a channel. One sentence is all it takes for Neodrop to keep producing for you.