Eleven CGM updates: an observed clumping factor at least eight times the simulated one, damped absorbers that shift 40 per cent with the ionisation model, and a Lyα forest inside a z ≈ 7.57 galaxy
Eleven papers show what the ionisation model, the resolution and the sample threshold decide before a simulated absorber statistic can be set against a measured one, from a clumping factor at least eight times below what the observed quasar nebulae require to a Lyα forest seen inside a galaxy at z = 7.57.

Six of this week's eleven items set a synthetic observable against a measured counterpart of the same quantity. Five of the six take the synthetic side from a model of the system being observed — mock Lyα cubes from three simulation suites set against MUSE nebulae, Lyα transmission distributions from a reionisation simulation set against measured Lyα fractions, skewers from three reionisation models set against one measured effective optical depth, CLOUDY line ratios set against a stacked He II/Hα ratio, and a photoionisation model of one halo's molecular fraction set against the measured one. The sixth takes its synthetic side from a machine-learning field trained on simulations. One item benchmarks two ionisation treatments of the same simulated gas against each other and puts neither beside data. Four report measurements with no synthetic observable in the comparison, and two of those four — Helton et al., which checks its transmission window against a simulated lightcone, and Slosar, which recovers an injected deflection as a response test — use a synthetic input only to test the measurement rather than to make it. No item this week is synthetic-only. 1234567891011
Two of the eleven measure the same galaxy. JADES-GS-z7-LAF, which Helton et al. place at z = 7.5670 ± 0.0001, is JADES-GS-217704, which Yue et al. select out of 122,336 JADES objects at z_spec = 7.567, and the two papers report different significances for the same two detections. Helton et al. give approximately 7σ in the NIRSpec/PRISM spectrum and approximately 10σ in the F090W image; Yue et al. give 5.66σ and 13σ. The readings are not independent of the two papers' different continuum treatments and fitting windows, and a reader quoting one of the four numbers should say which paper it came from. 12
The densest thread of the week runs through the cold, dense end of the circumgalactic medium, where two papers from the same group reach the same number from opposite directions. Lazeyras et al. build mock MUSE cubes from the DaLya, COLIBRE and HELLO simulations and find that none of them reproduces the observed Lyα surface-brightness distribution of fourteen quasar nebulae; the clumping factor their simulated cold gas reaches is 16 to 102, and the value the observations require is about 860, at least eight times larger. Travascio et al. reach that constraint without any simulation at all, from the stacked ratio of a non-resonant pair of lines, and put the same clumping factor at 7 × 10² to 4 × 10³. Ritter et al. supply the molecular-gas side of the same problem in 37 other quasars at the same epoch and find that the ones with the brightest central Lyα nebulae are the ones ALMA cannot detect in CO. 567
Around that thread sit four papers on reionisation-era transmission, two of which fit a model to a measured Lyα fraction and two of which report the measurement or the skewer ensemble alone, and then one paper that shows how much of the predicted absorption of a given gas distribution depends on how its ionisation state was computed. 348
The order below follows that grouping: the reionisation-era transmission items first, then the quasar and halo circumgalactic medium, then the statistics and halo-cloud items last.
Quick look
The class in each row reads as follows: (a) a synthetic observable set against a measured counterpart of that same observable, where the synthetic side is a mock product of a hydrodynamical simulation or the prediction of a photoionisation model applied to the observed system; (b) two modelling treatments of the same gas compared with each other, with no data in the comparison; (c) a synthetic observable with no measured counterpart in the comparison; (d) a measurement with no synthetic observable in the comparison, where a simulation may still be used as an interpretive check on a result that does not depend on it.
| Work | Class and redshift | Comparison level | Result to screen on | Code and data |
|---|---|---|---|---|
| Helton et al., arXiv:2609.38080 | (d) observational anchor; z = 7.567, flux spanning z ≈ 6.56–7.57 | One galaxy on one JWST/NIRSpec/PRISM sightline, with five grating-filter combinations, 11 NIRCam bands and MIRI | Blueward-of-Lyα flux at ≈ 7σ, confirmed in F090W at ≈ 10σ, requiring x_HI < 10⁻⁵ on that sightline; the longest THESAN ionized region reaches 46.0 cMpc only at z ≈ 5.43–5.53 and 15.0 cMpc at z ≈ 6.12–6.15 1 | No data DOI; JADES imaging and spectra at the STScI HLSP and JADES access pages; three public fitting repositories 1213 |
| Yue et al., arXiv:2609.36656 | (a) synthetic observable against real data; z = 7.567 galaxy, transmission at z = 6.80 ± 0.07 | 20,000 simulated skewers per model from three reionisation models, against one measured effective optical depth on one JADES sightline | τ_eff = 1.28 ± 0.18 over 210.5 (+55.7/−53.5) comoving Mpc, x_HI = (2.07 ± 0.30) × 10⁻⁶; no skewer in any of the three models reaches τ_eff < 4 2 | No code repository; a Zenodo deposit promised at acceptance but not yet given an address; JADES and DJA data pages reachable 14 |
| Kundu, Lidz & Sun, arXiv:2609.40363 | (a) synthetic observable against real data; z ≈ 6–14, bounds quoted at z = 7, 8 and 11 | Thesan-1 (95.5 cMpc box, 2100³ particles) and a semi-analytic model against published JWST Lyα-fraction measurements | 1σ ⟨x_HI⟩ = 0.38 (+0.14/−0.38) at z = 7, 0.57 (+0.23/−0.57) at z = 8 and 0.93 (+0.05/−0.17) at z = 11 for EW > 25 Å; median bubble radius ≈ 5 cMpc at z = 7.4 3 | One public modelling package; no data DOI and no THESAN access URL printed 15 |
| Piscitelli et al., arXiv:2609.15547 (A&A, online 6 October) | (d) observational anchor; EIGER emitters at 5.30 < z < 6.97, absorbers at 5.33 < z < 6.52 | 16 C II and 14 C IV absorption systems against 948 [O III] emitters in six EIGER fields, with a field-shuffled random background | C II covering fraction 0.500 (+0.189/−0.189) at 0–75 pkpc, falling to background past 500 pkpc; C IV stays a factor of 2 above background to ≈ 1 pMpc, and matching each absorber to its smallest-impact-parameter galaxy removes the plateau 4 | No repository and no data DOI; two third-party analysis packages named with working documentation links 16 |
| Lazeyras et al., arXiv:2610.01400 | (a) synthetic observable against real data; simulations at z = 3.5, nebulae at median z = 3.76 | Mock MUSE Lyα cubes from DaLya, COLIBRE m6 and m5, and HELLO against 14 observed quasar Lyα nebulae | Simulated clumping factors of the cold CGM run 16 to 102 against about 860 required by the observed He II/Lyα ratio, which the paper calls at least eight times larger; densities of at least 10 cm⁻³ must be present within 50–200 ckpc 5 | No URL printed anywhere; the paper names Gizmo, MUSIC, AHF and CubEx without links 17 |
| Travascio et al., arXiv:2610.01454 | (a) synthetic observable against real data; 13 quasars at z ≈ 2.2 and 26 at 3.1 < z < 4.5 | A CLOUDY grid of quasar-illuminated clouds against stacked Keck/KCWI and MOSFIRE line ratios, and MUSE He II/Lyα | Stacked He II/Hα = 0.54 (+0.32/−0.21) forces a lognormal width σ ≳ 3 and a clumping factor of 7 × 10² to 4 × 10³; no evidence of evolution in He II/Lyα between z ≈ 2.2 and z ≈ 3.7 6 | The full He II/Hα model grid is published on GitHub; no data DOI printed 18 |
| Ritter et al., A&A 714, A17 | (d) observational anchor; quasars at z ≈ 3 | ALMA Band 3 CO(4-3) in 37 QSO MUSEUM quasars, against their MUSE Lyα nebulae and quasar Eddington ratios | 21 of 37 detected in CO, with a median gas fraction of 0.10; the molecular mass anti-correlates with central Lyα surface brightness at Kendall τ = −0.44 (p = 1.1 × 10⁻⁴) and every quasar below 1.3 × 10⁻¹⁴ erg s⁻¹ cm⁻² arcsec⁻² is CO-detected 7 | No code repository and no data URL; the ALMA program ID is printed as a bare identifier 19 |
| Cadiou et al., arXiv:2510.05667 (OJAp, 30 September) | (b) treatment benchmark; z = 3–4 | Non-equilibrium thermochemistry with on-the-fly radiation against photoionisation equilibrium with a uniform background, on identical gas | Damped Lyα absorber covering fractions differ by up to 40 per cent between the two treatments, Lyman-limit systems and sub-DLAs by 10 to 20 per cent, and one sightline's absorption by a factor of 2 8 | The paper prints no URL; its companion prints a radiation-transport interface URL that did not resolve from our client 20 |
| Slosar, arXiv:2609.36949 | (d) observational anchor; forest at 1.96 ≤ z ≤ 3.0 | A pair-based quadratic estimator on DESI DR1, with deflection templates validated against ACT DR6 and Planck PR4 CMB lensing | Forest-forest A_L = 0.42 ± 0.43, quasar-forest 0.87 ± 0.48, combined 0.62 ± 0.33 — consistent with one at 1.2σ and with no lensing at 1.9σ; an injected deflection is recovered at 1.060 ± 0.040 9 | Public repository with the full estimator 21 |
| Gong et al., arXiv:2609.36355 | (a) synthetic observable against real data; LRGs at 0 < z < 1.5, velocities at z = 0.55 and 0.8 | A simulation-trained Transformer velocity field, validated against AbacusSummit, used to extract optical depths from DESI DR2 × ACT DR6 | AP-filtered effective optical depth 0.47 ± 0.03 × 10⁻⁴ at the highest signal-to-noise, reaching a signal-to-noise of 15.1 with the theoretical velocity template and 14.2 with the reconstructed one 10 | The reconstruction package is public; the figure-data deposit returned an access wall to automated fetching 2223 |
| Koplitz et al., arXiv:2610.06662 | (a) synthetic observable against real data; one absorber at z = 0.1038 | CLOUDY molecular fractions against one measured H₂ column on a single HST/COS sightline | log N(H₂) = 16.52 ± 0.05 and a molecular fraction of 2 per cent at 139 kpc from the galaxy, at a single excitation temperature of 245 (+25/−21) K; no equilibrium CLOUDY model reproduces the measured fraction 11 | An HST archive DOI is printed; no code repository 24 |
Every entry below carries the same five fields: sample and observable, method and result, real-data stage and caveat, code and data, and why open it.
1. Helton et al.: a Lyα forest inside a galaxy at z = 7.567, on a sightline that needs x_HI below 10⁻⁵
Jakob M. Helton, Joris Witstok, Marta Laska and 15 colleagues posted Discovery of the Lyα Forest in a Star-Forming Galaxy at z ≈ 7.57: Implications for the Timing and Topology of Cosmic Reionization on 29 September 2026 at 12:38 p.m. Central Time, and the astro-ph.GA listing carried it on 30 September. The paper is marked for submission and no journal reference is reported. 1
Sample and observable. The target is a single galaxy, JADES-GS-z7-LAF (NIRCam ID 217704) in the GOODS-S deep field of JADES, at a spectroscopic redshift of 7.5670 ± 0.0001 from the medium-resolution G395M/F290LP spectrum of Hβ and [O III] λλ4959, 5007. The measurable quantity is flux blueward of Lyα in the observed frame, which the paper reports over λ_obs ≈ 0.92–1.04 μm. That window corresponds to intervening gas at z ≈ 6.56–7.57 and to a physical line-of-sight span of 43.2 proper Mpc, or 349 comoving Mpc. The galaxy itself is massive for the epoch, with a stellar mass of 10^9.1 M_⊙ and M_UV = −21.55 ± 0.02, comparable to GN-z11. 25
Method and result. The blueward-of-Lyα flux is detected directly in the spectrum and in the image, and no simulated spectrum enters the measurement. The flux is detected at approximately 7σ in the PRISM spectrum and independently at approximately 10σ in the NIRCam F090W image, whose blueward channel covers rest-frame 920–1200 Å at this redshift. In the image the flux is spatially coincident with the galaxy and emerges 0.4 proper kpc from its ultraviolet centroid; between the F090W and disk centroids the paper measures an offset of 0.0380 ± 0.0069 arcsec, or 0.193 ± 0.035 kpc. The blueward-flux centroid sits at λ_obs = 0.9540 ± 0.0021 μm, which is a velocity offset of −25,200 ± 600 km s⁻¹ relative to Lyα, with a flux density of 2.80 ± 0.42 × 10⁻¹⁷ erg s⁻¹ cm⁻². The turnover at the Lyα break is equally consistent with an extreme damping wing at N_HI ≈ 10^23.3 cm⁻² and with a strong nebular continuum contributing 60 to 70 per cent of the flux at rest-frame 1500 Å; the two interpretations are separated by a detected Balmer jump of about 3.4σ, with f_ν,red/f_ν,blue = 0.66 ± 0.100. Converting the transmission to a neutral fraction through τ_GP(z = 7.567) ≈ 5.2 × 10⁵ x_HI gives x_HI < 10⁻⁵ along that one sightline, which the paper writes as x_HI ≪ 0.1 per cent. 25
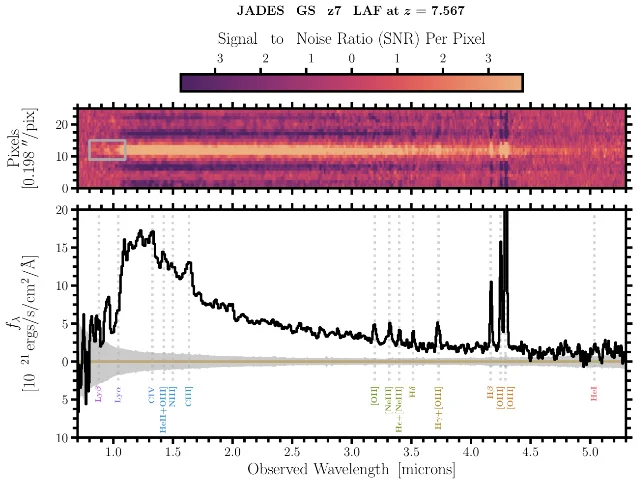
Real-data stage and caveat. The detection and every number above come from JWST spectroscopy and imaging; no synthetic observable is generated. The simulation enters only afterwards, as a sanity check on length: THESAN-1's line-of-sight lightcone product gives the longest contiguous region with x_HI < 10⁻⁴ as 46.0 comoving Mpc at z ≈ 5.43–5.53, and only 15.0 comoving Mpc at z ≈ 6.12–6.15, while the observed window spans far more gas than that at higher redshift. The paper is explicit that a real comparison would require generating mock transmitted spectra from the simulated density, temperature, velocity and neutral-fraction fields and passing them through the same instrument and detection, and that this comparison is outside its scope. The caveats are substantial and mostly about the low spectral resolution. At R ≈ 100, unresolved transmission windows separated by saturated troughs smooth into a positive continuum, so the physical size of the transparent region is, in the authors' words, enormously difficult to measure from the PRISM data alone. A foreground interloper cannot be formally excluded, though the probability of one within 0.1 arcsec is about 0.014 per cent and within 1 arcsec about 1.4 per cent, and an interloper of the required flux would show Hα at about 60 × 10⁻²⁰ erg s⁻¹ cm⁻² against a measured 3σ limit of about 22.8 × 10⁻²⁰ erg s⁻¹ cm⁻², so the absence of that line argues against an interloper rather than settling the question. The THESAN lightcones stop at z ≈ 7.06, below the galaxy. The electron density and temperature are degenerate, and a low-density solution with n_e = 300 cm⁻³ lowers the oxygen abundance by 0.6 to 0.7 dex. Three internal mismatches are worth knowing before quoting the paper's physical parameters: the stellar age appears as approximately 50 Myr in one section and as 27.1 (+26.5/−9.4) Myr in the table and elsewhere; the electron temperature appears as 18,600 (+2,300/−2,300) K from the self-consistent solution and as 22,600 (+1,700/−2,500) K from the [O III] ratio in the same section; and the blueward-flux offset from the ultraviolet centroid is 0.4 proper kpc in the abstract while the image-to-disk offset is 0.193 ± 0.035 kpc in the table, measured from different reference points without a reconciliation. 25
Code and data. JADES imaging, catalogues and spectra are public through the STScI high-level science products page for JADES, the JADES search interface and the survey's own data page, all of which resolved when checked. Three of the analysis codes are public on GitHub: the PyMultiNest emission-line fitting, the NIRSpec MSA forward-modelling package used for the line-spread-function leakage test, and the MultiNest implementation for the damping-wing and nebular-continuum fits. The THESAN line-of-sight lightcone product has its own page at the project site. No data DOI and no Zenodo deposit are printed for the paper's own products. 1213262728
Why open it. It is the only place where the exact THESAN lightcone lengths, 46.0 comoving Mpc at z ≈ 5.5 and 15.0 comoving Mpc at z ≈ 6.1, are printed beside the observed transmission window they are being used to judge, and the only one of this week's papers that writes down what a proper mock-spectrum comparison would have to do before declining to attempt it.
2. Yue et al.: a foundation model picks a 210 cMpc transmission window, and no simulated skewer produces one
Minghao Yue, Yongda Zhu, Jiani Ding, Xiaohui Fan and Yufeng Luo posted An Ionized Superstructure at Cosmic Dawn Revealed by a Foundation Model for Astrophysical Research on 28 September 2026 at 10:58 p.m. Central Time, and the listing carried it on 30 September. The paper is marked as submitted, with no journal reference. 2
Sample and observable. The discovery path runs over 122,336 objects in JADES Data Release 5, of which 100 are spectroscopically confirmed at z > 7 at grade A or B; the frozen foundation model FM-JADES-v1 embeds and ranks them, and the top few outliers were inspected. The target is JADES-GS-217704 at z_spec = 7.567 — the same galaxy as in the entry above — and the observable is a transmission feature in the NIRSpec/MSA prism spectrum between 0.9 and 1.0 μm, at a mean wavelength of 0.948 ± 0.008 μm. The paper converts it into an effective optical depth of τ_eff = 1.28 ± 0.18 in the full-width window and 1.08 ± 0.24 in a centred 50 cMpc h⁻¹ window, and from the Gunn-Peterson relation into a neutral fraction of x_HI = (2.07 ± 0.30) × 10⁻⁶. 14
Method and result. The Gaussian fit to the feature gives an amplitude of 0.0474 (+0.0094/−0.0095) μJy, a centroid at 0.948 ± 0.008 μm and a full width at half maximum of 0.07 ± 0.02 μm. Taken as a physical extent, that width corresponds to 210.5 (+55.7/−53.5) comoving Mpc along the line of sight, and the measured optical depth is lower than anything the simulations produce: three reionisation models, each run with 20,000 skewers, produce no skewer with τ_eff below 4 in the centred 50 cMpc h⁻¹ windows. The probability of a random sightline reproducing the signal is 9.14 × 10⁻⁶ for the low-τ_CMB model, 9.16 × 10⁻⁶ for the hot low-τ_CMB model and 5.00 × 10⁻⁵ for the high-τ_CMB model. The environment does not obviously explain it: 214 objects sit in the 149 arcmin² depth-limited GOODS-S footprint at a surface density of 1.44 ± 0.10 arcmin⁻² and 27 within 2 arcmin of the sightline at 2.28 ± 0.44 arcmin⁻², which the paper reads as no significant overdensity, in tension with inside-out reionisation. 14
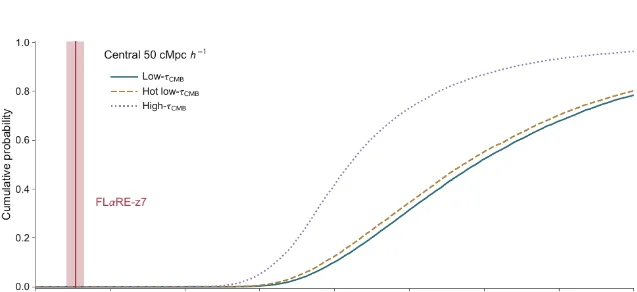
Real-data stage and caveat. The measurement is real; the comparison is against a simulated skewer ensemble, so the item is a synthetic observable set against a measured counterpart. The single most important limitation for a reader is that the simulation suite behind those 20,000 skewers is not named. The paper cites reference [32], Keating et al. (2020), for three reionisation models defined by τ_CMB = 0.051 or 0.071 and E_γ = 17.1 or 18.6 eV, and refers readers there for the setup; that paper's own abstract describes cosmological radiative transfer simulations without naming a code or a resolution, so neither the mass resolution nor the box size behind the tail probability can be recovered from this paper. Four internal mismatches are worth carrying. The probability of finding such a system in the whole experiment is written as about 10⁻³ in the main text and as about 5 × 10⁻³ in the supplementary material. The main text rounds the three tail probabilities to about 10⁻⁵ for all three models, while the third is 5.00 × 10⁻⁵, five times the other two. The abstract and summary say the result severely challenges existing reionisation models while the supplementary methods call it marginal tension. And figure cross-references and the structure's name disagree between the main text and the supplement. Photometric redshifts are used for the neighbours because only a small subset has spectroscopy, and the paper states it cannot rule out that the structure sits in an overdensity of faint galaxies. 1429
Code and data. The JADES data page, the DAWN JWST Archive index and the public NIRSpec/MSA spectral-extraction listing all resolved. The paper states that its code and data products will be on Zenodo by the time of acceptance and prints no address for them, so at the time of writing the analysis is not reproducible from the paper alone. Two large language model services are printed as tools used in the analysis; both returned anti-bot challenge pages to our client, so neither could be read. 1230
Why open it. The per-model tail probabilities, the model parameters behind them and the cumulative τ_eff distributions are printed nowhere else, and anyone wanting to check whether the "no skewer below τ_eff = 4" statement survives a different reionisation model has to start from those three numbers and reference [32].
3. Kundu, Lidz and Sun: JWST Lyα fractions become 1σ bounds on the neutral fraction at three redshifts, with the bubble sizes attached
Aritra Kundu, Adam Lidz and Guochao Sun posted Probing the Reionization History and Bubble Sizes with JWST Lyα Fraction Measurements on 30 September 2026 at 12:59 p.m. Central Time, and the listing carried it on 1 October. It is submitted to the Astrophysical Journal. 3
Sample and observable. The synthetic observable is the Lyα IGM transmission coefficient, computed two ways on the same simulation: an exact patchy damping-wing calculation and a semi-analytic uniform-IGM model. The simulation is Thesan-1, a 95.5 comoving Mpc box with 2100³ dark matter and gas particles, dark-matter masses of 3.12 × 10⁶ M_⊙ and gas masses of 5.82 × 10⁵ M_⊙, producing neutral-fraction fields on 512³ grids. Transmission is drawn for every simulated galaxy above a halo mass of 10^8.5 M_⊙, one random line of sight each, then convolved with an intrinsic equivalent-width distribution calibrated at z ≈ 6 to a log-normal with e^μ = 8 (+4/−3) Å and σ = 1.85 (+0.42/−0.33) in ln EW. The measured counterparts are published JWST Lyα fractions for UV-selected galaxies at z ≈ 6–14, binned in −20.25 < M_UV < −18.75. 31
Method and result. Holding the intrinsic distribution fixed in redshift and propagating each transmission model gives a predicted Lyα fraction as a function of redshift, which is then compared with the measurements. Thesan and the semi-analytic model agree with the current JWST fractions at a reduced chi-squared of 0.4 to 1.2. Inverting the fit returns 1σ bounds on the mass-weighted neutral fraction: ⟨x_HI⟩ = 0.38 (+0.14/−0.38), 0.57 (+0.23/−0.57) and 0.93 (+0.05/−0.17) at z ≈ 7, 8 and 11 for equivalent widths above 25 Å, with the looser bounds 0.52 (+0.09/−0.21), 0.68 (+0.12/−0.39) and 0.89 (+0.11/−0.15) for the above-10-Å sample. The median predicted equivalent width falls from about 8 Å at z = 6 to about 2.1 Å at z = 9 without outflow and about 2.8 Å with an outflow at the velocity dispersion, and the transmission coefficient asymptotes to 0.5 rather than to 1 as the neutral fraction goes to zero, which is the damping-wing floor rather than a modelling artefact. The accompanying output is a bubble-size distribution: a median ionized-bubble radius below about 0.5 comoving Mpc at z ≈ 13, about 1 comoving Mpc at z ≈ 10, about 5 comoving Mpc at z = 7.4 and about 20 comoving Mpc at z = 6.1. 31
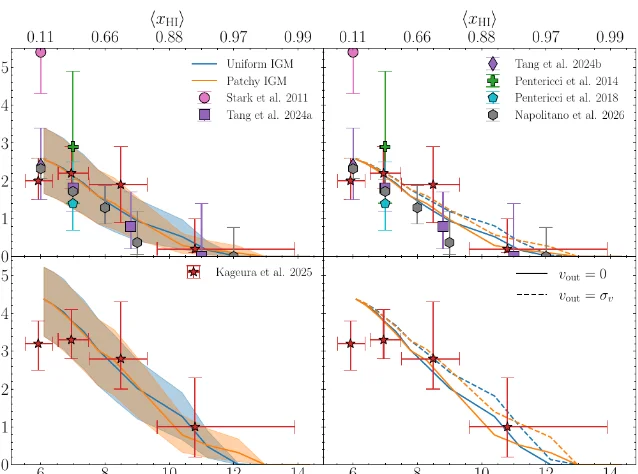
Real-data stage and caveat. The comparison is a synthetic observable against measured Lyα fractions, and the paper is careful about what the bound depends on. The intrinsic equivalent-width distribution is assumed not to evolve, and the authors note that a declining dust abundance would raise the intrinsic widths and force a faster rise of ⟨x_HI⟩. Growing evidence for large neutral columns in the interstellar and circumgalactic media of early galaxies may make the model overestimate the neutral fractions needed to match the observations. The semi-analytic model neglects spatial variation of the exterior neutral fraction and redshift evolution of the mean. Cosmic variance across the small JWST fields is noted as potentially large and not fully propagated into the observational error budgets. And the anchor at z ≈ 6 is a by-construction match, so the z ≈ 6 point carries no information about the model. 31
Code and data. One external address is printed and it resolves: a public Python package for modelling the Lyα damping wing, which the paper says will be continuously updated. No data DOI, no Zenodo record and no THESAN data-release address are printed; the THESAN public release is cited only as a reference title. 15
Why open it. The bubble-size distribution and the transmission distributions are exported alongside the neutral-fraction bounds, which is unusual — most Lyα-fraction fits stop at the neutral fraction — and the ⟨x_HI⟩ values come with the fitting function and the calibration sample printed, so the numbers can be reproduced rather than only cited.
4. Piscitelli et al.: C IV stays enhanced to a megaparsec around z ≈ 6 [O III] emitters, and matching each absorber to its smallest-impact-parameter galaxy removes the plateau
C. Piscitelli, V. D'Odorico, M. Galbiati and 17 colleagues posted The Multiphase CGM in the Epoch of Reionization: C II and C IV Absorbers around [O III] Emitters on 14 September 2026, and Astronomy & Astrophysics published it online on 6 October 2026. The journal release is the new event. 4
Sample and observable. The absorption sample is 16 C II and 14 C IV systems at 5.33 < z < 6.52, drawn from the XQR-30 metal-absorber catalogue and earlier compilations, along six background quasars at z ≥ 6 in six EIGER fields. The galaxy sample is 948 [O III] emitters at 5.30 < z < 6.97 detected in NIRCam wide-field slitless spectroscopy, of which 44 are associated with C II systems and 92 with C IV systems inside a projected megaparsec and 500 km s⁻¹. For every absorber–galaxy pair the paper computes a projected impact parameter and a velocity offset, defines an association at |Δv| ≤ 500 km s⁻¹, and measures the covering fraction in concentric annuli with Wilson-score binomial errors against a field-shuffled random background. 32
Method and result. Twenty-six per cent of the C II systems and 55 per cent of the C IV systems lie within 500 km s⁻¹ of an emitter. The differential covering fraction in the innermost annulus is 0.500 (+0.189/−0.189) for C II on six galaxies and three detections, and 0.600 (+0.139/−0.157) for C IV on ten galaxies and six detections. The two ions then behave differently with radius, and that difference is the paper's result. The C II covering fraction stays above 20 per cent to 500 pkpc and then drops to 10 per cent, which is what the randomized background gives. The C IV covering fraction stays at least a factor of two above the background out to the maximum separation probed, roughly 1 pMpc, and the paper traces that plateau to group environments: 12 of the 14 C IV systems sit in groups beyond 500 pkpc, and when each absorber is instead matched to its smallest-impact-parameter galaxy the plateau disappears, with the covering fraction returning to background beyond about 300 to 400 pkpc. The three-dimensional correlation lengths are r_0 = 3.60 ± 0.73 cMpc h⁻¹ for C II and 4.09 ± 0.74 cMpc h⁻¹ for C IV at γ = 1.8, against a galaxy–galaxy autocorrelation that the paper quotes twice with different values. The implied carbon mass within 300 pkpc is at least 2.8 × 10⁶ M_⊙ in C II and C IV together, on the assumption of an ion fraction of 0.5 for both. 32
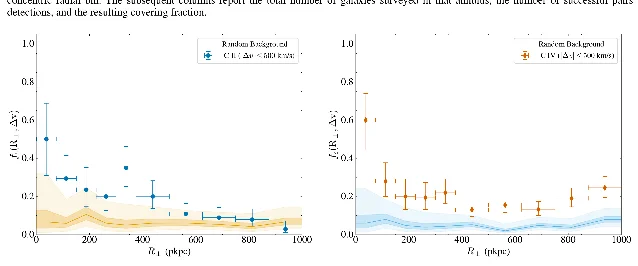
Real-data stage and caveat. The paper's comparison is between two ions measured on the same sightlines, with a shuffled background as the null; no simulation and no synthetic observable appear anywhere in it. The caveats bear directly on how far the covering fractions travel. The sample is small enough that isolated and group galaxies cannot be distinguished statistically. The galaxy selection is [O III]-selected, which picks young, actively star-forming, relatively metal-rich systems with starburst-driven winds, and the paper states that this likely boosts the measured covering fractions. The comparison with the QSAGE sample at z ≤ 2 and the MAGG sample at z ≈ 3–4 uses different galaxy tracers, and the paper calls a direct comparison and any inference about redshift evolution challenging and ambiguous. The carbon mass is the mass of the observed carbon rather than a complete budget, because C III λ977 Å is unobservable inside the Lyα forest. Three internal mismatches are worth naming: the galaxy–galaxy correlation length is given as 10.63 ± 0.56 cMpc h⁻¹ at γ = 1.5 in one section and as 9.12 ± 0.85 in the conclusions, which cannot both be right; the abstract writes the carbon mass as a lower limit while the conclusions write it as approximate equality; and the 136 galaxies named in the abstract appear nowhere else in the paper, whose galaxy counts are 948, 44 and 92. 32
Code and data. The paper prints no data DOI and no data-release address. Two third-party packages are named with working documentation links, the nested-sampling package used for the equivalent-width profile fits and the quasar-spectrum fitting package used for the new X-Shooter continuum. The X-Shooter spectra come from printed ESO programme IDs with no archive address, and the journal article page itself served an anti-bot challenge, so the volume and page are confirmed through the publisher's deposited record rather than read from the journal site. 41633
Why open it. The per-annulus covering fractions for both ions and the matching randomized background are printed as a table with errors, which is what a reader needs to judge the spatial-extent claims themselves rather than accept them — and the same table is what makes the group-environment explanation checkable, since the plateau's removal depends on which galaxy each absorber is matched to.
5. Lazeyras et al.: the mock Lyα nebulae of three simulation suites under-cover the sky, and the gap is a clumping factor at least eight times too small
Titouan Lazeyras, Sebastiano Cantalupo, Andrea Travascio and ten colleagues posted Resolving the physics of Quasar Lyα Nebulae (RePhyNe): II. The Dense and Clumpy CGM of Quasars at z ∼ 3.5 on 1 October 2026 at 5:05 a.m. Central Time, and the listing carried it on 2 October. The paper is submitted to Astronomy & Astrophysics and reports no journal reference. 5
Sample and observable. The synthetic side is a new zoom suite, DaLya, run with the public Gizmo code, holding twelve halos of 10^12 to 10^12.5 M_⊙ at z = 3.5 at a dark-matter mass resolution of 3.8 × 10^6 M_⊙ and a mean baryonic mass of 7.2 × 10^5 M_⊙, together with a high-resolution DaLya run at 4.8 × 10^5 and 9.0 × 10^4 M_⊙ and comparison runs from COLIBRE at two resolutions and from HELLO. Mock integral-field cubes are generated at MUSE sampling, 0.2 × 0.2 arcsec² per spaxel and 1.25 Å per spectral element, with Gaussian noise at 5 × 10⁻²⁰ erg s⁻¹ cm⁻² arcsec⁻² Å⁻¹ and nebulae extracted at a voxel signal-to-noise above 2, under the assumption of maximal fluorescence. The measured counterpart is fourteen quasar Lyα nebulae drawn from MAGG and MUSEQuBES at a median redshift of 3.76. 17
Method and result. Two comparisons run in parallel. The first is the distribution of Lyα surface brightness in the 100–200 ckpc annulus, together with the covering fraction and the circularly averaged profile. The observed covering fraction reaches unity at a surface brightness of 5 × 10⁻¹⁶ erg s⁻¹ cm⁻² arcsec⁻², and none of the simulated nebulae reaches unity at any surface brightness; the simulated mean surface brightness and the observed profile agree to within a factor of three over 40 to 400 ckpc, so the disagreement is in the tail of bright pixels rather than in the mean. The second comparison is the density distribution. The volume-weighted density probability distributions of cold gas between 10³ and 10⁵ K in the 50–160 ckpc annulus come out everywhere as skewed log-normals with medians near 10⁻² cm⁻³, and the clumping factors span 16.5 for HELLO, 21.1 for the DaLya high-resolution run, 25.2 for DaLya fiducial, 29.0 for COLIBRE m6 and 102.1 for COLIBRE m5. The observed He II/Lyα ratio of 0.06 ± 0.02 — measured by the companion paper in this issue — requires, at a fixed median density of 10⁻² cm⁻³, a log-normal width between 2.6 and 3.8, which corresponds to a clumping factor of about 860. The paper puts that at least eight times the largest simulated value and notes that reproducing the observed ratio with the simulated density distributions themselves would take a clumping factor about 35 times larger than the ratio of widths allows. Densities of at least 10 cm⁻³ must be present somewhere within 50 to 200 ckpc of the quasars, which the simulations do produce at their extremes but not with the observed covering. A CLOUDY estimate applied to the COLIBRE m5 distribution predicts He II/Lyα between 0.12 and 0.23, at least twice the measured 0.06 ± 0.02 and more than 2σ away. 17
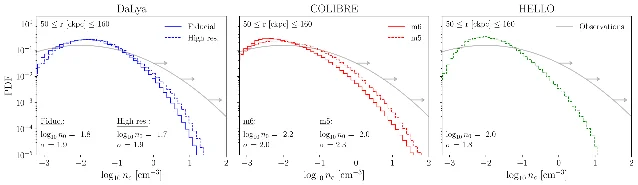
Real-data stage and caveat. The comparison is genuine — mock cubes against real cubes, with a real measured ratio supplying the independent constraint — but almost every modelling choice pushes in the same direction, and the paper says so. Maximal fluorescence assumes the quasar ionises all the hydrogen it can see with no self-shielding, and the emission is recombination only, with collisional excitation neglected; a quasar opening angle below 180 degrees would, the authors write, increase the tension rather than relieve it. There is no Lyα radiative transfer, so residual neutral hydrogen is not followed, and no hydrodynamic response to the quasar's photoheating, which Ledos et al. find shifts the cold-cloud distribution towards lower densities by at least an order of magnitude after about 5 million years and reduces the Lyα emission to 5 to 20 per cent of the maximal-fluorescence value. The halo mass range is itself model-dependent, with some studies preferring 10^13 M_⊙. DaLya has no active galactic nucleus and no black-hole seeding. And the density-distribution shape is the quantity at stake, which makes the under-resolution of cold substructure the most consequential caveat: the paper states that it likely under-resolves the relevant instabilities and includes no physical mechanism to set a scale for the cold substructure. Two internal mismatches are worth noting: the title places the quasars at z ∼ 3.5 while the abstract describes the observed nebulae at z ∼ 3.8, the simulations being at 3.5 and the data at a median 3.76; and the abstract's claim of medians near 10⁻² cm⁻³ is loose against a table whose medians run from 10⁻¹·⁷ to 10⁻²·² cm⁻³. 617
Code and data. The paper prints no code address and no data address at all. It names the tooling without links — Gizmo for the simulation, MUSIC for the initial conditions, AHF for halo finding, and the CubeExtractor package for nebula extraction — and describes COLIBRE as publicly available without printing where. A reader who wants to check the density distributions has the figure panels and the table and nothing else. 17
Why open it. It converts a mock-versus-observed mismatch into a constraint on one quantity, the clumping factor of the cold circumgalactic gas, and prints that quantity for five simulation runs at two resolutions so a reader can see how far resolution alone moves it.
6. Travascio et al.: the observation-implied clumping factor at 7 × 10² to 4 × 10³, from a non-resonant line ratio
Andrea Travascio, Sebastiano Cantalupo, Titouan Lazeyras and 16 colleagues posted Constraining the Density Distribution of the Cold Circumgalactic Medium of Quasars at z > 2 through Lyα, He II and Hα Emission on 1 October 2026 at 5:49 a.m. Central Time, and the listing carried it on 2 October. The paper was submitted to Astronomy & Astrophysics on 6 August 2026 and reports no journal reference. 6
Sample and observable. The measurement is built around two emission lines that are not resonant: He II λ1640 and Hα. Thirteen quasars at z ≈ 2.2, from 2.176 to 2.315, were observed with Keck/KCWI integral-field spectroscopy and Keck/MOSFIRE long slits, and the systems with the most prominent extended Lyα and He II emission were followed up, giving the first statistical quasar-circumgalactic sample with Lyα, He II and Hα measured together. A second sample of 26 quasars at 3.1 < z < 4.5 from VLT/MUSE, where Hα is inaccessible from the ground, supplies He II/Lyα alone; 14 of the 26 show co-spatial extended Lyα and He II. The synthetic side is a CLOUDY grid of quasar-illuminated clouds spanning hydrogen densities from 10⁻⁵ to 10⁵ cm⁻³ in 0.125 dex steps at a metallicity of one tenth solar, two extreme-ultraviolet slopes, two normalisations, two cloud distances and two cloud sizes, computed both for single-density clouds and for log-normal density distributions parameterised by a median and a width. 34
Method and result. In apertures matched out to about 35 pkpc the stacked spectra give Lyα/Hα = 9.05 (+5.30/−3.24), He II/Hα = 0.54 (+0.32/−0.21) and He II/Lyα = 0.060 (+0.025/−0.020). Single-density models plateau at a He II/Hα intensity ratio of about 3 to 5 at low density and cannot reach the observed value below unity without a density above 10 cm⁻³ or an implausibly soft ionising spectrum, which is what forces the density distribution to be broad: any observed ratio below unity requires a log-normal width above 2, or a clumping factor above 55 on an unbounded grid. With the fiducial extreme-ultraviolet slope, matching the stacked ratio needs widths of at least 3.0, 2.5 and 2.1 for median densities of 10⁻³, 10⁻² and 10⁻¹ cm⁻³, and models that reproduce the median observed ratio rather than only its lower bound have widths near 4.2, 3.6 and 3.2, which the paper converts to a clumping factor between 7 × 10² and 4 × 10³ — a conversion made on a grid truncated at 10⁵ cm⁻³, so it falls far below the exponential of the squared width that an unbounded log-normal would give. The line widths add a kinematic check: the stacked Hα width is 165 (+31/−27) km s⁻¹, He II is 177 (+22/−20) km s⁻¹ and Lyα is 295 (+35/−40) km s⁻¹, so the resonant line is roughly 1.8 times broader than Hα while the two non-resonant lines agree. Between z ≈ 2.2 and z ≈ 3.7 the emission-weighted He II/Lyα shows no evidence of strong evolution, with a median near 0.05 at both epochs. 34
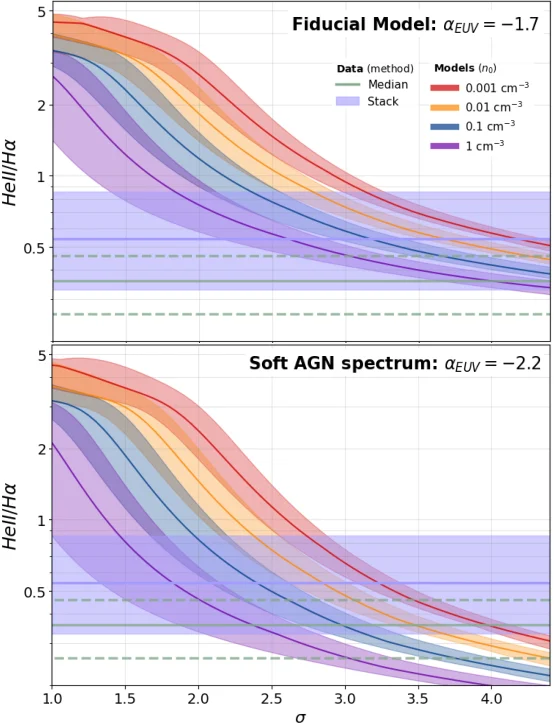
Real-data stage and caveat. The synthetic side here is a photoionisation model rather than a hydrodynamical simulation, and the paper is direct about the difference the choice of tracer makes. By using He II and Hα rather than Lyα alone, the constraint does not depend on the maximal-fluorescence assumption the simulation comparison in the previous entry has to make — but the ratios that carry Lyα in the denominator are upper limits if resonant scattering moves photons outside the slit, the emission is assumed to come from co-spatial clouds of one size, and the quoted clumping factor, mean density and dense-gas fraction are moments of an assumed distribution, most sensitive to a high-density cutoff the data do not constrain. The CLOUDY grid is truncated at 10⁵ cm⁻³, so the printed clumping factors are finite-grid values that depart from the exponential of the squared width. The samples are small, 13 quasars at one epoch and 26 at the other, and the slits were placed on the brightest Lyα and He II regions, which is a selection on the quantity being measured. Three internal mismatches are worth carrying: the abstract places the required clumping factor at 10³ to 10⁴ while the fiducial-spectrum table and text give 7 × 10² to 4 × 10³, the upper decade being reached only in the soft-spectrum branch; the abstract rounds the stacked Lyα/Hα ratio to 9.1 where the body gives 9.05; and one table legend is printed twice. 34
Code and data. The full grid of He II/Hα ratios, in width steps of 0.05 and median-density steps, is published in a public GitHub repository, which is what makes the constraint recomputable rather than only readable. No data DOI and no survey-release address are printed. 18 The KCWI stacking used a flag documented in a third-party package whose source file is linked in a footnote. 35
Why open it. It is the paper that supplies the observed clumping factor that the simulation comparison in this issue is measured against, and it does so from a line ratio that does not require the assumption that makes the simulation side weakest, with the model grid downloadable.
7. Ritter et al.: the quasars with the brightest central Lyα nebulae are the ones ALMA cannot detect in CO
Jelena Ritter, Fabrizio Arrigoni Battaia, Bo Peng and five colleagues posted ALMA visits the QSO MUSEUM: Connecting Molecular Gas and the Cool Circumgalactic Medium around 37 z ∼ 3 Quasars on 29 June 2026, and Astronomy & Astrophysics published it online on 30 September 2026 in volume 714 as A17. The journal release is the new event. 7
Sample and observable. The survey targets 37 quasars at z ≈ 3 from the QSO MUSEUM sample, each already mapped in extended Lyα with VLT/MUSE, with ALMA Band 3 observations of the CO(4-3) line at a median synthesised beam of 1.6 arcsec and a line root-mean-square near 370 μJy per 50 km s⁻¹ channel. The measured quantities are CO line luminosities and molecular gas masses, gas fractions against stellar mass, CO effective radii, and companion galaxies, all set against the quasars' own Lyα nebula properties and Eddington ratios. 19
Method and result. Twenty-one of the 37 quasars are detected in CO(4-3), a rate of 57 per cent, with molecular gas masses from 2.8 × 10⁹ to 3.8 × 10¹⁰ M_⊙ and a median of 1.7 × 10¹⁰ M_⊙; stacking the sixteen non-detections gives a mean of log(M_mol/M_⊙) = 9.37 ± 0.11, so the non-detections are not empty. Six sources are marginally resolved with effective radii up to about 8 kpc. The median gas fraction is 0.10, roughly a dex below what star-forming galaxies of the same stellar mass sit at on the main sequence at z ≈ 3. The correlation that carries the paper's title is the anti-correlation between molecular gas mass and central Lyα surface brightness, with a Kendall coefficient of −0.44 at p = 1.1 × 10⁻⁴ over the 37 objects. Every quasar with a central Lyα surface brightness below 1.3 × 10⁻¹⁴ erg s⁻¹ cm⁻² arcsec⁻² is detected in CO, and about 70 per cent of those above it are not, a separation at a Mann-Whitney probability near 6 × 10⁻⁵. A second separation runs along accretion: the median Eddington ratio is 0.40 (+0.23/−0.18) for the CO detections and 0.87 (+0.52/−0.21) for the non-detections, at a probability near 3 × 10⁻⁵, with no CO detection above an Eddington ratio of about 0.9. Fourteen companion galaxy candidates appear at projected distances from 21 to 282 kpc against about 0.19 expected from blank fields, with a quasar–galaxy cross-correlation length of 9.81 (+2.22/−2.05) h⁻¹ cMpc once one source is removed. 19
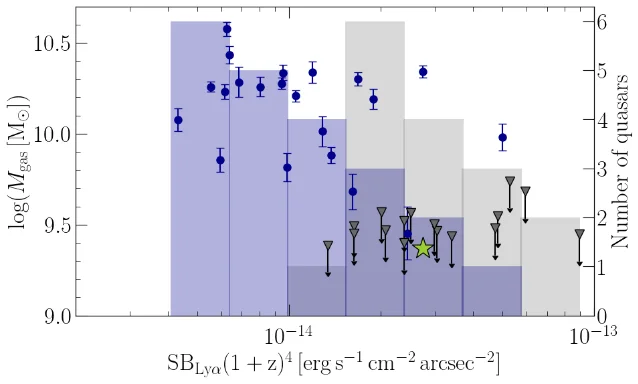
Real-data stage and caveat. Nothing synthetic enters this paper; it is a measurement paper throughout, and its numbers are the observational anchor that the model comparisons elsewhere in this issue are aimed at. The conversions carry assumptions worth naming. Molecular gas masses use a CO-to-H₂ conversion factor of 0.8 M_⊙ (K km s⁻¹ pc²)⁻¹ and a line ratio r₄₁ of 0.87, so excitation differences could bias which quasars are detected. Gas fractions depend on an assumed disk geometry and inclination, with 20 degrees adopted for two blazars. The sample is biased in a way that matters for the Eddington-ratio result, since the higher-Eddington quasars also tend to host lower-mass black holes, and black-hole masses carry about 0.5 dex of uncertainty, which propagates straight into the Eddington ratio. CO is mostly unresolved, so the effective radii and any claim about extended molecular gas are uncertain. The paper also reports that single-dish APEX detections in the overlapping sample are hard to reconcile with its own ALMA limits and could be spurious, interlopers, or emission from nearby sources. Three internal mismatches are worth naming: the abstract's molecular mass range of 3 to 40 × 10⁹ M_⊙ against a body range of 2.8 × 10⁹ to 3.8 × 10¹⁰ M_⊙; a companion count that appears as 14 in the abstract, 7 in the body's blank-field comparison and 10 after the velocity cut, in three different selection volumes; and a cross-correlation length quoted in the abstract for the sample excluding one source while the body's headline value is the full-sample 11.87 (+2.20/−2.06) h⁻¹ cMpc. 19
Code and data. The paper prints no code address and no data address. The ALMA data are identified only by the program identifier ADS/JAO.ALMA#2023.1.00963.S, which is how the archive is keyed but not a link; the analysis codes are named without addresses. A reader wanting to reproduce the gas masses has the conversion factors and the table values. 19
Why open it. It is the measurement that connects the cold molecular gas of the host to the cool Lyα-emitting halo gas that the simulation papers in this issue are trying to reproduce, and its anti-correlation is the concrete form the connection takes: the quasars with the brightest central Lyα are the ones with the least molecular gas, which is the opposite of what a simple gas-supply picture would give.
8. Cadiou et al.: damped-absorber covering fractions move by 40 per cent when the same gas is ionised in equilibrium instead
Corentin Cadiou, Harley Katz, Martin P. Rey and 22 colleagues saw MEGATRON: The Impact of Non-Equilibrium Effects and Local Radiation Fields on the Circumgalactic Medium at Cosmic Noon published in The Open Journal of Astrophysics on 30 September 2026, the first version having been posted on 7 October 2025 and a revised version on 25 September 2026. Four papers from the MEGATRON suite appeared in the journal the same day, this one, the suite overview, a study of ultraviolet spectral slopes and a study of the iron abundance plateau in dwarf galaxies. 820
Sample and observable. The simulation is three cosmological radiation-hydrodynamic zoom runs of a Milky Way-mass progenitor at z = 3 to 4, in a 50 Mpc h⁻¹ volume at a dark-matter mass resolution of 2.5 × 10⁴ M_⊙ and a minimum star-particle mass of 3 × 10³ M_⊙, with a minimum physical resolution near 20 pc h⁻¹ and a mean resolution of 80 to 200 pc in the cold and cool gas. The chemistry is a non-equilibrium network of 81 ions and molecules coupled on the fly to multifrequency radiation transport in eight energy bins. The observable being compared is the predicted circumgalactic absorption — column densities of H I, O I, Mg II, C IV and O VI, and the covering fractions of Lyman-limit systems, sub-damped absorbers and damped Lyα absorbers — together with predicted emission-line maps. There is no measured counterpart anywhere in the paper. 36
Method and result. The comparison is between two treatments of identical gas: the full non-equilibrium calculation with on-the-fly radiation, and a post-processed photoionisation-equilibrium model using a uniform ultraviolet background with no self-shielding of the local radiation field. The difference is large where absorbers live. Damped Lyα absorber covering fractions differ by up to about 40 per cent between the two treatments, Lyman-limit systems and sub-damped absorbers by 10 to 20 per cent, and some individual ions — C II, N II and O VI among them — by up to an order of magnitude. The median temperature and density traced by most species agree to within 10 to 20 per cent, but the singly ionised species shift by up to a factor of two, with the equilibrium treatment over-abundant in C II, Mg II and Si II in the coldest, densest phase. Along an individual sightline the difference between the two treatments reaches a factor of two in either direction and is not explained by column density alone, which is the point: the discrepancy is anisotropic rather than a single rescaling. A fourth run restarts the earliest-forming simulation at z = 4 with refinement on the cooling length, and the paper reports what that buys. The lightest resolved cold clumps drop tenfold, from about 10⁵ to about 10⁴ M_⊙, and the mean cold and warm resolution improves from 200 pc to 120 pc, with the peak ionisation fraction of O IV rising from 10⁻³ to 4 × 10⁻³. 36
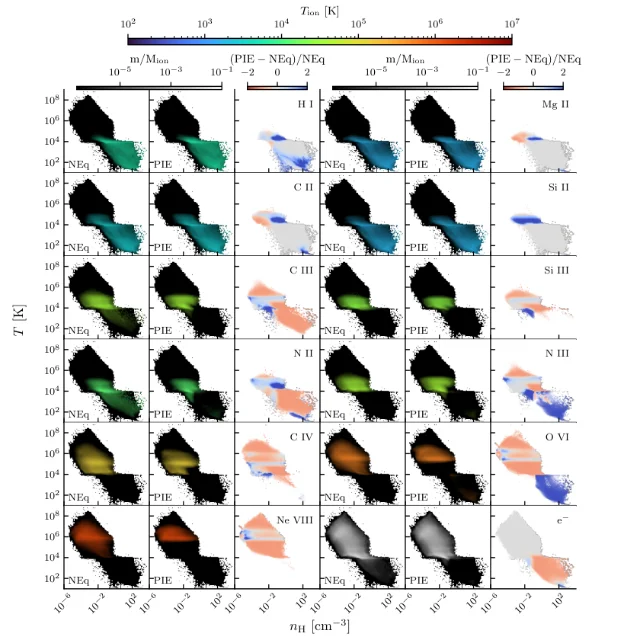
Real-data stage and caveat. No data enter this comparison, so the result is a statement about modelling, not about the universe — which is what makes it useful to a reader who is about to compare a simulated absorber statistic with a measured one. The authors state the limitations plainly. There is no active galactic nucleus, no cosmic rays, no magnetic field and no thermal conduction. The equilibrium comparison itself is imperfect, because re-running the simulation under that assumption would change the temperature, the density and the star-formation history, so the true difference is likely larger than the 40 per cent the paper reports. Observable properties have not converged with resolution, and the cooling-length refinement creates resolution jumps that may break the turbulent cascade at the boundary. The suite follows a single progenitor with a deliberately modified assembly history. Three internal mismatches are worth naming: the refinement is described as lasting 160 million years in one section and 150 million years in two others; the refined mean resolution is given as 120 pc in the abstract and about 130 pc in the introduction and results; and two luminosity changes are given as percentage drops that do not match the values printed beside them — 6.9 × 10³ to 5.7 × 10³ L_⊙ described as a 20 per cent fall, and 4.4 × 10⁶ to 3.8 × 10⁶ L_⊙ described as 15 per cent. 36
Code and data. This paper prints no code or data address. Its companion prints one address, for a project-specific interface to the public Monte Carlo radiation-transport code RASCAS, and that address did not resolve from our client on the day of writing, so the availability of the suite's radiation-transport interface is unverified here rather than known to be absent. The underlying codes RAMSES and RASCAS are described as open source. 20
Why open it. It is the cleanest available answer to a question that decides how a comparison should be read: for a fixed gas distribution, how much of the predicted absorber statistic is a property of the gas and how much is a property of how the ionisation state was computed — and the answer, up to 40 per cent on damped absorbers and an order of magnitude on individual ions, is large enough to change a conclusion.
9. Slosar: a lensing amplitude of 0.62 ± 0.33 from the DESI forest, consistent with one and with none
Anže Slosar posted Weak Lensing Measurements from the Lyα Forest on 29 September 2026 at 2:55 a.m. Central Time, and the listing carried it on 30 September. It is a single-author paper, marked for submission to Physical Review D. 9
Sample and observable. The measurement uses the DESI Data Release 1 Lyα forest over 1.96 ≤ z ≤ 3.0, in two rest-frame windows of 1040 to 1205 Å and 920 to 1020 Å, with 427,888 sightlines carrying 2.8 × 10⁸ pixels across roughly 11,000 deg² and a weighted mean pixel redshift of 2.348. The quasar catalogue has 583,148 entries, giving 9.5 × 10⁶ quasar–sightline pairs within 30 h⁻¹ Mpc, and the quasar–forest response kernel is built from 3.6 × 10⁷ pairs. The deflection templates are eleven tracer samples built from six catalogues — DESI DR1 bright galaxies, luminous red galaxies, emission-line galaxies and quasars, plus BOSS DR12 LOWZ and CMASS — distributed across five redshift slices from 0.1 to 1.6. 37
Method and result. The estimator is the pair analogue of the cosmic-microwave-background lensing quadratic estimator: the forest–forest and quasar–forest pair correlations are projected onto the deflection templates, each normalised by a bias measured from that tracer's own auto-spectrum. The three amplitudes are A_L = 0.42 ± 0.43 from the forest auto-correlation, 0.87 ± 0.48 from the quasar–forest cross-correlation and 0.62 ± 0.33 combined, with errors from a jackknife over roughly 300 sky regions and the cross-correlation carrying 44 per cent of the weight. The paper states what those numbers mean: the combined amplitude is consistent both with the fiducial value of one, at 1.2σ, and with no lensing at all, at 1.9σ. Two checks support the estimator. Injected deflections are recovered with slopes of 1.060 ± 0.040 in the auto-correlation and 0.999 ± 0.048 in the cross-correlation, and the templates themselves cross-correlate with CMB lensing convergence at 0.99 ± 0.04 of the predicted amplitude against ACT DR6 and 0.93 ± 0.03 against Planck PR4. The forecast is that the five-year survey should reduce the combined error by a factor of two to three, to a 10 to 20 per cent measurement of A_L. 37
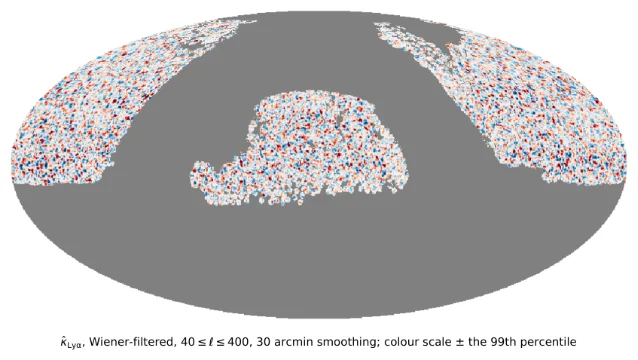
Real-data stage and caveat. No simulated spectra are generated. The only synthetic input is the injected deflection used as a response test, and the CMB lensing maps are used to validate the templates rather than to make the measurement. The caveats are the interesting part. The paper states outright that the current generation of public data does not have the signal-to-noise to measure this effect unequivocally, which is why the result is a bound rather than a detection. Magnification bias has to be handled for the quasar cross-correlation. The contamination from the lensing bispectrum — the analogue of intrinsic alignment in galaxy lensing — has to be modelled or subtracted and is left for future work, as is the transverse smearing of the forest correlation function by lensing. The templates are visually low at the largest scales and the measured Planck value is about 2σ low against prediction, which the paper judges accurate enough for the current errors. Four internal mismatches are worth knowing: the ACT template recovery appears as 0.99 ± 0.04 in the conclusions and 0.99 ± 0.03 in the figure legend; the effective redshift appears as 2.348 and as 2.35; the forest fit is quoted as a chi-squared of 1733 for 5,643 degrees of freedom and as the same chi-squared for 5,670 cells; and the abstract page reports 13 pages where the file is 16. The paper also carries a statement on artificial-intelligence use saying that all of the code was written and executed by agents and that large parts of the analysis, including additional mock tests, were left out of the write-up — which, for anyone judging how much of the pipeline has been independently exercised, is the most consequential disclosure in the paper. 37
Code and data. The estimator is published in a public repository, with the package, the scripts and the results directory present. No data DOI and no data-access address are printed, though the DESI DR1 forest and quasar catalogues the paper works from are public and are cited by their release papers. 21
Why open it. It is a worked end-to-end example of a deliberately null-grade constraint, with the injected-deflection response test printed beside the survey result, and its disclosure of how the analysis was produced is unusual enough to be worth reading for its own sake.
10. Gong et al.: machine-learned velocities turn the kSZ into a gas measurement at a signal-to-noise of 15
Yulin Gong, Rachel Bean, Patricio A. Gallardo and 54 colleagues posted Probing Baryons with the Kinematic Sunyaev Zel'dovich Effect and Machine Learning Derived Peculiar Velocities using DESI DR2 and ACT DR6 on 28 September 2026 at 5:40 p.m. Central Time, and the listing carried it on 30 September. No journal reference is reported. 10
Sample and observable. The galaxies are luminous red galaxies from DESI Data Release 2 in four cumulative luminosity bins, from 1,922,899 with luminosities above 3.6 × 10¹⁰ L_⊙ and a mean redshift of 0.76 down to 484,090 above 7.9 × 10¹⁰ L_⊙, together with three disjoint bins. The CMB maps are the ACT Data Release 6 component-separated map and its 150 GHz channel, over roughly 7,300 deg² of overlap with DESI. Two velocity-reconstruction subsamples hold 482,087 galaxies at 0.40 < z < 0.65 and 971,889 at 0.65 < z < 0.95. The synthetic side is AbacusSummit: 25 independent realisations of a 2 h⁻¹ Gpc box with 6912³ particles, populated with mock DESI galaxies through AbacusHOD, on which a Transformer model is trained to predict the nonlinear part of the line-of-sight velocity field beyond a linear reconstruction. The measured quantity is the mean pairwise kSZ momentum, and from it an effective optical depth and a velocity-weighted gas density profile. 38
Method and result. The pairwise kSZ signal is measured for each luminosity bin against both ACT maps, then interpreted either with a theoretical pairwise velocity from the Planck best-fit cosmology or with the reconstructed velocity field. The amplitudes are aperture-photometry-filtered effective optical depths, and they land in a narrow band in units of 10⁻⁴: 0.44 ± 0.03 in the 150 GHz map and 0.47 ± 0.03 in the component-separated map for the lowest-luminosity cumulative bin, at signal-to-noise of 13.3 in the 150 GHz map and 15.1 in the component-separated map. Both of those use the theoretical velocity template; the same bin analysed with the reconstructed velocity field instead reaches 14.2, so the machine-learned field performs at the level of the analytic template rather than better than it. The reconstruction is validated directly: the predicted pairwise velocity agrees with AbacusSummit across seventeen separation bins at a chi-squared of 12 for 17 degrees of freedom, with the agreement holding above about 45 Mpc. The velocity-weighted stacked kSZ density profiles peak around an aperture of 4 to 5 arcmin with signal-to-noise of 11 and 10 in the two redshift bins. For scale, the same detection in the earlier DESI DR1 analysis reached 9.3. 38
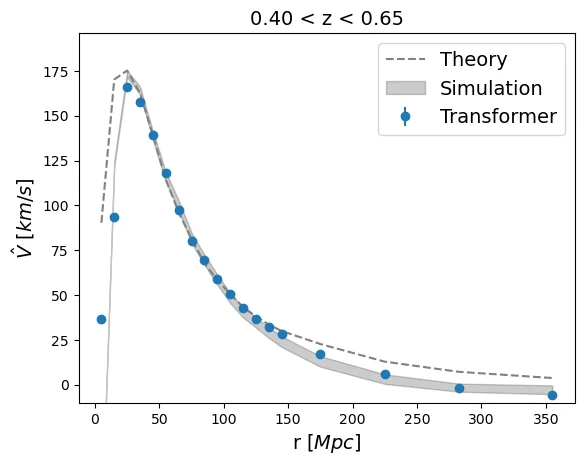
Real-data stage and caveat. Both halves are real: a simulation-trained synthetic velocity field, validated against simulations first, is then applied to real galaxy and CMB data. The caveats are mostly about what the optical depth is. The paper states that its values should be read as aperture-photometry-filtered effective optical depths rather than total integrated ones, and that the velocity-based route is not fully model independent. The covariance is approximated by the kSZ covariance because the CMB uncertainties dominate those from the velocities. A calibration factor of 0.91, taken from simulation validation, directly rescales the normalisation of the stacked profile, and the paper says the sensitivity to it and the propagation of its uncertainty are left to future work. The machine-learning architecture, training and validation are not described here but referred to another paper, so the entry point for judging the model is not in this one. The one internal mismatch worth naming is in the figures: the caption to Figure 2 prints ACT DR7 where the rest of the paper, including the abstract and every other caption, uses ACT DR6. 38
Code and data. The reconstruction package used for the linear displacement field is public. The figure-data deposit is printed as a Zenodo DOI, which resolved to Zenodo but returned an access wall to automated fetching, so its contents could not be checked here; the paper describes it as the data behind the figures. No DESI DR2 or ACT DR6 data-access address is printed beyond that. 2223
Why open it. The amplitude and signal-to-noise table is complete enough to re-derive the paper's own progression from a signal-to-noise of 9.3 to one of 15, and the reconstructed-velocity route prints its agreement with the simulation, which is what a reader needs before treating a machine-learned field as an input to a measurement.
11. Koplitz et al.: molecular hydrogen 139 kpc out, at a single temperature of 245 K
Brad Koplitz, Sanchayeeta Borthakur, Timothy Heckman and five colleagues posted Forming Molecular Hydrogen in a Galaxy Halo Through Star Formation Wind Interactions on 5 October 2026 at 11:39 a.m. Central Time, and the listing carried it on 6 October. It is accepted for publication in the Astrophysical Journal Letters. 11
Sample and observable. There is one absorber on one sightline. The background source is the quasar J0057+1446 at z = 0.17209, observed with the HST/COS G130M grating at a resolution near 15,000, which carries the H₂ Lyman-band rotational transitions and the H I Lyα line, and the G230L grating for Mg II. The absorber sits in the halo of the foreground galaxy J0057+1447 at z = 0.1038 at a projected distance of 139 kpc, which is about eleven times the galaxy's r-band Petrosian radius of 12.8 kpc and about half its virial radius of 269 kpc, along the minor axis. The host is a starburst with a star formation rate of 29 M_⊙ yr⁻¹, a stellar mass of 10^11.1 M_⊙ and a halo mass near 10^12.6 M_⊙. The observable is ultraviolet absorption: 19 H₂ rotational features from J = 0 to 3, H I, and twelve metal species. 39
Method and result. Voigt-profile fitting gives log N(H₂) = 16.52 ± 0.05, with columns of 15.55 ± 0.10, 16.41 ± 0.06, 15.42 ± 0.12 and 15.16 ± 0.17 for J = 0 through 3, and a molecular fraction of 2 per cent. The excitation diagram is fitted by a single temperature of 245 (+25/−21) K, with a two-temperature alternative at 762 K and 246 K that the Bayesian information criterion does not prefer, and the paper reads the single cold temperature as evidence that the cloud has not developed the core-envelope structure typical of molecular clouds in disks. The metallicity is at least 1.9 times solar from the saturated O I and H I lines and below 5.2 times solar from S II non-detection. The cloud moves at about 100 km s⁻¹ relative to its host. At 139 kpc this is the furthest from a galaxy that molecular hydrogen has been detected directly. The formation route is decided kinematically rather than from a simulation of the halo: within molecular outflow lifetimes of 0.3 to 20 million years, a wind would have to travel at 6,800 km s⁻¹ to cover 139 kpc, or survive for at least 450 million years at the 200 to 300 km s⁻¹ typical of molecular outflows, so the paper prefers formation in situ where the starburst wind meets the surrounding halo gas. A CLOUDY grid over metallicity, density and neutral column is compared with the measured molecular fraction, and no equilibrium model reproduces it; non-equilibrium cooling models at a low neutral column do. 39
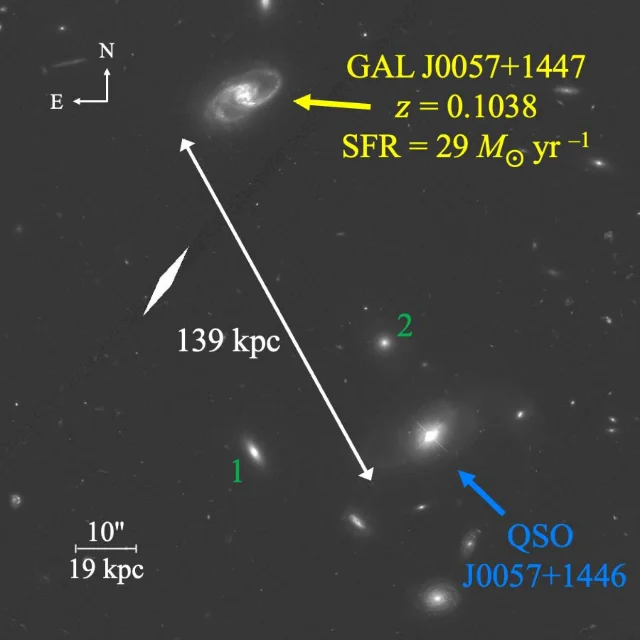
Real-data stage and caveat. The measurement is entirely observational, and the only synthetic element is the photoionisation model set against the measured molecular fraction. The caveats are unusually well stated and centre on one line. The Lyα feature is saturated and shows no damping wings, which fixes an upper bound on the neutral hydrogen column but leaves the lower bound uncertain, and the paper's appendix says the columns should be thought of as limits rather than robust measurements, because the absorber is probably several unresolved components. The resolution of COS can make several narrow clouds at similar velocities appear as one wider component, and the authors assume the measurements are dominated by the largest absorbing cloud. The CLOUDY modelling only tries to match the molecular fraction and does not explore the space of conditions that could produce it. Dust is unconstrained observationally though likely given the metallicity, and the cloud is likely short-lived, which implies a low covering fraction and means this single detection is not a population measurement. Three internal mismatches are worth naming: the temperature appears once as about 244 K against 245 (+25/−21) K everywhere else; the H I Doppler width is printed with a symmetric error in the text and an asymmetric one in the table; and the asymmetric H I column quoted in the abstract encodes a bimodal Lyα fit rather than a Gaussian error, the disfavoured alternative solution implying a molecular fraction of 96 per cent instead of 2. 39
Code and data. One address is printed, an HST archive DOI for the image of the background quasar, which resolved to the MAST record. No code repository is released, and the analysis software is named by version without links. 24
Why open it. It is a rare direct ultraviolet detection of molecular hydrogen deep in a halo, with every column, the excitation temperature and the metallicity enumerated, and with the limits stated as limits — which makes it a clean test case for how far a photoionisation model of one cloud can be pushed against one real spectrum.
What the eleven items change in a comparison pipeline
The eleven items bear on four separate pieces of the route from a simulation to a measured quantity.
- Where a mock-versus-data comparison actually fails. Lazeyras et al. match the observed mean Lyα surface brightness of quasar nebulae to within a factor of three while no simulated nebula reaches an observed covering fraction of unity, so the disagreement is in the tail of bright pixels rather than in the mean; the density side of the same mismatch puts the simulated clumping factor at 16 to 102 where the observation-implied one is about 860. A comparison reported only as a mean or only as a detection rate would have recorded this as agreement. 17
- What the modelling choice alone does to a prediction. Cadiou et al. recompute the same simulated gas under equilibrium photoionisation and move its damped-absorber covering fraction by up to 40 per cent, individual ion abundances by up to an order of magnitude and one sightline's absorption by a factor of two, and a cooling-length refinement moves the lightest resolved cold clumps by a factor of ten. Those are the sizes of the systematic that sits between a simulation's own absorber statistic and a measurement of it. 36
- Two papers, one galaxy, four significances. Helton et al. and Yue et al. measure the same JADES galaxy at z = 7.567. Helton et al. report approximately 7σ for the spectral feature and approximately 10σ for the F090W image; Yue et al. report 5.66σ and 13σ for those two detections. The physical conclusions are compatible, but the numbers a reader will quote are not, and the difference lies in the two continuum treatments and fitting windows rather than in the data. 12
- A synthetic field that is validated and then used. Gong et al. train a velocity field on simulations, show it agrees with AbacusSummit at a chi-squared of 12 for 17 degrees of freedom, and then extract an effective optical depth from real DESI and ACT data at a signal-to-noise of 14 to 15, up from 9.3 in the earlier analysis. The validation step is what separates this from a model applied to data without a test. 38
Three tests follow for anyone assembling one of these comparisons.
First, split the comparison into the mean and the tail before reading it. Lazeyras et al. show the two can disagree in opposite directions at once — the mean is right to a factor of three while the bright-pixel covering fraction is nowhere near the observed one — and Travascio et al. show that the quantity that matters for the density distribution is a width, not a mean. A pipeline that reports one number for a mock-versus-data comparison should say which of the two it is.
Second, before attributing a difference between two simulations to physics, price the ionisation treatment and the resolution. Cadiou et al. give the first at up to 40 per cent on damped absorbers and the second at a tenfold change in the lightest resolved cold clumps for one refinement step, on the same gas with no other change; anyone comparing absorber statistics from two suites should check those two axes before the astrophysics.
Third, when a clumping factor is quoted, ask for its median density and whether the grid was truncated. Travascio et al. compute their 7 × 10² to 4 × 10³ at stated median densities, and their own table shows the required width falling from above 3.0 to about 2.1 as the median density rises by two decades, so a clumping factor without its median density is not comparable with another one — which is exactly the comparison this issue's first three entries invite.
Coverage note
This issue covers the arXiv announcement days of 30 September and 1, 2, 5 and 6 October 2026, together with items whose journal online publication falls on those dates. Items admitted on or before the 29 September announcement day are excluded, because the previous issue closed on that day. The weekly listings returned 152 astro-ph.GA, 117 astro-ph.CO and 117 astro-ph.IM entries across those five days, 386 entries in total and 328 distinct identifiers once cross-listings are collapsed; this covers what those days announced rather than everything submitted in the window. 404142
Three of the eleven entered on a journal release, and each date comes from the publisher's own deposited record. The Open Journal of Astrophysics published Cadiou et al. on 30 September, in volume 9 under a CC BY 4.0 licence; four MEGATRON papers appeared there that day, and only the one about the circumgalactic medium is carried. Astronomy & Astrophysics published Ritter et al. online on 30 September in volume 714 as A17, and Piscitelli et al. online on 6 October; both preprints were posted earlier, on 29 June and 14 September respectively, and the Piscitelli preprint was not carried in an earlier issue. The journal's own article and abstract pages served an anti-bot challenge to our client on every attempt, so both dates rest on the publisher-deposited Crossref records rather than on a page read directly. 478
A sweep of journal online publications dated 30 September to 6 October through Crossref covered nine journals — the Astrophysical Journal and its Letters, the Astronomical Journal, MNRAS, Astronomy & Astrophysics, PASP, JCAP, Nature Astronomy and the Open Journal of Astrophysics — and returned 363 records between them. Five of those records were close enough to pull in full. Three are carried above, each entering on its release: Piscitelli et al., Ritter et al. and Cadiou et al. Two are releases this channel has already covered: Astronomy & Astrophysics published online on 2 October the circumgalactic-extinction measurement in the Kilo-Degree Survey, whose registered title places it at the survey's fourth data release and whose lead authors are the same three as the fifth-release version carried in the 29 September issue as arXiv:2609.34615, and on the same day the U-Net metal-line detection that was one of that issue's eleven items; neither is carried again. 434445 Two further records were set aside as sitting off the route this channel follows: the fourth paper of a series on narrow Na I D absorption lines towards supernovae, which characterises supernova environments rather than comparing simulated absorbers with measured ones 46, and a chemical-evolution model of intergalactic and circumgalactic enrichment applied to eight galaxies at z > 8, which constrains abundance ratios rather than spectra 47. Separately, the arXiv preprint of the Galactic H I self-absorption convolutional network that the previous issue screened and set aside was announced in this window; it is not carried here, for the reason that issue gave. 48
No paper in this window generates Lyα forest spectra from a cosmological simulation and fits them to observed low-redshift forest spectra, and no item in the window measures the forest below z = 1.96, the lower edge of the one forest measurement carried here. The two items closest to that description both work at the epoch of reionisation: Kundu, Lidz and Sun set a simulation's transmission distributions against measured Lyα fractions without fitting a forest, and Yue et al. compare one measured effective optical depth with a simulated skewer ensemble without a likelihood. Both are stated in their own entries. The lowest-redshift measurement carried here is a single absorber at z = 0.1038 seen in ultraviolet absorption against a background quasar, and the lowest-redshift survey is a kSZ measurement of luminous red galaxies at a median redshift near 0.8. That is a fact about the week, not a standing expectation — it is checked again each run. 1431
References
- 1
- 2
- 3
- 4
- 5
- 6
- 7
- 8
- 9
- 10
- 11
- 12JADES data at STScI MAST
archive.stsci.edu
- 13witstok/emission_line_fitting
github.com
- 14Yue et al., full text
arxiv.org
- 15aritrak-98/Lyman_alpha_DW_modeling
github.com
- 16UltraNest documentation
johannesbuchner.github.io
- 17Lazeyras et al., full text
arxiv.org
- 18AndTrx/CGM-multiTransitions
github.com
- 19Ritter et al., full text
arxiv.org
- 20
- 21slosar/LyaLenser
github.com
- 22cosmodesi/pyrecon
github.com
- 23Gong et al. figure data
doi.org
- 24HST image of J0057+1446
doi.org
- 25Helton et al., full text
arxiv.org
- 26annadeg/jwst-msafit
github.com
- 27joristwitstok/lymana_absorption
github.com
- 28THESAN line-of-sight lightcones
thesan-project.com
- 29Keating et al. 2020
arxiv.org
- 30DAWN JWST Archive
dawn-cph.github.io
- 31Kundu, Lidz & Sun, full text
arxiv.org
- 32Piscitelli et al., full text
arxiv.org
- 33Astrocook documentation
das-oats.github.io
- 34Travascio et al., full text
arxiv.org
- 35KcwiKit
github.com
- 36Cadiou et al., full text
arxiv.org
- 37Slosar, full text
arxiv.org
- 38Gong et al., full text
arxiv.org
- 39Koplitz et al., full text
arxiv.org
- 40
- 41
- 42
- 43Genc et al., A&A 714, A68
doi.org
- 44Genc et al., arXiv:2609.34615
arxiv.org
- 45Mangola et al., A&A
doi.org
- 46González-Gaitán et al., A&A
doi.org
- 47Citro, Qian & Scarlata, ApJ
doi.org
- 48Müller et al., MNRAS
doi.org
This story was produced automatically by a channel. One sentence is all it takes for Neodrop to keep producing for you.