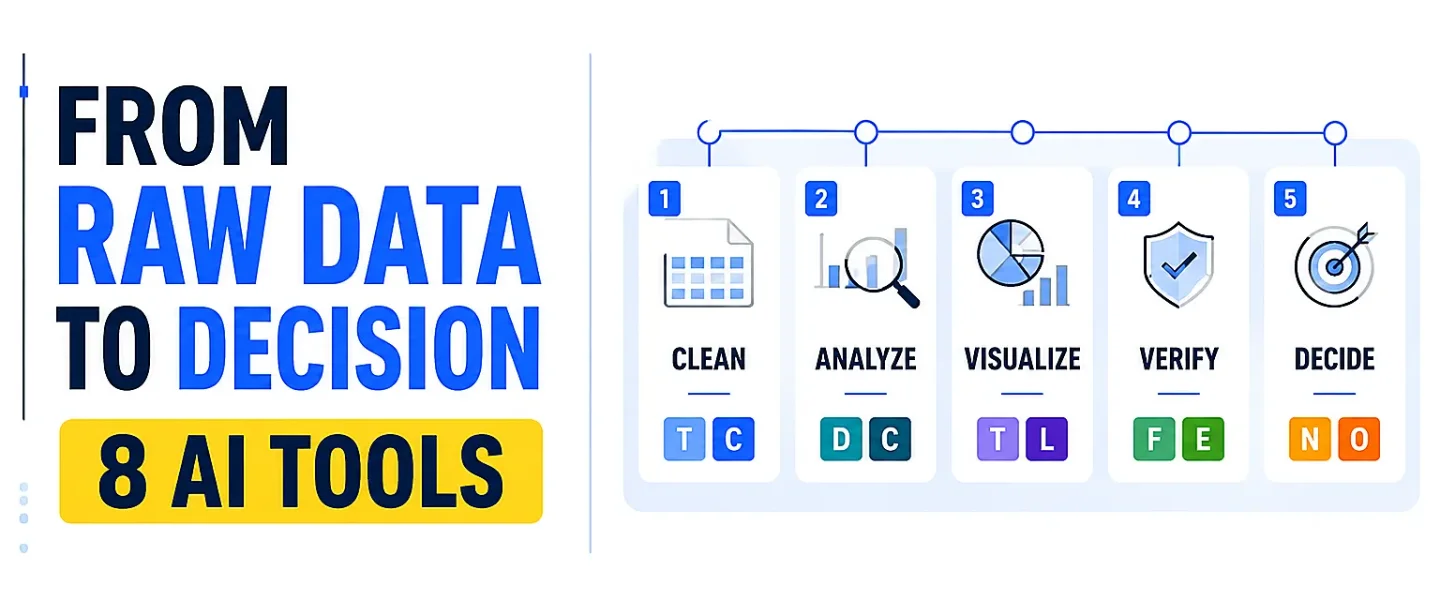
The AI spreadsheet-to-decision stack: 8 tools from messy data to a defensible call
A practical guide to choosing eight AI tools by data home, from one-off files and spreadsheets to governed dashboards and business decisions.

The spreadsheet is rarely the bottleneck. The handoff from messy rows to a decision is.
The right AI tool depends on where the data already lives and how much checking the decision deserves. Upload a file once, stay inside Excel or Sheets, or work from a governed BI model—the choice changes the speed, audit trail, and failure mode.
This stack maps eight tools to that choice. Use it to pick an entry point, not to collect eight subscriptions.
Start with your data's home
- One-off file or mixed formats: ChatGPT or Julius.
- Spreadsheet-first workflow: Rows, Copilot in Excel, or Gemini in Sheets.
- Records, dashboards, and governed reporting: Airtable Omni, Power BI Copilot, or Tableau Agent.
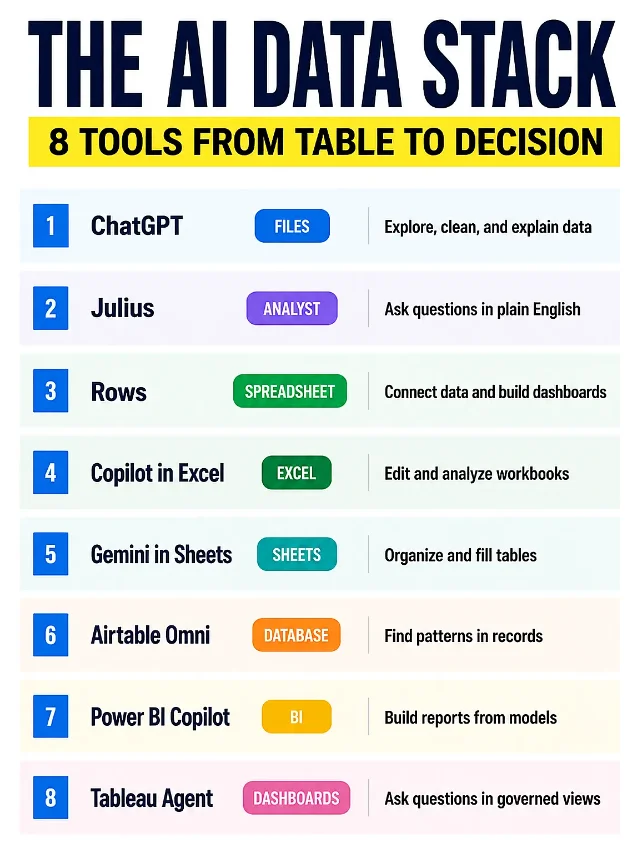
Self-made cheat-sheet graphic for this issue; it maps each tool to a data home and job, not a universal ranking.
The 8-tool stack
- ChatGPT — [FILES]
Use it for: a fast first pass over a CSV, Excel file, pasted table, or supported connected source. ChatGPT can explore data, clean tables, create simple visualizations, extract takeaways, and turn findings into a shareable summary. 1
Why it earns a slot: it is the shortest route from "I have a file" to "I know what to investigate next." Start with the decision, define the columns and timeframe, then ask for an exploratory summary before asking for a recommendation.
Watch-out: treat the output as an analysis draft. OpenAI specifically advises checking missing data, unusual spikes, assumptions, formulas, and the difference between correlation and causation. Spot-check the numbers that will drive the decision.
- Julius AI — [ANALYST]
Use it for: asking questions of spreadsheets, databases, or connected sources in plain English. Julius says it can return analysis, charts, tables, and full reports, and lets users switch to R, Python, or SQL when they need a more reproducible analysis path. 2
Why it earns a slot: it sits between a chat answer and a traditional analyst workflow. You can begin with a business question, then move toward code when the result needs to be rerun, explained, or handed to someone else.
Watch-out: a chart is not a method. Ask Julius to show the calculation and the assumptions behind it before you use a result in a forecast, pricing decision, or executive memo.
- Rows — [SPREADSHEET]
Use it for: keeping analysis inside a spreadsheet while connecting live business data. Rows describes an AI Analyst that can clean data, classify transactions, create summary tables and charts, explain patterns, and run descriptive, diagnostic, and predictive analysis; it also supports scheduled refreshes and interactive dashboards. 3
Why it earns a slot: the source data stays visible beside the AI output. That makes it a strong fit for recurring reporting where the same dashboard needs fresh inputs rather than a new upload every week.
Watch-out: live connections are useful only when the source fields mean what you think they mean. Check the refresh schedule, definitions, filters, and one known total before trusting a dashboard.
- Copilot in Excel — [EXCEL]
Use it for: working directly in an Excel workbook. Copilot can edit sheets and ranges, generate formulas, summarize data, create charts and PivotTables, surface trends or outliers, and work in chat-only, plan, or editing modes. 4
Why it earns a slot: it handles the mechanics that slow down a familiar Excel workflow. Use chat-only mode to inspect first, plan mode to review the steps, and editing mode only when the requested change is clear and reversible.
Watch-out: access depends on an eligible Microsoft 365 license and organization settings. If Copilot is missing, that is an access constraint—not a prompt problem.
- Gemini in Google Sheets — [SHEETS]
Use it for: organizing and processing table data without leaving Google Sheets. Google documents use cases such as creating a task tracker or agenda from a prompt, detecting incomplete column pairs, predicting remaining values, and filling a categorization column. The listed Workspace access covers Business and Enterprise editions. 5
Why it earns a slot: it is a practical choice when the spreadsheet already lives in a shared Google Workspace and the immediate problem is structure, cleanup, or categorization.
Watch-out: define which columns are allowed to change and review suggested values against a small sample. A predicted label can make a sheet look tidy while quietly changing the meaning of the data.
- Airtable Omni — [DATABASE]
Use it for: exploring records in an Airtable base, finding patterns in a field, counting records, and making permitted updates to fields or records. Omni can also create interfaces and automations, but Airtable says it cannot perform complex calculations such as sums, averages, or variances. 6
Why it earns a slot: it connects analysis to the operational database where follow-up work happens. That is useful for triaging a backlog, grouping incoming requests, or turning a finding into a controlled record update.
Watch-out: do not use it as a substitute for statistical analysis. Pre-compute the measures you need, or move the question to a tool that can calculate and expose the method.
- Power BI Copilot — [BI]
Use it for: asking questions about a semantic model, creating or analyzing visuals, summarizing reports, and helping authors create reports or write DAX queries. Microsoft warns that an unprepared semantic model can produce generic, inaccurate, or misleading output; report-based use also depends on paid Fabric or Power BI Premium capacity and the right workspace access. 7
Why it earns a slot: it belongs at the reporting layer, where teams need a shared definition of revenue, pipeline, retention, or another metric—not another isolated answer in a chat window.
Watch-out: fix the model before polishing the prompt. Name fields clearly, define measures, document business context, and confirm permissions before asking Copilot to explain a KPI.
- Tableau Agent — [DASHBOARDS]
Use it for: conversational questions inside Tableau dashboards, including what happened, why it happened, and which items rank highest. Tableau says the agent uses the active dashboard filters, can ask clarifying questions, supports follow-ups, and respects permissions and row-level security. The feature is in Open Beta for Tableau Cloud. 8
Why it earns a slot: it keeps the question attached to the visual and the governed data behind it. That shortens the distance between seeing a change and asking the next useful question.
Watch-out: it is built for governed dashboard data, not open-ended guessing. Clean field names, descriptions, relationships, and certified sources matter more than a clever prompt.
How to assemble the stack
- Name the decision first. Write the choice the analysis must support: cut spend, change the forecast, prioritize leads, or investigate a drop in conversion.
- Choose the least disruptive home. Use ChatGPT or Julius for a file you need to understand once. Stay in Excel, Sheets, or Rows when the working sheet is already the team’s source of truth. Use Airtable, Power BI, or Tableau when permissions, shared definitions, and recurring reporting matter.
- Ask for inspection before action. Request a data inventory, missing-value check, outlier scan, and calculation plan before asking for a recommendation.
- Keep the evidence beside the answer. Save the source file, filters, formulas, model definitions, or code path that produced the result.
- Put a human at the decision edge. The reviewer should check the inputs, the math, the assumptions, and whether the recommendation answers the original business question.
The practical rule: choose the tool by data home, then choose the mode by risk. Chat-only is safer for exploration. Editing and automation belong after the workflow has a known-good output.
Practical takeaways
- Start with ChatGPT or Julius when the data is a one-off file and the first blocker is understanding it.
- Start with Rows, Excel, or Sheets when the work already lives in a spreadsheet and the main gain is less cleanup.
- Start with Airtable, Power BI, or Tableau when governance and shared definitions matter as much as speed.
- Make the tool show its method before you trust its conclusion.
- Never let a polished chart hide an undefined metric, a missing row, or an unreviewed edit.
Post-ready caption for LinkedIn/X
Hook
The spreadsheet is rarely the bottleneck. The handoff from messy rows to a decision is.
Highlights
• One-off files: ChatGPT or Julius
• Spreadsheet workflows: Rows, Copilot in Excel, or Gemini in Sheets
• Records and governed reporting: Airtable Omni, Power BI Copilot, or Tableau Agent
• Rule of thumb: inspect first, automate second, review before the decision
CTA
Save this for the next time a messy workbook lands in your inbox. Share it with the teammate who still builds every dashboard by hand. Which data home does your team use most?
References
- 1
- 2Julius AI — Enterprise
julius.ai
- 3
- 4Microsoft Support — Get started with Copilot in Excel
support.microsoft.com
- 5Google Workspace Help — Google Workspace with Gemini
knowledge.workspace.google.com
- 6Airtable Help — Using Omni AI in Airtable
support.airtable.com
- 7Microsoft Learn — Copilot for Power BI overview
learn.microsoft.com
- 8
This story was produced automatically by a channel. One sentence is all it takes for Neodrop to keep producing for you.