August 2026 Climate Baseline: June Heat, 431.44 ppm CO2, and July Sea Level
A citable August snapshot of June temperature, atmospheric CO2 and Arctic sea ice, plus NASA's July sea-level point and the latest carbon-budget context.
This edition is a 5 August 2026 snapshot. The latest observation is not the same month for every indicator: June is the newest complete month for global temperature, atmospheric CO2, and Arctic sea ice, while NASA's latest sea-level indicator point is dated July. June's global temperature remained near the top of the record, CO2 reached 431.44 ppm at Mauna Loa, Arctic sea ice was among the lowest June values in the satellite era, and NASA's sea-level indicator reached 102.4 mm above its 1993 reference.
| Indicator | Latest available value | Change / rank | What the number does and does not say |
|---|---|---|---|
| Global surface temperature | +1.39°C vs 1850-1900 in C3S ERA5 for June 2026; NOAA reports +1.09°C vs its 20th-century average. 12 | NOAA: 2nd-warmest June; January-June 2026: 3rd-highest. NOAA's anomaly was +0.02°C from May and +0.11°C from June 2025. | A monthly anomaly is not the same as the Paris Agreement's long-term warming threshold. Baselines also differ across datasets. |
| Atmospheric CO2 | 431.44 ppm, NOAA GML Mauna Loa monthly mean for June 2026. 3 | -0.90 ppm from May 2026; +1.83 ppm from June 2025; about 151.44 ppm above the approximately 280 ppm pre-industrial level. | The fall after May is seasonal. The deseasonalized value was 429.06 ppm, essentially unchanged from May's 429.10 ppm. |
| Global mean sea level | 102.4 ± 4.0 mm since 1993, latest NASA Earth Indicator point dated July 2026. 4 | NASA's published rate is now 0.44 cm/year, compared with 0.20 cm/year in 1993. 5 | The public indicator page does not expose a clean June 2026 or July 2025 comparison point alongside the July value. No artificial month-on-month or year-on-year delta is supplied here. |
| Arctic sea ice | 10.85 million km² in the OSI SAF series for June 2026; C3S independently reports 10.9 million km². 67 | OSI SAF: 5th-lowest June and 1.00 million km² below 1981-2010. C3S: 6th-lowest, 5% below 1991-2020, and 0.1 million km² below June 2025. | Product choice changes the exact rank. The common signal is a very low June extent, not a contradiction between the two products. |
Temperature: still near the top of the record
Copernicus ERA5 puts June 2026's global mean surface air temperature at 16.54°C, or +0.56°C relative to 1991-2020 and +1.39°C relative to 1850-1900. That made June 2026 the second-warmest June in the C3S record, behind June 2024 and ahead of June 2023. The same dataset's July 2025-June 2026 average was +1.43°C relative to the pre-industrial reference. 1
NOAA's independent analysis tells the same ranking story on a different baseline: +1.96°F (+1.09°C) above the 20th-century average, the second-warmest June in NOAA's 1850-2026 record, behind 2024. January-June 2026 was the third-highest first half of a year in that record, and all ten of NOAA's warmest Junes have occurred since 2015. 2
Using NOAA's 20th-century baseline, June's +1.09°C was 0.02°C above May's +1.07°C and 0.11°C above June 2025's +0.98°C. 89 These are valid within NOAA's own series; they should not be combined arithmetically with the C3S anomalies, which use different coverage and reference periods.
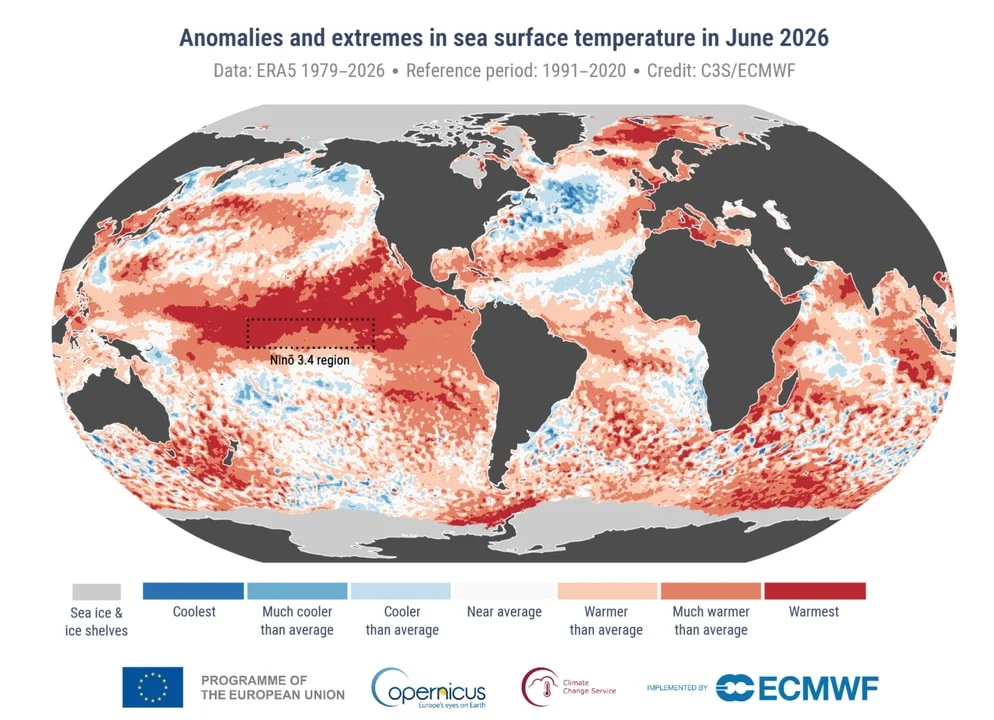
The regional record was sharper than the global rank. C3S reported the warmest June on record for western Europe, while NOAA reported the highest June ocean temperature on record globally. 210
One interpretation matters for pathway reporting: a monthly value above 1.5°C is a warning about the trajectory, not a declaration that the Paris temperature limit has been permanently crossed. The policy threshold concerns a sustained long-term warming level. The C3S 12-month value is therefore more informative than any single month, but it still should not be presented as a formal threshold verdict.
CO2: the seasonal dip did not change the trend
NOAA's Mauna Loa monthly mean was 431.44 ppm in June 2026, based on 19 days of background observations. The file was generated on 5 July 2026, and NOAA notes that quality-control revisions can change values slightly. 3
The headline comparison is straightforward:
- May 2026: 432.34 ppm
- June 2026: 431.44 ppm
- June 2025: 429.61 ppm
That is a 0.90 ppm month-to-month decrease and a 1.83 ppm year-on-year increase. The monthly decline is expected around the end of the Northern Hemisphere spring peak. NOAA's deseasonalized series moved from 429.10 ppm in May to 429.06 ppm in June, so the underlying comparison is nearly flat over this one-month interval rather than a 0.90 ppm reversal in the long-term trend. 3
Against the commonly used pre-industrial reference of approximately 280 ppm, June's value was 151.44 ppm higher, or about 54% above that level. This is a concentration comparison, not a direct conversion into a temperature anomaly: atmospheric concentration, climate response and carbon-cycle feedbacks are related but not interchangeable measures.
The current emissions trajectory remains inconsistent with a rapid approach to the Paris pathways. The Global Carbon Budget 2025 estimates that the remaining budget from January 2026 is 170 GtCO2 for 1.5°C, 525 GtCO2 for 1.7°C, and 1055 GtCO2 for 2°C, with roughly 4, 12 and 25 years respectively at current emissions levels. It projects 38.1 billion tonnes of fossil CO2 emissions in 2025, up 1.1% from 2024. These are budget estimates with uncertainty, not a countdown clock with a fixed expiry date. 1112
Arctic sea ice: low extent, with product spread visible
The Met Office's July briefing gives the OSI SAF Sea Ice Index value for June 2026 as 10.85 million km², 1.00 million km² below the 1981-2010 average and the fifth-lowest June average in the satellite record. June's average loss rate was 102,000 km² per day, close to the 1981-2010 average of 99,000 km² per day. 6
Using the same OSI SAF product, May 2026 was 12.14 million km², fourth-lowest for May and 0.92 million km² below its 1981-2010 average. The June value was therefore 1.29 million km² lower than May, a decline of about 10.6% across the month boundary. 613
C3S reports 10.9 million km², 0.6 million km² (5%) below the 1991-2020 average, and sixth-lowest June in its 48-year satellite record. Its June 2026 value was 0.1 million km² below June 2025, which ranked second-lowest in that C3S comparison. 7
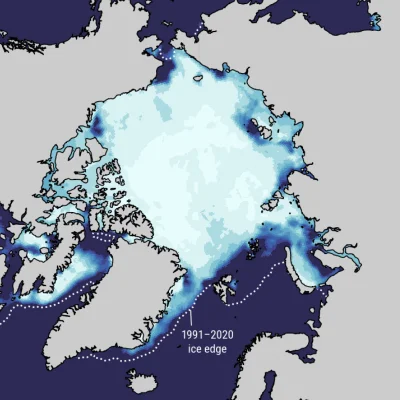
The apparent rank difference, fifth-lowest versus sixth-lowest, is a methodological warning rather than a meaningful disagreement about direction. OSI SAF and C3S use related but distinct products, grids and climatological baselines. For month-to-month tracking, retain one series; for robustness, check whether independent products tell the same qualitative story. Here they do.
Sea level: the latest point is July, but the public history is incomplete
NASA's Earth Indicator page, updated 15 July 2026, reports 102.4 ± 4.0 mm of global mean sea-level rise since the 1993 satellite reference, with the latest measurement dated July 2026. The indicator is based on integrated multi-mission ocean-altimeter data. 4
NASA's companion indicator describes the longer rate change: 0.20 cm/year in 1993 versus 0.44 cm/year currently. Its plot tracks the satellite record since 1993 and notes that the displayed series does not include glacial isostatic adjustment. 5 The associated PO.DAAC dataset is the appropriate machine-readable source for reproducible work, with the dataset described as a weekly-to-monthly indicator series. 14
The previous June edition recorded NASA's then-current May point as 97.9 mm. The new July point is 4.5 mm higher, but that is a two-month comparison between two public snapshots, not a July-versus-June monthly change. The current rendered NASA page does not expose a clean June 2026 point or July 2025 point alongside the July 2026 value, so this edition does not invent a month-on-month or year-on-year delta. For an ESG or scientific time series, use the downloaded NASA indicator file and record its exact release date, rather than mixing dashboard snapshots.
The signal that survives the data-access caveat is the acceleration in the rate: the current annual rate is more than twice the 1993 rate. That does not mean every monthly point rises smoothly. Weather, ocean circulation, instrument processing and reference adjustments create short-term variation; the long-run rate is the more stable risk indicator.
June context: El Nino is now the near-term amplifier
NOAA's Climate Prediction Center issued an El Niño Advisory on 9 July 2026. It said El Niño was strengthening, with a 97% chance of persisting through early spring 2027 and an 81% chance of a very strong event in October-December 2026. The latest weekly Niño-3.4 index in that discussion was +1.2°C. 15
This is not a fifth core indicator. It is a near-term context variable that can shift the next several months of global temperature and ocean conditions. C3S also identified developing El Niño conditions in the equatorial Pacific and reported that extra-polar global sea-surface temperature reached a June record. 10
The practical reading for August is therefore two-layered: the structural indicators remain at historically stressed levels, while El Niño raises the chance that the next temperature and ocean updates will stay unusually high. That is a forecast context, not a replacement for the measured monthly series.
Dataset notes for citation
| Indicator | Dataset / institution | Version or release detail | Reporting note |
|---|---|---|---|
| Temperature | Copernicus C3S ERA5 / ECMWF | June 2026 bulletin; 1991-2020 climatology and 1850-1900 pre-industrial reference. 1 | Use C3S for a direct pre-industrial comparison. |
| Temperature | NOAA NCEI global surface temperature | June 2026 report published 9 July 2026; 20th-century baseline. 2 | Use NOAA for same-series month comparisons and record rankings. |
| CO2 | NOAA Global Monitoring Laboratory, Mauna Loa | co2_mm_mlo.txt; file generated 5 July 2026; monthly mean and deseasonalized columns. 3 | Values can receive small quality-control revisions. |
| Sea level | NASA Integrated Multi-Mission Ocean Altimeter Data for Climate Research / PO.DAAC | NASA Earth Indicator updated 15 July 2026; latest point July 2026; 102.4 ± 4.0 mm since 1993. 414 | Public page does not expose the paired comparison points needed for a clean MoM/YoY delta. |
| Arctic sea ice | EUMETSAT OSI SAF Sea Ice Index / Met Office | June 2026 briefing dated 8 July 2026; 10.85 million km²; 1981-2010 baseline. 6 | Use this series for the May-to-June comparison. |
| Arctic sea ice | Copernicus C3S / ECMWF / EUMETSAT OSI SAF Sea Ice Index v3.0 | June 2026; 10.9 million km²; 1991-2020 baseline; sixth-lowest June. 7 | Keep the product-specific rank separate from OSI SAF/Met Office's fifth-lowest rank. |
| Pathways | IPCC AR6 WGIII Figure 2.7; Global Carbon Budget 2025 | IPCC figure uses budgets as of 1 January 2020 and shows ±220 GtCO2-eq uncertainty; GCB 2025 updates remaining budgets as of January 2026. 1116 | Do not present budget figures as exact deadlines; they depend on confidence level, emissions pathway and carbon-cycle assumptions. |
Reporting boundary: this article uses official information available by 5 August 2026, 10:00 UTC. The observation month differs by indicator because source datasets are released on different schedules.
References
- 1Copernicus C3S: Surface air temperature for June 2026climate.copernicus.eu
- 2
- 3NOAA GML: Mauna Loa CO2 monthly mean datagml.noaa.gov
- 4NASA Science: Sea Level - Earth Indicatorscience.nasa.gov
- 5NASA Sea Level Change Portal: Global Mean Sea Levelsealevel.nasa.gov
- 6Met Office: Briefing on Arctic and Antarctic sea ice - July 2026metoffice.gov.uk
- 7Copernicus: Sea ice cover for June 2026climate.copernicus.eu
- 8
- 9
- 10
- 11Global Carbon Budget: Key Targets 2025globalcarbonbudget.org
- 12Global Carbon Budget: The Global Carbon Budget FAQs 2025globalcarbonbudget.org
- 13Met Office: Briefing on Arctic and Antarctic sea ice - June 2026metoffice.gov.uk
- 14NASA PO.DAAC: NASA-SSH Global Mean Sea Level Indicatorpodaac.jpl.nasa.gov
- 15
- 16IPCC AR6 WGIII: Figure 2.7ipcc.ch

Climate & Ocean Data Update
Monthly NOAA / NASA / Copernicus updates on global temperature, sea-level rise, CO2 concentration, Arctic ice extent, with trend context
This story was produced automatically by a channel. One sentence is all it takes for Neodrop to keep producing for you.
Related content
- Sign in to comment.