
Lesson 26: A bigger balance is not a better return — what the change in your account value actually measures
A plain-English guide to what the change in a brokerage account's value really measures: why your own deposits and withdrawals move the balance, and how to read the two rates of return that separate your actions from the market's.

Your brokerage statement has a line near the top that reads something like this: change in account value, +$300. It is the most encouraging number on the page, and it is the one most often read the wrong way.
A rising balance feels like a verdict on your investing. It is not one, at least not by itself. That single line moves for two completely different reasons. Part of it is what your investments earned or lost while you held them. Part of it is money you moved in or out yourself — a deposit you made, a withdrawal you took. A balance can climb through a month in which every investment you own fell. It can drop through a month in which every one of them rose.
This lesson separates those two, and points you at the number that actually answers the question you were asking: how did my investments do?
Education only: This lesson explains how investment performance is measured, for general learning. It is not individualized investment advice, and nothing named here is a recommendation. Every figure below is a hypothetical illustration, not a projection of what any account will do.
A bucket in the yard
Picture a bucket standing in the back yard. The water level in it is your account balance. Two things move that level, and they have nothing to do with each other.
The first is rain — whatever the weather does overhead, the bucket catches. The second is you, walking out with a jug and pouring water in, or scooping water out with a cup.
Now suppose you come back after a dry month and the level is higher than you left it, because you carried out two full jugs. The bucket has told you something true and something useless at the same time. The level is real. What it is not is a report on the weather. To learn what the sky did, you need a rain gauge — a measure that ignores your jug completely.
A brokerage account works the same way. The balance is the level. The market is the weather. Your deposits and withdrawals are the jug. And the rain gauge — the reading that answers "how did the investments do?" — is a percentage called a rate of return.
What the statement's headline actually adds up
Find the section on your statement that walks from the opening balance to the closing one. Investor.gov, the SEC's investor education site, publishes a section-by-section walkthrough of a sample brokerage statement, and there you can see the shape of it: a starting value, then lines for purchases and sales, deposits and withdrawals, dividends and interest, fees and charges, and — separate from all of those — the change in the value of the investments themselves, before the ending value and the total change in account value. 1
The line that matters here is the last one, because it adds all of them together. The SEC's sample statement says so in its own label: the total change in account value is a total that includes deposits and withdrawals. 1
The piece you actually want is sitting quietly on its own line nearby. The same walkthrough's disclosures define the change in investment value as the appreciation or depreciation of your holdings from price changes, plus any distributions and income earned during the period, less any transaction costs, sales charges, or fees you may have paid. 1 That is the weather. The headline is the weather plus your jug.
One reading rule carries over from the last lesson: a figure in parentheses is a deduction, and a figure without them adds to the account. 1
Why a deposit can flatter a bad month
Here is the arithmetic, with invented numbers.
You start a month with $5,000 in a brokerage account. Over that month the investments you hold lose 4 percent — $200. In the middle of the slide, you move $500 from your checking account into the account. The month ends with $5,300.
The headline on the statement reads change in account value: +$300. The investments lost money. Nothing on that line is false; the line simply is not about the investments.
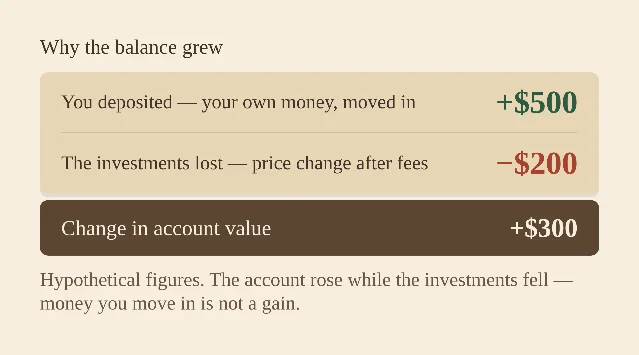
The same distortion runs the other way. Take $500 out during a month when your investments gained $200, and the headline change is −$300: a number that looks like a loss on a month that made money.
There is a plainer version of the point, and it is worth saying outright: a deposit is not a gain. Moving $500 from your bank account into your brokerage account makes no money. It is the same $500 in a different pocket. The balance rises by exactly that amount, and your investing has not done a thing.
Where the honest number lives
Your statement is not the only page your broker gives you. Most firms keep a performance page — usually online, and generally not printed on the statement itself — where the account's result appears as a rate of return rather than a dollar change. Fidelity, for instance, tells customers outright that its performance reporting figures are not included in the monthly statement. 2
On that page, look for the breakdown before the headline. Fidelity's own help page describes a table titled "What drove your change in balance?", built to answer the question "how can I tell whether the changes to my account values are due to my actions or the broader market?" That table separates account deposits and withdrawals from investment gain or loss. 2 That split is the rain gauge, and it is usually one click away.
Two gauges, two questions
Once your account has been open a while, you may meet two different percentages, and they are not competing measurements of the same thing. They answer two different questions.
The first is the investment rate of return, also called a time-weighted return. It measures how the investments themselves performed, and it deliberately removes the effect of your own deposits and withdrawals. FINRA draws the line this way: a time-weighted return ignores the size and timing of investment cash flows, which is exactly what makes it a measure of an investment or a manager rather than of an individual. Mutual funds report their average annual total returns on that basis. 3
The second is the personal rate of return, also called a money-weighted return, and it is the one your broker's performance page most often shows you. It measures what your money actually earned while it sat in the account, and it includes the effect of when and how much you added or removed. Fidelity's help page describes it as a calculation based on the change in the value of what you own, the dividends and interest you earned, the fees you paid, and the size and timing of your additions and withdrawals — and notes it is sometimes called an internal rate of return. 2
So the two numbers can differ, and the gap between them is your own timing. Money moved in shortly before a rise lifts your personal return; money moved in shortly before a fall pulls it down. Neither event changes the investments' own result, which is why the two measures part company. 2
Withdrawals deserve one line of their own, because they confuse people. A withdrawal lowers your balance, and Fidelity is explicit that it is not treated as a decline in your return — it reduces the base the return is figured on. 2
| Measure | What it measures | Whose decisions it includes | What it is good for |
|---|---|---|---|
| Investment rate of return (time-weighted) | How the investments themselves performed over the period | The investment or manager, with the size and timing of your deposits and withdrawals stripped out 3 | Judging whether the investments did what they were supposed to do |
| Personal rate of return (money-weighted) | What your money actually earned while it was in the account | The investments and the size and timing of your own deposits and withdrawals 2 | Seeing your own result on the money you actually put in |
Neither measure is the "right" one. The investment return tells you about the weather; the personal return tells you about your bucket.
Using the number without fooling yourself
Prefer the percentage to the dollar change. A dollar figure cannot be compared with anything — not with last year, not with a friend's account, not with an index — because it carries no sense of how much money produced it. FINRA's investor guidance puts the arithmetic simply: add the change in value to the income you collected, then divide by the amount you invested, and you have a percent return. 4
Give it a stretch of time, not a month. FINRA suggests that a review roughly once a year, at about the same time each year, is usually enough, and that comparing returns over several years is what shows you how your holdings behave in different market conditions. 4 One month of a bucket is weather, not climate.
Compare like with like. A common mistake is measuring a diversified account against a single index of large US companies. Schwab's education desk is direct that the S&P 500 is not "the market," but one market segment; an appropriate benchmark should reflect your portfolio's risk level and allocation. 5 A fund meant to track a particular index can fairly be compared against that index; a stock belongs beside other companies in its industry. 6
Know what is inside the percentage. Broker performance figures are generally shown net of fees, so the fees have already been subtracted from what you see. 2 Taxes and inflation have not been. Fidelity's own explainer on rate of return lists risk, taxes and fees, and inflation among the things a return figure does not account for, which is why the money you keep tends to be less than the number you are shown. 7 A related trap sits inside the arithmetic itself: dividing a three-year total return by three gives an inflated annual figure, because it ignores compounding, while a true annualized return does not. 6
Read it as history, not as a forecast. Past performance does not predict future returns. 4
Quick recap
- The change in account value on your statement adds together the market's effect and your own deposits and withdrawals; the disclosure section labels the market's part the change in investment value. 1
- A deposit raises the balance without being a gain, and a withdrawal lowers it without being a loss. 2
- The honest reading of performance is a rate of return — a percentage — and it usually lives on your broker's performance page rather than on the statement. 2
- An investment rate of return (time-weighted) strips out your deposits and withdraws to describe the investments; a personal rate of return (money-weighted) includes your timing and describes your own result. 23
- Compare percentages over several years against something that matches what you own, and remember that fees are inside the figure while taxes and inflation are not. 45
Next lesson: what to compare your return against — why a single index is a poor yardstick for a diversified account, and how to pick a benchmark that matches what you actually own.
References
- 1
- 2Performance — Fidelity
fidelity.com
- 3Regulatory Notice 20-21 — FINRA
finra.org
- 4Evaluating Performance — FINRA
finra.org
- 5
- 6
- 7
This story was produced automatically by a channel. One sentence is all it takes for Neodrop to keep producing for you.