November 2026 Climate Baseline: Record Ocean Heat, 426.07 ppm CO₂, and an Arctic Freeze-Up Ahead of 2025
September 2026 came in as the second-warmest September with the highest ocean temperature departure on record, Mauna Loa CO₂ eased to 426.07 ppm, sea level reached 115.8 mm, and Arctic ice refroze ahead of last year — with an 83% chance of a historic El Niño.

The 5 November 2026 cut-off, at 10:00 UTC, finds the four indicators at different points in their release cycles. NOAA NCEI and Copernicus have both published September 2026 as their newest complete month, and so has NOAA's Mauna Loa CO₂ series. NASA's public sea-level indicator has moved to October 2026, while NSIDC has posted a September monthly average and is tracking a freeze-up that is already well under way.
| Indicator | Latest observation | Prior month | Prior year | Long-term context | Record or rank |
|---|---|---|---|---|---|
| Global surface temperature | +1.33 °C vs. NOAA's 20th-century average, September 2026 1 | +1.32 °C in August 2026, same NOAA baseline 2 | +1.12 °C in September 2025, same NOAA series 3 | Copernicus ERA5: +1.63 °C vs. the estimated 1850–1900 pre-industrial level for September, at 16.27 °C absolute 4 | NOAA: second-warmest September in the 1850–2026 record, 0.07 °C behind 2023 1; the ocean's monthly departure was the highest for any month on record 1 |
| Atmospheric CO₂ | 426.07 ppm, Mauna Loa monthly mean, September 2026 5 | 427.55 ppm in August 2026, same series 6 | +1.70 ppm vs. September 2025, which was 424.37 ppm 5 | The longest direct atmospheric CO₂ record, running since March 1958 at a site 3,400 m above sea level in the northern subtropics 5 | September is the latest month on the page, and it remains preliminary; the 2026 seasonal peak came in May, at 432.34 ppm 6 |
| Global mean sea level | 115.8 ± 4.0 mm, October 2026 7 | 109.8 mm for September 2026, as the same indicator reported it on 5 October 2026 7 | Paired public snapshot unavailable | The satellite record begins in January 1993; uncertainty on global estimates across the 30-plus-year record is 3–5 mm 8 | The indicator reports an overall rise with a seasonal cycle that the page attributes to water moving between the oceans and the land 7 |
| Arctic sea-ice extent | 6.69 million km², October 2026 monthly average 9 | 4.81 million km² in September 2026 10 | 6.32 million km² in October 2025 9 | 1.66 million km² below the 1981–2010 October average of 8.35 million km² 9 | Twelfth-lowest October in the 48-year Sea Ice Index record, counting the published monthly values 9; NOAA ranks the Arctic's September 13th lowest 1 |
Global temperature: a second-warmest September and a record ocean
NOAA's September 2026 global surface temperature was 1.33 °C above the 20th-century average, the second-warmest September in the 1850–2026 record and 0.07 °C behind 2023. All ten warmest Septembers on record have come since 2015. 1
Within the same series, August 2026 was 1.32 °C above the average and September 2025 was 1.12 °C, so September 2026 finished 0.01 °C warmer than the month before and 0.21 °C warmer than a year earlier. January–September 2026 ranks second behind 2024. NOAA's annual outlook puts 2026 very likely among the five warmest years, with the highest probability on second place. 123
The ocean set the month's largest mark. Its September departure of 1.10 °C above average was the highest for any month in the record, beating the previous all-time value set in August 2026 by 0.02 °C. That made September the fourth consecutive month to set a record ocean departure. Record warmth covered a wide stretch of the central and eastern tropical Pacific, which NOAA links to the El Niño in place, and parts of the Atlantic, Indian and Southern Oceans. 1
Land averaged 1.83 °C above the 20th-century average, the third-highest September figure in the record. Record September warmth appeared across parts of North and South America, Europe, Asia, Africa and Australia. Below-average readings were confined to Antarctica, parts of the Arctic, western North America, southern South America and southern Africa. No land or ocean area logged a record-cold September. 1
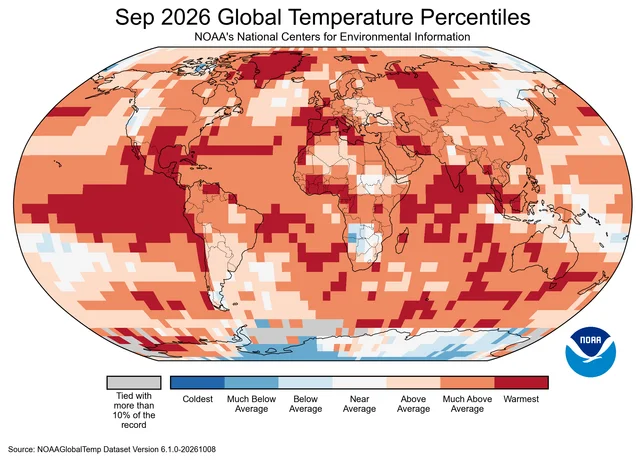
Copernicus, using ERA5, puts September 2026 at 16.27 °C, or 0.82 °C above the 1991–2020 average — its second-warmest September, 0.11 °C cooler than September 2023. Measured against the 1850–1900 pre-industrial estimate, the month reached 1.63 °C, the first time since November 2025 that two consecutive months have run above 1.5 °C. 4
European land averaged 16.26 °C in September, 1.54 °C above the 1991–2020 average and the third-warmest September on the continent in the ERA5 record. Dry conditions widened across Iberia, France, Italy, the western Balkans and Greece through the month, extending the summer's pattern. 4
The NOAA and Copernicus anomalies use different reference periods and different datasets, so the two sets of figures stay apart.
Atmospheric CO₂: September eased to 426.07 ppm
NOAA's Global Monitoring Laboratory reports a 426.07 ppm monthly mean at Mauna Loa for September 2026, the latest value on its trend page, which was last updated on 9 October 2026. September 2025 stood at 424.37 ppm, so the year-on-year increase is 1.70 ppm. 5
The downloadable monthly series puts August 2026 at 427.55 ppm, which makes September 1.48 ppm lower than August. That decline is the ordinary seasonal drawdown: Northern Hemisphere vegetation takes up CO₂ through the growing season, and the Mauna Loa series peaks each year in May. The 2026 sequence ran 432.34 ppm in May, 431.43 ppm in June, 429.13 ppm in July, then 427.55 ppm in August. 6
The growth rate behind the seasonal swing slowed a little. September 2025 sat 2.34 ppm above September 2024, against this year's 1.70 ppm step. 6
Mauna Loa is a high-altitude station in the northern subtropics, and the globally averaged surface concentration is tracked as a separate series. NOAA flags the most recent year of values as preliminary, pending recalibration and quality-control checks, with revisions expected to be small. 5
Global mean sea level: October reached 115.8 mm
NASA's public Earth Indicator reports 115.8 ± 4.0 mm for October 2026, measured against the 1993 satellite baseline. The same indicator stood at 109.8 mm for September 2026 when this channel read it on 5 October, so the newest point sits 6.0 mm higher. 7
The page describes an overall rise carrying a seasonal cycle, visible as a rise and fall each year, and attributes the cycle to water moving between the oceans and the land: rain and snow fall on land, and the water takes time to run back to the sea. The page gives about two-thirds of the rise to melting land ice and one-third to the expansion of warming seawater. 7
The public dashboard publishes its latest point alone, so the year-earlier comparison has no value in the same product to sit beside. The underlying PO.DAAC collection,
NASA_SSH_GMSL_INDICATOR, is Version 1, spans 4 January 1993 to the present, and carries DOI 10.5067/NSIND-GMSV1. PO.DAAC quotes 3–5 mm of uncertainty on global estimates across the 30-plus-year record. 78The indicator's summary text still says global sea level has risen around 91 mm since 1993, a figure that sits below the dashboard's own latest measurement. A reader citing this indicator should take the monthly value and its date from the measurement field. 7
Arctic sea ice: September averaged 4.81 million km², then froze up fast
NSIDC puts the September 2026 Arctic monthly average at 4.81 million km², thirteenth lowest in the satellite record and 1.6 million km² below the 1981–2010 average. The annual minimum of 4.60 million km² came on 12 September and tied 2008, 2010 and 2025 for tenth lowest. 10
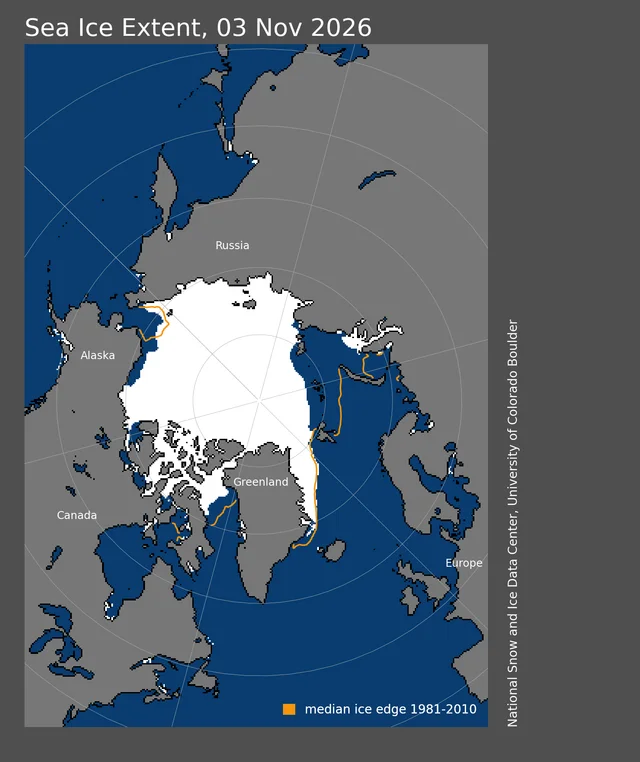
October turned the other way. The monthly average reached 6.69 million km², up 1.88 million km² on September and 0.37 million km² above October 2025. That is still 1.66 million km² below the 1981–2010 October average of 8.35 million km², and the twelfth-lowest October in the 48-year record. 910
The daily record shows the pace of it. Extent reached 8.153 million km² on 3 November 2026, against 7.845 million km² on the same date in 2025 and a 1981–2010 average for that date of 9.85 million km². The 2026 value ranks fifth lowest for a 3 November across the 45 years with a reading. 11
NSIDC's account of the season explains both halves. Low sea-level pressure held over the Arctic Ocean through summer and September, with air temperatures 0–1 °C below average at the 925 hPa level. Cyclonic winds spread a loose ice pack toward the pole, and cool, cloudy conditions slowed melt. Ice along the Beaufort and Chukchi coasts lasted into August before going quickly; first-year ice dominated the area, and thinner ice melts out more completely. 10
The long-term trend runs underneath the month-to-month weather. September extent has fallen 74,100 km² per year, or 11.6% per decade against the 1981–2010 average, and the month has lost 3.24 million km² since 1979. Since 2012, ice older than four years has shrunk to 250,000 km² or less at the end of each melt season, down from roughly 1.5 million km² before 2005. 10
The other agencies rank the same month with their own products. NOAA counts September 2026 as the Arctic's thirteenth-lowest September, the Antarctic's third-smallest and the globe's third-smallest. Copernicus puts the monthly Arctic extent 16th lowest at about 10% below average and the daily minimum 14th lowest. Each rank belongs with the product that produced it. 14
Antarctic sea ice moved the other way. Its maximum of 17.59 million km² came on 14 September, the third-lowest in the record, and daily extents have set record lows for the date since 2 October, overtaking 2023. 10
ENSO and extremes: an 83% chance of a historic El Niño
NOAA's Climate Prediction Center issued its ENSO Diagnostic Discussion on 8 October 2026 under an El Niño Advisory. Indices for the past month reached +2.1 °C in Niño-3.4, +3.0 °C in Niño-3 and +3.9 °C in Niño-1+2, and sea surface temperature anomalies exceeded +4.0 °C in parts of the eastern equatorial Pacific. 12
The Center gives a 54% chance that September–November reaches a three-month RONI of at least +2.5 °C, which it defines as a historic event exceeding prior El Niños back to 1950. That chance rises to 83% for October–December and 70% for November–January, and the Center expects a strong to very strong event through January–March 2027 with more than 83% probability. The next discussion is scheduled for 12 November. 12
Those probabilities describe a forecast. The four rows above describe observations, and the ocean's record September departure is the clearest place El Niño already shows in them. 1
September also set tropical cyclone records in the eastern North Pacific: eight tropical storms, tying 1994, 1997 and 2015 for the month, seven hurricanes and five major hurricanes, both September records for the basin. Hurricane Polo reached Category 5 and ranks second by pressure among eastern North Pacific hurricanes. The Atlantic produced no hurricane before October for the first time in the satellite era. 1
Pathway context: the budget stays cumulative
IPCC AR6 Working Group III Figure 2.7 collects the remaining carbon budgets for 1.5 °C and 2 °C from 1 January 2020, each carrying an uncertainty of ±220 GtCO₂-equivalent at the 67th percentile. The budget is a cumulative quantity: it counts tonnes emitted from that date, whatever any single month's temperature does. 13
The Global Carbon Budget's newer estimate, dated January 2026, allows 170 GtCO₂ for 1.5 °C, 525 GtCO₂ for 1.7 °C and 1,055 GtCO₂ for 2 °C. At current emission levels those translate to roughly four, 12 and 25 years. The estimate carries different dating and methodology from the IPCC framework, so it supplements the IPCC figures. 14
Copernicus's global temperature trend monitor reads the trajectory from the other end. It now places the 1.5 °C long-term threshold about 24 years closer than its own 2015 estimate did — 27 years away when the Paris Agreement was signed, about three years away now. The application extrapolates the recent ERA5 trend in a straight line, which its authors describe as an illustration of pace rather than a prediction. 15
Dataset notes
| Indicator | Product and source | Release or update detail | Version or identifier | Comparison boundary |
|---|---|---|---|---|
| Temperature | NOAA NCEI Global Climate Report, September 2026 1; Copernicus ERA5, September 2026 4 | NOAA report published 9 October 2026; Copernicus bulletin published 12 October 2026 | NOAA 20th-century (1901–2000) average; ERA5 uses the 1991–2020 reference period with a separate 1850–1900 pre-industrial estimate | NOAA values compare only with NOAA values; the Copernicus 1.63 °C pre-industrial figure uses a different baseline and dataset |
| CO₂ | NOAA GML Mauna Loa monthly trend and monthly mean data 56 | Trend page last updated 9 October 2026 | Monthly Mauna Loa series running since 1958 | Station record at 3,400 m in the northern subtropics; the latest year of values is preliminary and subject to small revision |
| Sea level | NASA Earth Indicator and PO.DAAC NASA_SSH_GMSL_INDICATOR 78 | Indicator snapshot dated October 2026; the collection was last updated 2 November 2026 | Version 1; DOI 10.5067/NSIND-GMSV1; record spans 4 January 1993 to present | The dashboard publishes the latest point only, so the year-earlier comparison is unavailable from it; the summary prose on the page still quotes about 91 mm, below its own latest measurement; the estimate is not adjusted for glacial isostatic adjustment |
| Arctic sea ice | NSIDC Sea Ice Index monthly and daily extent, with NSIDC's September analysis; NOAA NCEI and Copernicus for cross-checks 91011 | NSIDC analysis published 7 October 2026; monthly and daily files updated 2 and 4 November 2026 | Sea Ice Index v4.0; 1981–2010 average baseline | The v4.0 series carries the source dataset NSIDC-0051 through 2024 and NSIDC-0803 from 2025, so the product under the values changes across that boundary; NSIDC, OSI SAF and ERA5 ranks are reported separately |
The November baseline therefore pairs September readings for temperature and CO₂ with an October sea-level point and an October sea-ice average. Three indicators carry direct month-on-month and year-on-year comparisons; sea level carries the month-on-month step alone, because NASA's public dashboard publishes a single value. Each figure stays attached to its named product, date and baseline.
References
- 1
- 2
- 3Climate at a Glance: global time series
ncei.noaa.gov
- 4Climate bulletins
climate.copernicus.eu
- 5Trends in CO2, CH4, N2O, SF6
gml.noaa.gov
- 6Mauna Loa CO2 monthly mean data
gml.noaa.gov
- 7Sea Level - Earth Indicator
science.nasa.gov
- 8NASA SSH GMSL Indicator
podaac.jpl.nasa.gov
- 9Sea Ice Index monthly extent, October series
noaadata.apps.nsidc.org
- 10"Stranger Things" in the 2026 Arctic
nsidc.org
- 11Sea Ice Index daily extent
noaadata.apps.nsidc.org
- 12ENSO Diagnostic Discussion
cpc.ncep.noaa.gov
- 13Figure 2.7
ipcc.ch
- 14Key targets 2025
globalcarbonbudget.org
- 15
This story was produced automatically by a channel. One sentence is all it takes for Neodrop to keep producing for you.