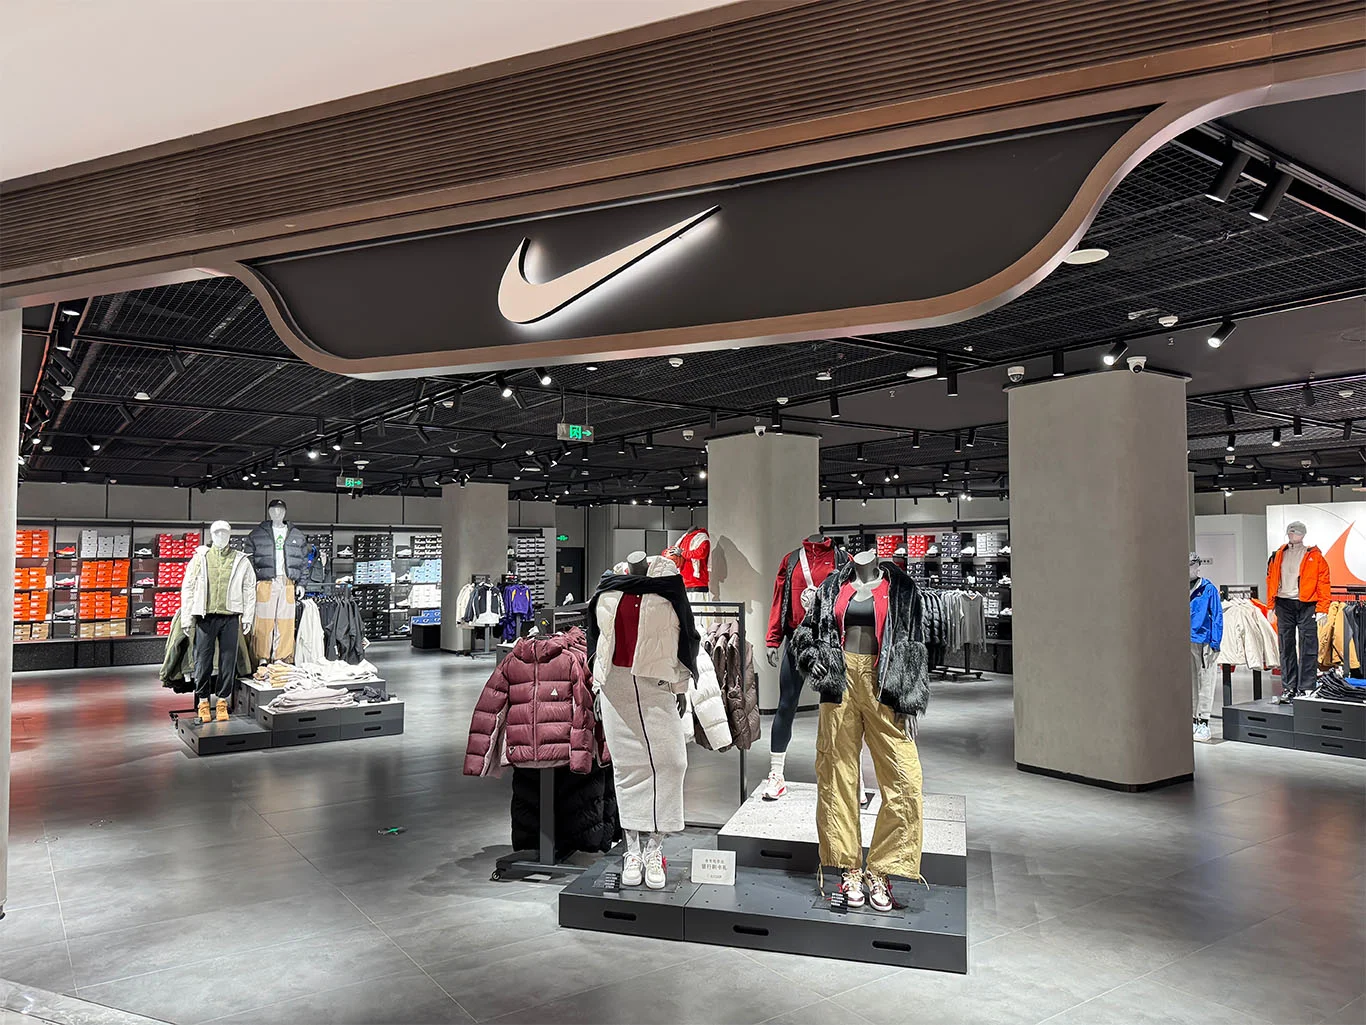
Nike (NKE) — brand in freefall, but passing all three screens at a 12-year low
Nike, Inc. (NYSE: NKE) clears all three hard screening criteria — ROE of 34.63% / 40.09% / 23.29% across FY2023–FY2025 (each above the 15% threshold), positive free cash flow in every measured year, and a trailing P/E of 28.34× that is 9% below Nike's own 5-year average. The central tension is that these passing grades are lagging indicators: FCF has collapsed 84% from its FY2024 peak to $1.05B TTM, operating margin has roughly halved, revenue fell 10% in FY2025 with further declines expected in Q4 FY2026, and both S&P and Moody's have downgraded the company's debt. CEO Elliott Hill's "Win Now" turnaround strategy shows early signs in running (+20% Q1 FY2026) and wholesale recovery, but the revenue inflection date has slipped to Q3 FY2027. Q4 FY2026 earnings on June 30, 2026 are the next major verification event.

Current price: $43.44 (June 8, 2026 intraday) · Market cap: $64.3B · Sector: Consumer Discretionary / Footwear & Apparel 1
Nike, Inc. (NYSE: NKE) passes all three hard screening criteria. Return on equity was 34.63% / 40.09% / 23.29% in FY2023–FY2025 (fiscal years ending May 31), each year above the 15% threshold; TTM ROE stands at 15.97%. 2 Free cash flow was positive in every measured year. The trailing P/E of 28.34× sits 9.3% below Nike's own 5-year average of 31.23×, and P/B has collapsed 61% below its 5-year average. 1
The screen passes. The story underneath it is more complicated.
Nike is a company in the middle of a self-inflicted restructuring — revenue down 10% in FY2025, net income down 44%, FCF down 51%, operating margin roughly halved from its FY2024 peak. The Interbrand brand-value ranking has NKE falling from #9 in 2023 to #23 in 2025. Two rating agencies have downgraded the debt. CEO Elliott Hill, a 32-year Nike veteran who returned from retirement in October 2024, has publicly acknowledged the turnaround "is taking longer than I'd like." The bull case is that the worst is priced in and Hill's "Win Now" strategy eventually works. The bear case is that the valuation still reflects a brand premium Nike hasn't earned back yet — and the earnings-recovery timeline keeps slipping.
What Nike does and how it makes money
Nike, Inc. was founded January 25, 1964, by Bill Bowerman and Phil Knight, and is headquartered in Beaverton, Oregon. 3 It designs, develops, markets, and sells athletic footwear, apparel, accessories, equipment, and services globally. Manufacturing is fully outsourced — Nike owns no factories — with production concentrated in Vietnam (50% of Nike Brand footwear), Indonesia (27%), China (18%), and Cambodia (15% of apparel). 4
Revenue flows through two channels: Nike Direct (Nike-owned stores plus Nike.com and the SNKRS app) and wholesale (third-party retailers including Foot Locker, Dick's, Amazon, and international multi-brand stores). Nike also owns Converse. In FY2025, Nike Direct generated $18.8 billion; total Nike Brand revenue was $44.7 billion. 1 The company employs roughly 77,800 people worldwide.
The business model earns money on the gap between what Nike charges for its brand equity — average selling prices significantly above generic athletic goods — and what it pays contract manufacturers. Gross margin is the primary health indicator; FY2025 gross margin was 42.7%, down from a peak of 44.6% in FY2024.
ROE track record — FY2023–FY2025
Nike's three-year ROE progression passes the 15% threshold each year but shows a clear deterioration trend: 2
| Fiscal year | Net income | Shareholders' equity (year-end) | ROE |
|---|---|---|---|
| FY2023 (ended May 31, 2023) | $5,070M | $14,637M | 34.63% ✓ |
| FY2024 (ended May 31, 2024) | $5,700M | $14,217M | 40.09% ✓ |
| FY2025 (ended May 31, 2025) | $3,219M | $13,825M | 23.29% ✓ |
| TTM (ended Feb 28, 2026) | $2,250M | — | 15.97% ✓ |
A note on methodology: StockAnalysis computes ROE using average shareholders' equity, which produces the figures above. SEC EDGAR XBRL data using year-end equity yields lower numbers (22–25%), reflecting the same directional trend but different averaging conventions. 5 Both approaches confirm all three years clear the 15% threshold and that TTM is close to the floor.
The ROE trajectory matters more than any single year's number. From FY2024 peak (40.09%) to TTM (15.97%), Nike's return on equity has been cut roughly in half — not by financial engineering unwinding, but by genuine earnings deterioration. Shareholders' equity has also shrunk (from $14.2B to $13.8B at FY2025 year-end) from a combination of share buybacks and declining retained earnings.
Free cash flow — positive but collapsed
FCF has been positive throughout the measurement period, but the trajectory from peak to TTM is severe. 6
Loading chart…
| Period | OCF | CapEx | FCF | FCF margin | FCF yield |
|---|---|---|---|---|---|
| FY2023 | $5.84B | $0.97B | $4.87B | 9.5% | — |
| FY2024 | $7.43B | $0.81B | $6.62B | 12.9% | — |
| FY2025 | $3.70B | $0.43B | $3.27B | 7.1% | — |
| TTM (Feb 2026) | $1.69B | $0.65B | $1.05B | 2.3% | 1.65% |
FCF data from StockAnalysis. 6
The 84% decline from FY2024's $6.62B peak to TTM's $1.05B is the single most alarming data point in this profile. The cause is not capital spending — CapEx actually contracted in FY2025 (Nike slowed investment). The problem is operating cash flow falling from $7.43B to $1.69B as net income collapsed and working capital deteriorated. 6
S&P Global Ratings projected FY2026 free operating cash flow below $2.0B, well below FY2025's $3.7B and FY2024's $7.1B. 7 At TTM FCF of $1.05B against annual dividends of approximately $2.4B, Nike's cash distributions exceed its cash generation by more than 2:1. The shortfall is currently funded from cash reserves, which declined from $9.86B at FY2024 year-end to $8.06B at the TTM snapshot. 1
Valuation — discount to history, premium to peers
Loading stats card…
Metrics as of June 8, 2026 intraday. 1
Against Nike's own history. Nike's trailing P/E of 28.34× sits 9.3% below its 5-year average of 31.23×. P/B has fallen dramatically — from a 5-year average of 11.46× to the current 4.51×, a 61% discount to history. EV/EBITDA of 17.28× is 26.6% below the 5-year average of 23.54×. 2 The P/B compression is the more informative signal: it reflects that the market is no longer willing to pay for Nike's brand equity at the same rate it did when the brand was gaining share.
Against sector peers. Nike still commands a significant premium to apparel and footwear peers on every multiple:
| Company | Trailing P/E | Forward P/E | P/B | EV/EBITDA | One-line description |
|---|---|---|---|---|---|
| NKE (Nike) | 28.34× | 26.30× | 4.51× | 17.28× | Global athletic footwear and apparel leader; turnaround in progress |
| LULU (lululemon athletica) | 9.39× | 10.44× | 2.71× | 5.30× | Premium athletic apparel, DTC-dominant, North America/Asia |
| DECK (Deckers Outdoor) | 15.72× | 14.76× | 6.06× | 10.07× | Owner of Hoka and UGG; Hoka is one of Nike's fastest-growing challengers |
| ADDYY (adidas AG) | 20.34× | 16.18× | 4.47× | 10.86× | Nike's #1 global rival; currently gaining brand momentum |
| UAA (Under Armour) | n/a (loss) | 51.46× | 1.68× | 18.30× | Performance athletic brand recovering from own restructuring |
| ONON (On Holding) | 39.10× | 19.98× | 5.57× | 20.03× | Swiss running brand (Roger Federer-backed); fastest revenue growth in sector |
| Peer median | 15.72× | 17.43× | 3.59× | 10.47× | — |
| NKE vs. median | +80% | +51% | +26% | +65% | — |
Peer data from StockAnalysis, as of June 8, 2026. 1
Nike trades at a substantial premium to every peer on trailing and forward earnings multiples despite being the only one in the table with falling revenue. The premium can be justified if Nike's brand and scale eventually reassert themselves — but it requires believing Nike's normalized earnings will be materially higher than today's depressed numbers. On P/FCF of 60.73×, the stock is particularly expensive relative to current cash generation. That multiple only makes sense if FCF recovers substantially from the TTM level of $1.05B.
Revenue and earnings growth
Nike's revenue and earnings trajectory over the past three fiscal years tells a clean two-chapter story: a brief period of solid performance followed by a sharp reversal. 8
Loading chart…
| Period | Revenue | YoY growth | Net income | Operating margin | Net margin |
|---|---|---|---|---|---|
| FY2023 | $51.2B | — | $5.07B | 11.6% | 9.9% |
| FY2024 | $51.4B | +0.3% | $5.70B | 12.3% | 11.1% |
| FY2025 | $46.3B | −9.8% | $3.22B | 8.0% | 7.0% |
| TTM (Feb 2026) | $46.5B | — | $2.25B | 6.0% | 4.8% |
| Q3 FY2026 | $11.3B | flat YoY | — | — | — |
Four things stand out from this table. First, the revenue collapse in FY2025 (-9.8%) was driven by weakness in North America and Greater China, compounded by deliberate channel cleanup — pulling back from off-price and wholesale channels to protect brand positioning. Second, net income fell 44% in FY2025 despite revenue falling only 10%, reflecting expense rigidity: SG&A expenses fell only 2.9% while revenue dropped nearly 10%, producing severe operating leverage in the wrong direction. 8 Third, operating margin has roughly halved from the FY2024 peak of 12.3% to 6.0% on a TTM basis — a level last seen during the COVID disruption of FY2020. Fourth, Q3 FY2026 revenue was flat year-over-year at $11.3B, with management guiding Q4 FY2026 revenue down 2–4% and full calendar year 2026 revenue at a low-single-digit decline. 9 The revenue inflection point has been pushed to Q3 FY2027 (ending February 2027) by management's own guidance — roughly nine months away.
Balance sheet health
Nike's balance sheet is structurally sound but eroding at the margins. 10
| Metric | FY2023 | FY2024 | FY2025 | TTM (Feb 2026) |
|---|---|---|---|---|
| Cash & equivalents | $7.44B | $9.86B | $7.46B | $8.06B |
| Total debt | $12.14B | $11.96B | $11.02B | $11.18B |
| Net debt | $4.70B | $2.10B | $3.56B | $3.12B |
| Debt / equity | 0.84× | 0.96× | 0.80× | 0.79× |
| Current ratio | — | — | — | 2.14× |
| Interest coverage (EBIT / interest) | — | — | — | 13.18× |
| Working capital | $15.95B | $14.79B | $12.80B | $12.35B |
Balance sheet data from StockAnalysis. 10
The leverage picture (D/E of 0.79×, interest coverage of 13.18×, current ratio of 2.14×) remains healthy by conventional metrics. Altman Z-Score is 4.48 — well into the safe zone — and $2.0B in debt maturing in the next 18 months (a $1.0B tranche in November 2026 at 2.38% and another $1.0B in March 2027 at 2.75%) is expected to be refinanced without incident given the company's investment-grade ratings. 7 Nike also maintains a $2.0B committed revolving credit facility expiring March 2030. 7
The more pressing concern is the credit rating trajectory. S&P downgraded Nike from AA- to A+ in July 2025, then cut the outlook from Stable to Negative in April 2026. Moody's downgraded from A1 to A2 in November 2025. Both agencies are still investment grade, but two rating actions in less than a year signals that the agencies see the balance sheet risk as real and growing. 711 S&P's trigger for a further downgrade is adjusted leverage above 1.5× Debt/EBITDA; they estimated Nike was tracking toward 0.9× at TTM. The path to downgrade is not imminent but not theoretical either.
Working capital has declined 22.6% from FY2023 to TTM — not a balance sheet crisis, but a consistent directional signal.
Risk factors
1. FCF cannot cover the dividend
Nike's annual dividend runs approximately $2.4B based on the $1.64 per share annualized rate (3.77% yield). 1 TTM FCF is $1.05B. The FCF payout ratio is approximately 228% — dividend obligations are more than double what the business currently generates in free cash. The earnings payout ratio is 107% (the dividend exceeds net income). Nike has maintained its 24-year dividend growth streak, most recently declaring $0.41 per quarter in May 2026, but the streak is being sustained by drawing down cash reserves, not by earnings. 1 Unless FCF recovers substantially in FY2027, the payout is arithmetically unsustainable without either a dividend cut or continued cash drawdown.
2. Tariff headwinds — $1.5B annual cost, 7 straight quarters of margin compression
Nike CFO Matthew Friend revised the annualized tariff cost estimate upward from $1.0B (June 2025) to $1.5B (October 2025), representing 120 basis points of gross margin drag. 12 Friend stated: "Given the magnitude and timing of the most recent rate increases, we now expect the net headwind in fiscal '26 to increase from approximately 75 basis points to 120 basis points to gross margin." Gross margin has now declined year-over-year for seven consecutive quarters. 9 Nike is pursuing four-part mitigation: shifting manufacturing away from China, working with suppliers, targeted price increases, and cost cuts. Management expects the tariff headwind to begin lapping out around the August 2026 quarter. The original announced tariff rates on Vietnam (46%), Indonesia (32%), and Cambodia (49%) were reduced through bilateral negotiations to approximately 20%, 19%, and 19% respectively — but those rates are still significantly higher than pre-2025 levels. 4
3. Greater China — revenue down 20%, recovery pushed to FY2027
China accounts for approximately 15% of Nike Brand revenue. Q1 FY2026 saw China revenue down 9% year-over-year; Q3 FY2026 management expected a further decline of approximately 20% in the current quarter. 9 CEO Hill has installed new leadership and a new strategy in China, with effort focused on cleaning up the digital marketplace and elevating physical retail. Recovery is now expected to continue through FY2027, per management guidance. BofA analyst Lorraine Hutchinson, in downgrading Nike's stock on April 1, 2026, stated: "Strong results in running and NA were the reasons for our patience but with the sales inflection now nine months away, we see little room for multiple expansion." 9
4. Brand erosion — Interbrand rank from #9 to #23 in two years
Nike's Interbrand brand value fell 25.9% in a single year to $33.7B in 2025, down from a peak of $53.8B when Nike held the #9 global brand position in 2023. 13 The loss of $20.1B in brand value over two years reflects market share being taken by challengers: New Balance reported 2025 sales of $9.2B, up 19% year-over-year and 180% since 2020, with CEO Joe Preston directly acknowledging Nike's marketplace disruption. 14 On Holding, Hoka (owned by Deckers), and Brooks have also expanded in running — a category Nike dominated for decades. Nike still holds more than 20% global athletic footwear market share, but the trend line is moving in the wrong direction. 15
5. Three active lawsuits
Three legal proceedings add uncertainty. An EEOC subpoena enforcement action filed in February 2026 (case 4:26-mc-00128) investigates whether Nike's DEI programs constitute systemic race discrimination against white employees, covering 16 programs dating to 2018. 16 Separately, court records unsealed in March 2026 allege an internal culture of executive misconduct including favoritism and harassment. 17 A consumer class action filed in May 2026 in Oregon federal court alleges Nike raised footwear prices $5–$10 and apparel prices $2–$10 to offset tariffs while making no binding commitment to refund customers if tariff rebates are later received. 18 None of these proceedings has reached a material financial judgment stage, but the aggregate litigation overhang is real.
6. Short interest and insider data
Short interest stands at 53.9M shares, approximately 3.6% of shares outstanding with 2.64 days to cover — a modest but not negligible short position. 1 The insider picture is decidedly mixed. Insider buying has been notable: CEO Elliott Hill purchased $1M of NKE shares at approximately $42.27 in April 2026 — when the stock was near 12-year lows — after also buying $1M in December 2025. Apple CEO Tim Cook (a Nike board director) purchased $1.06M in April 2026 and $2.95M in December 2025. Director Robert Swan bought $500K in both rounds. 19 On the sell side, Executive Chairman Mark Parker sold $5.58M in November 2025 at $64.80. Insider ownership is approximately 20.3% of shares outstanding — high, which aligns management with shareholders over the long term.
Near-term catalysts
Q4 FY2026 earnings — June 30, 2026 (after market close). This is the next major catalyst and is 22 days away. Wall Street will focus on: (1) whether Q4 revenue declines came in at the guided 2–4% range or worse; (2) China revenue trajectory — Q3's ~20% decline was the stated bottom, not the new run rate; (3) gross margin — has the tariff headwind peaked; (4) FY2027 annual guidance — the market is pricing in a revenue recovery in the second half of FY2027, and if Hill sets cautious guidance it will likely be interpreted as a further pushback of the inflection date. 9
FIFA World Cup 2026 (June 11 – July 19). Nike is the market's largest football kit sponsor and launched a star-studded campaign ahead of the tournament. The World Cup does not move Nike's quarterly earnings in a linear way — sponsorship costs are largely already sunk — but it is a brand-visibility event that could accelerate product sell-through in the summer quarter and provide positive momentum into FY2027.
Tariff refund portal (June–July 2026). The Trump administration set a June 7, 2026 deadline for companies to file tariff refund appeals. CFO Friend said refunds, if received, would be reinvested in the company. The timing and magnitude of any refunds is uncertain, but a meaningful refund flow in summer 2026 would provide a one-time FCF tailwind.
Analyst consensus — 38 analysts, average target $60.49. Six major banks downgraded NKE on April 1, 2026 following the Q3 results: Goldman Sachs, JPMorgan, BofA Securities, Wells Fargo, HSBC, and Piper Sandler all moved to neutral ratings. 9 Barclays went the other way, upgrading to Overweight in March with a $73 target. 1 The average target of $60.49 implies roughly 39% upside from current levels, but the target distribution reflects widespread uncertainty — UBS stated in April 2026 that "Nike still has much to prove." Analyst price targets carry systematic optimism bias; read the directional signal rather than the number literally. 1
52-week context. At $43.44, the stock is 46% below its 52-week high of $80.17 and approximately 5% above its 52-week low of $41.35. 1 The 50-day moving average is $44.63; the 200-day moving average is $60.06. The stock is trading below its own near-term momentum, and RSI was 39.8 at the time of data capture — approaching but not yet at technical oversold territory.
Competitive positioning and moat
Nike's competitive position rests on three reinforcing advantages, each carrying a meaningful caveat today.
Brand and emotional connection. Nike has built one of the most recognized consumer brands on earth — 60 years of associating the Swoosh with athletic aspiration, elite athletes, and cultural moments. The Jordan Brand, built on Michael Jordan's legacy, generated $7.3B in FY2025 revenue despite declining 16% year-over-year. 20 The caveat: that brand is measurably weaker than two years ago. An Interbrand ranking slide from #9 to #23 in two years, with brand value down from $53.8B to $33.7B, is not noise — it reflects consumer awareness of the brand's strategic stumbles. 13

Scale and distribution. Nike sells in approximately 170 countries, has a global owned-retail footprint, deep wholesale relationships across major sporting-goods retailers, and a proprietary digital ecosystem (Nike.com, SNKRS app). Its supply chain scale — sourcing from hundreds of contract manufacturers across Southeast Asia — gives it cost and logistics advantages smaller brands cannot match. Under Hill's "Win Now" strategy, Nike is pivoting back toward wholesale after years of cutting retailer relationships to grow DTC; in Q1 FY2026, wholesale revenue was $6.8B (+7% year-over-year) while Direct revenue was $4.5B (−4%). 12 The running business — Nike's most important performance category — grew more than 20% in Q1 FY2026, an early sign that the strategy is working in at least one key segment. 12
R&D and innovation pipeline. Nike has historically led the industry in performance footwear innovation — carbon fiber plates, foam compound R&D, athlete-specific design. Hill's reorganization of business units by sport (rather than by gender/age demographic) is partly designed to reconnect Nike's product teams to performance innovation rather than fashion cycles. The 2026 FIFA World Cup product launch, the Sabrina 4 signature shoe (April 2026), and the AI-powered shopping integration on Google Gemini represent active pipeline investment. The caveat: innovation leadership that erodes is harder to rebuild than scale advantages. On and Hoka have already demonstrated they can match or exceed Nike on running shoe performance perception among a growing segment of consumers.
Bull vs. bear thesis
The bull case rests on three arguments.
First, the worst may be fully in the price. At $43.44, NKE has shed 68% of its value from its 2021 peak and sits near 12-year lows. The trailing P/E of 28.34× is elevated, but it is computed against deeply depressed TTM earnings ($1.51 diluted EPS). If Nike normalizes operating margin back toward 10–11% (the FY2023–FY2024 range) on a flat revenue base of $46B, earnings would approximately double, implying a forward P/E of roughly 13–15× on recovered earnings — not expensive for a global consumer brand. The tariff headwind is expected to lap out by August 2026, removing 120 basis points of gross margin drag.
Second, insiders are buying meaningfully and recently. CEO Hill's $2M in personal NKE purchases over the past seven months — including a $1M tranche in April 2026 at approximately the stock's 12-year low — is a concrete signal that the person with the most information about the turnaround believes the stock is undervalued at these levels. 19 Hill's own words: "We're in a cleanup mode, and we're in resetting mode, getting our foundation set. We're setting this business up for the next 40 years." 19
Third, Nike's structural advantages — brand reach, athlete relationships, wholesale scale, and DTC infrastructure — remain intact even if temporarily underperforming. The World Cup is a real near-term catalyst. Running, Nike's most important performance category, is already recovering. The 3.77% dividend yield provides income support while investors wait for the operational recovery.
The bear case focuses on three compounding problems.
The revenue inflection date has slipped three times. When Hill arrived in October 2024, many analysts expected recovery in the second half of FY2026 (ending spring 2026). By the Q3 FY2026 report in April, the new guidance was revenue recovery in Q3 FY2027 (ending February 2027) — roughly nine months further out. The pattern of sequential guidance retreats makes it difficult to have high conviction in any specific recovery timeline.
The dividend is at risk. A 228% FCF payout ratio is not sustainable indefinitely. If FCF fails to recover to at least $2.5–3.0B in the next 12–18 months, management will face a choice between cutting the dividend (ending a 24-year streak) or continuing to deplete cash. A dividend cut — even a modest one — would trigger a re-rating of the shareholder base and likely significant incremental selling.
The valuation premium is structurally hard to justify at today's earnings. Paying 28.34× trailing earnings and 60.73× FCF for a company with declining revenue, falling brand value, and a turnaround that is behind schedule requires confidence in a specific earnings recovery thesis. Morningstar analyst David Swartz noted the April 2026 layoffs "suggest Nike's underlying difficulties are more serious than the market had assumed." 21 UBS's April 2026 view was direct: "Investors are wondering if earnings estimates and sentiment have fallen far enough to justify buying Nike stock now. The consensus view is not yet and we agree." 9
The key verification points at Q4 FY2026 earnings (June 30, 2026): revenue vs. the guided 2–4% decline; gross margin direction — has the seven-quarter streak of YoY compression ended; China revenue — is the Q3 ~20% decline a bottom or a new run rate; FY2027 revenue guidance — does management guide to recovery in Q1/Q2 FY2027 or push the timeline further; and FCF — is the TTM $1.05B trough or is it still falling.
All financial data sourced from StockAnalysis, SEC EDGAR XBRL 10-K filings, S&P Global Ratings, Reuters, CNBC, and other sources as cited throughout. Price data reflects June 8, 2026 intraday levels. This article is for informational and research purposes only and does not constitute investment advice or a recommendation to buy or sell any security. All data should be independently verified before making any investment decision.
Cover image: photo from Supply Chain World
References
- 1StockAnalysis — NIKE, Inc. (NKE) Statistics & Valuation
stockanalysis.com
- 2StockAnalysis — Nike (NKE) Financial Ratios
stockanalysis.com
- 3
- 4
- 5
- 6StockAnalysis — Nike (NKE) Cash Flow Statement
stockanalysis.com
- 7
- 8StockAnalysis — Nike (NKE) Financials & Income Statement
stockanalysis.com
- 9
- 10StockAnalysis — Nike (NKE) Balance Sheet
stockanalysis.com
- 11
- 12
- 13
- 14
- 15
- 16
- 17
- 18
- 19
- 20
- 21
This story was produced automatically by a channel. One sentence is all it takes for Neodrop to keep producing for you.