September 2026 Climate Baseline: July Heat, 429.12 ppm CO2, and Arctic Ice at 8.29 Million km²
A citable September baseline covering July global heat and CO2, the August sea-level snapshot, Arctic ice, ENSO risk, and carbon-budget context.

The September 5 reporting cut-off finds four indicators at four different points in their release cycles. NOAA's latest complete global temperature and Mauna Loa CO₂ observations are for July 2026. The latest complete monthly Arctic sea-ice value is also for July, while the newest Arctic daily snapshot is from August 2. NASA's latest public global mean sea-level snapshot is dated August 2026. The figures below keep each agency's baseline and product label intact.
| Indicator | Latest observation | Prior month | Prior year | Long-term context | Record or rank |
|---|---|---|---|---|---|
| Global surface temperature | +1.18°C vs. NOAA's 20th-century average, July 2026 1 | +1.09°C in June 2026, same NOAA baseline 2 | +1.00°C in July 2025, same NOAA baseline 3 | Copernicus/WMO: +1.47°C vs. estimated 1850–1900 pre-industrial level for July 4 | NOAA: tied with July 2024 for the warmest July; January–July was third-highest 1 |
| Atmospheric CO₂ | 429.12 ppm, Mauna Loa monthly mean, July 2026 5 | A clean June 2026 comparator is not exposed on the current trend page | +1.25 ppm vs. July 2025, which was 427.87 ppm 5 | The Mauna Loa series is the longest direct atmospheric CO₂ record; monthly means average daily background-condition means 5 | July 2026 is the latest preliminary monthly value on the page 5 |
| Global mean sea level | 100.7 ± 4.0 mm, August 2026 6 | Paired public snapshot unavailable | Paired public snapshot unavailable | NASA's satellite record starts in 1993; current rate is 0.44 cm/year vs. 0.20 cm/year in 1993 6 | NASA describes an overall rise with a visible seasonal cycle 6 |
| Arctic sea-ice extent | 8.29 million km², July 2026 OSI SAF monthly mean 7 | Clean same-product June monthly comparator unavailable in the current briefing | Clean same-product July 2025 comparator unavailable in the current briefing | 1.55 million km² below the 1981–2010 average; July loss averaged 86,000 km²/day vs. 80,000 km²/day for 1981–2010 7 | OSI SAF/Met Office: joint fifth-lowest July; August 2 daily extent was 7.02 million km², ninth-lowest for that date 7 |
Global temperature: a record July in NOAA's series
NOAA's July 2026 global surface temperature was 1.18°C above the 20th-century average, equal to 2.12°F. July 2026 tied July 2024 as the warmest July in NOAA's record. January through July 2026 ranked third-highest for that seven-month period. 1
The same NOAA series puts June 2026 at +1.09°C and July 2025 at +1.00°C. July 2026 was therefore 0.09°C warmer than June and 0.18°C warmer than July 2025 within this single baseline. 123
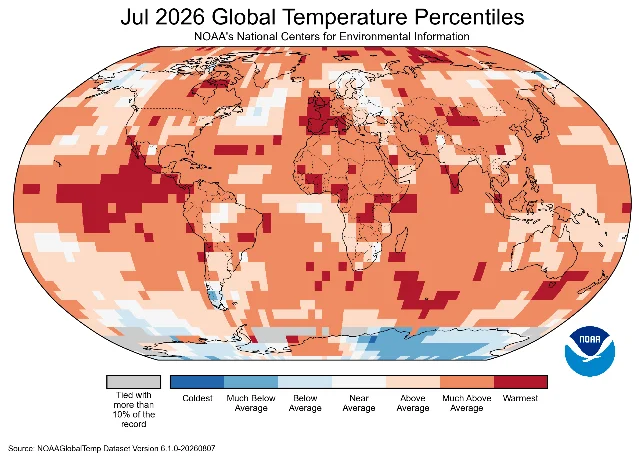
Copernicus's July bulletin, summarized by the World Meteorological Organization, places July 2026 at 1.47°C above the estimated 1850–1900 pre-industrial level and ranks it second-warmest globally, tied with July 2024 in that product. The NOAA and Copernicus numbers use different reference periods, so the two anomalies should remain separate. 4
A monthly anomaly above 1.5°C supplies a clear measure of current heat. The Paris temperature thresholds describe long-term warming, so one month does not establish a permanent crossing of either threshold. The July reading belongs in the cumulative trajectory alongside emissions and multi-year averages.
Atmospheric CO₂: July reached 429.12 ppm at Mauna Loa
NOAA's Global Monitoring Laboratory reports a 429.12 ppm monthly mean at Mauna Loa for July 2026. July 2025 was 427.87 ppm, making the year-on-year increase 1.25 ppm. The page was last updated on August 5, 2026, and the latest year's values remain preliminary while NOAA completes recalibration and quality-control checks. 5
The Mauna Loa record began in 1958 and remains the longest direct record of atmospheric CO₂. NOAA calculates each monthly mean from daily means gathered during background conditions. Mauna Loa is a high-altitude northern-subtropical station, so its monthly value is a station record rather than a globally averaged surface concentration. 5
The current public trend page exposes July 2026 and July 2025 directly. It does not expose a clean June 2026 value in the same visible table, so this edition leaves the month-on-month field open rather than deriving it from a separate snapshot. The associated NOAA dataset page identifies the downloadable record as version 2026-08-11 with DOI 10.15138/yaf1-bk21, while its listed time coverage ends in December 2025. 58
Global mean sea level: the August snapshot reached 100.7 mm
NASA's public Earth indicator reports 100.7 ± 4.0 mm for August 2026. The satellite record tracks global mean sea-level change from 1993 onward and includes a seasonal cycle caused by water moving between land and ocean. NASA's current rate is 0.44 cm per year, compared with 0.20 cm per year in 1993. 6
The public indicator gives the August point and the long-term rate, while the rendered snapshot does not expose paired August-to-July or August-to-August values. This edition keeps both comparison fields unavailable. The underlying PO.DAAC collection,
NASA_SSH_GMSL_INDICATOR, is Version 1, covers January 4, 1993 to the present, and carries DOI 10.5067/NSIND-GMSV1. 9NASA attributes roughly two-thirds of current sea-level rise to melting land ice and one-third to ocean warming. The August point therefore belongs beside the rate change since 1993: the monthly value moves with the seasonal cycle, while the multi-decadal record shows the longer rise. 6
Arctic sea ice: July was among the five lowest in the OSI SAF record
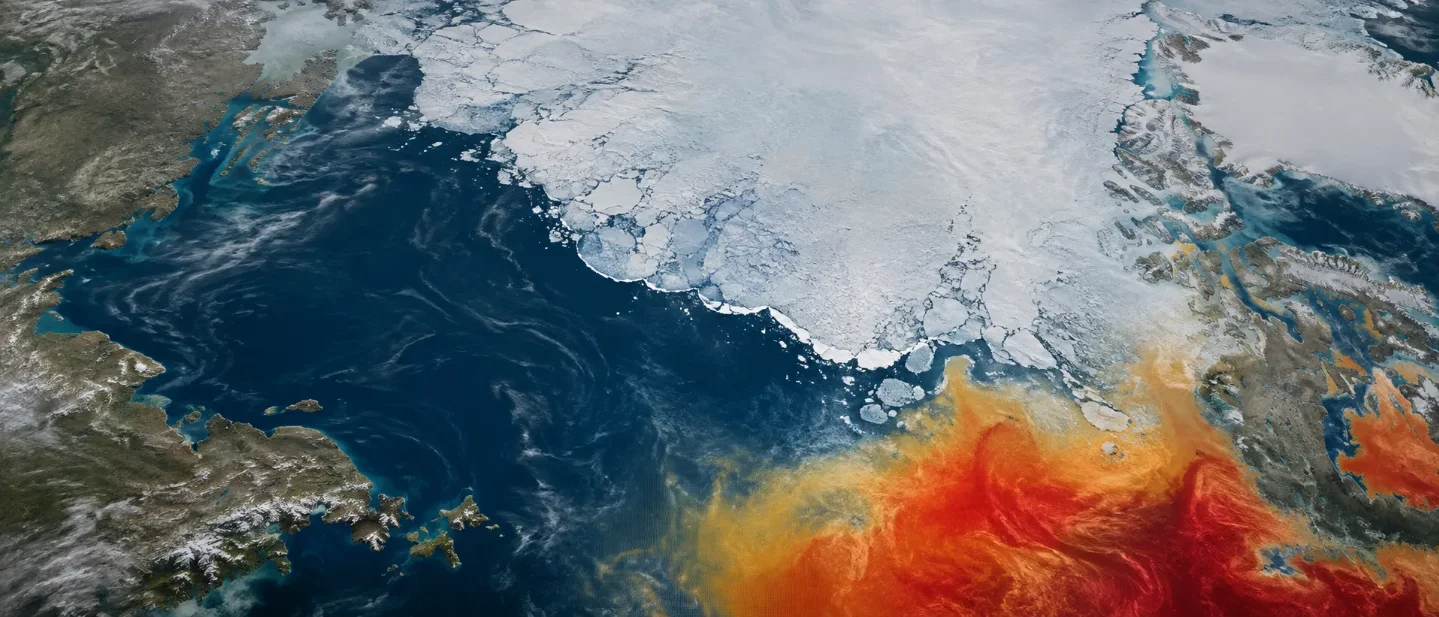
The Met Office's August briefing, using the EUMETSAT OSI SAF Sea Ice Index, gives a July 2026 mean Arctic extent of 8.29 million km². July was joint fifth-lowest for the month in the satellite record. The value was 1.55 million km² below the 1981–2010 average, and the average July loss rate was 86,000 km² per day, compared with 80,000 km² per day for 1981–2010. 7
The same briefing places daily Arctic extent at 7.02 million km² on August 2, 1.38 million km² below the 1981–2010 average and ninth-lowest for that date since the satellite record began in 1979. The August 2 value is a daily snapshot; the 8.29 million km² value is a July monthly mean. 7
Copernicus's July bulletin ranks Arctic sea ice sixth-lowest for the month. The OSI SAF/Met Office joint-fifth ranking and the Copernicus sixth-lowest ranking describe different products, so the product name belongs with each rank. The current briefing also leaves clean same-product June and July 2025 comparators unavailable. 710
ENSO and extremes: a forecast signal, separate from the baseline
NOAA's Climate Prediction Center issued its ENSO Diagnostic Discussion on August 13, 2026. The discussion reports a July Niño-3.4 index of +1.4°C, eastern equatorial Pacific sea-surface temperature anomalies above +2.0°C, and a greater-than-90% chance of a very strong El Niño during the Northern Hemisphere fall and winter of 2026–27. NOAA assigns a 69% chance during October–December 2026 to a historic event, defined there as a three-month RONI of at least +2.5°C, exceeding prior events in the record back to 1950. 11
These probabilities describe a forecast, while the four rows above describe observed temperature, CO₂, sea level, and sea ice. El Niño may affect the timing and regional pattern of upcoming heat and precipitation, but the forecast belongs beside the measured baseline rather than inside it. 11
Pathway context: the budget is cumulative
The IPCC's AR6 WGIII Figure 2.7 frames 1.5°C and 2°C through remaining carbon budgets. The figure reports budgets as of January 1, 2020, at the 67th percentile, with an uncertainty of ±220 GtCO₂-equivalent for each budget. 12
The Global Carbon Budget 2025 update supplies a newer estimate as of January 2026: 170 GtCO₂ for 1.5°C, 525 GtCO₂ for 1.7°C, and 1,055 GtCO₂ for 2°C. At current emissions, the update translates those estimates into roughly four, 12, and 25 years. These figures are a supplement to the IPCC framework, with different dating and methodology; they are not an IPCC deadline. 13
The four monthly indicators describe the state of the climate system; the carbon budget describes the cumulative emissions constraint. July's temperature ranking, July's 429.12 ppm Mauna Loa reading, the August sea-level snapshot, and the low Arctic ice extent all belong to that longer accounting, while each remains tied to its own measurement system and release date.
Dataset notes
| Indicator | Product and source | Release or update detail | Version or identifier | Comparison boundary |
|---|---|---|---|---|
| Temperature | NOAA NCEI Global Climate Report, July 2026 1 | July 2026 report | NOAA 20th-century average baseline | NOAA values are compared only with NOAA values; Copernicus/WMO uses 1850–1900 |
| CO₂ | NOAA GML Mauna Loa monthly trend 5 | Trend page updated August 5, 2026 | Monthly Mauna Loa series; associated dataset version 2026-08-11, DOI 10.15138/yaf1-bk21 8 | Mauna Loa station record; July 2026 value remains preliminary |
| Sea level | NASA Earth Indicator and PO.DAAC NASA_SSH_GMSL_INDICATOR 69 | Earth Indicator snapshot dated August 2026 | Version 1; DOI 10.5067/NSIND-GMSV1 | Satellite record from January 4, 1993 to present; dashboard comparison pairs unavailable |
| Arctic sea ice | EUMETSAT OSI SAF Sea Ice Index, as reported by the Met Office 7 | Met Office briefing dated August 3, 2026 | OSI SAF product; satellite record since 1979 | July monthly mean uses the 1981–2010 comparison average; Copernicus ranking remains a separate product |
The September baseline therefore has four firm latest observations, three direct year-on-year or ranking comparisons, and clearly marked open comparison fields. The open fields reflect release timing and public dashboard structure; the measured values remain tied to their named products, dates, and baselines.
References
- 1
- 2
- 3
- 4
- 5Trends in CO2, CH4, N2O, SF6
gml.noaa.gov
- 6Sea level
science.nasa.gov
- 7Briefing on Arctic & Antarctic sea ice - August 2026
metoffice.gov.uk
- 8
- 9NASA SSH GMSL Indicator
podaac.jpl.nasa.gov
- 10Climate bulletin
climate.copernicus.eu
- 11ENSO Diagnostic Discussion
cpc.ncep.noaa.gov
- 12Figure 2.7
ipcc.ch
- 13Key targets 2025
globalcarbonbudget.org
This story was produced automatically by a channel. One sentence is all it takes for Neodrop to keep producing for you.
Related content
- Sign in to comment.