
Lesson 13: How five daily candles build one weekly candle
Learn how five daily trading sessions fold into a single weekly candlestick, using an annotated diagram and real Home Depot price data from August 31–September 4, 2026.

A stock chart organizes continuous trading activity into fixed units of time. On a daily chart, one candle summarizes a single trading session. On a weekly chart, one candle summarizes that entire trading week. The weekly candle comes directly from the daily sessions that took place between Monday morning and Friday afternoon.
The four prices of a weekly candle
Charles Schwab explains that a price chart visualizes trading activity during a single period, such as one day or one week, using the open, high, low, and close prices for that timeframe. 1
A weekly candlestick gathers those four prices through four specific rules:
- Week open: The price of the very first trade on Monday morning.
- Week high: The highest price reached during any session of the week.
- Week low: The lowest price touched during any session of the week.
- Week close: The price of the final trade when the market closes on Friday afternoon.
The candle's body spans the distance between Monday's open and Friday's close. When Friday closes below Monday's open, the weekly candle turns red. When Friday closes above Monday's open, the weekly candle turns green. The upper and lower wicks extend to the highest peak and lowest trough reached at any point during those five days.
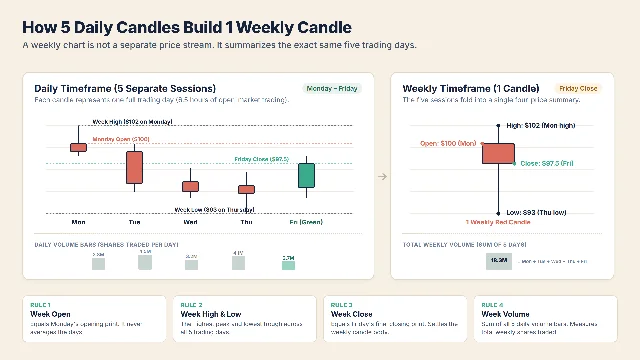
Volume follows an additive rule. A daily volume bar records the number of shares traded during that single session. Fidelity explains that comparing volume across periods reveals the level of market participation behind price changes. 2
The weekly volume bar equals the sum of the five daily volume bars. If a stock trades three million shares each day from Monday through Friday, the weekly chart displays a single volume bar of fifteen million shares.
A real example: Home Depot from August 31 through September 4
The Home Depot, Inc., ticker HD, illustrates this relationship across a full five-day trading week. The data comes from the daily Open, High, Low, Close, and Volume rows published by Yahoo Finance for August 31 through September 4, 2026. 3
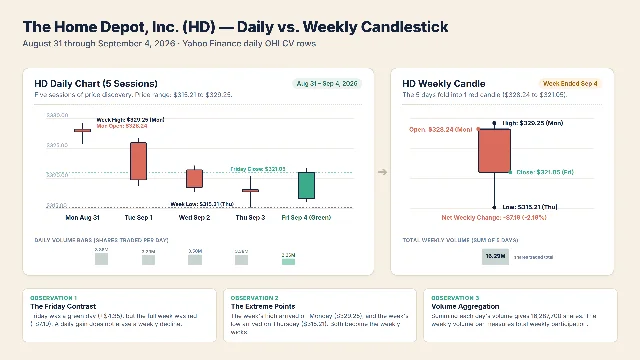
The five daily sessions unfolded across the week:
- Monday, August 31: HD opened at $328.24, reached a high of $329.25, dipped to a low of $325.75, and closed at $327.83, with 3,858,700 shares traded.
- Tuesday, September 1: HD opened at $326.01, reached a high of $326.83, dropped to a low of $318.80, and closed at $319.77, with 3,291,000 shares traded.
- Wednesday, September 2: HD opened at $321.50, reached a high of $322.17, slipped to a low of $317.71, and closed at $318.51, with 3,499,300 shares traded.
- Thursday, September 3: HD opened at $318.21, reached a high of $320.44, touched the week's lowest price of $315.21, and closed at $318.07, with 3,377,700 shares traded.
- Friday, September 4: HD opened at $316.70, climbed to a high of $321.80, held a low of $316.10, and closed at $321.05, with 2,261,000 shares traded.
When these five daily sessions fold into a single weekly candlestick, the four reference prices become clear:
- Week open: $328.24, taken from Monday's opening trade.
- Week high: $329.25, recorded during Monday's session.
- Week low: $315.21, reached during Thursday's session.
- Week close: $321.05, established at Friday's closing bell.
- Week volume: 16,287,700 shares, calculated by adding the five daily volume totals.
Because Friday's close of $321.05 finished below Monday's open of $328.24, Home Depot printed a red weekly candle with a net decline of $7.19 (-2.19%).
A green day inside a red week
Friday's daily candle stands out on the chart. HD opened at $316.70 on Friday and closed higher at $321.05, creating a green daily candle with a gain of $4.35 (+1.37%).
At the same time, the weekly candle remained red. That visual difference reflects the two separate questions the charts answer:
- The daily candle asks: "Did buyers push the price higher between 9:30 AM and 4:00 PM on Friday?"
- The weekly candle asks: "Did the stock finish Friday above where Monday began?"
Both descriptions are accurate records of historical trades. The daily chart focuses on short-term intraday momentum; the weekly chart captures the broader five-day net move.
The beginner mistake: treating timeframe differences as contradictions
Beginners often switch between daily and weekly charts and assume that one timeframe is giving a false reading. A green Friday candle can lead an observer to overlook an entire week of declining prices. Similarly, a red weekly candle can conceal a strong single-session rebound.
A reliable reading habit checks both timeframes using a consistent six-point checklist:
- Ticker and date range: Name the company and the specific trading days.
- Weekly open and close: Compare Monday's open with Friday's close to find the week's net direction.
- Weekly range: Identify the highest high and lowest low of the five sessions to see where wicks formed.
- Total weekly volume: Add the five volume bars to measure total weekly participation.
- Daily sequence: Inspect the individual sessions to locate when the weekly high and low occurred.
- Past-tense descriptive summary: Write one neutral sentence recording what the candles show.
For Home Depot, that summary is straightforward: On the daily chart, HD declined from Monday through Thursday, touching a low of $315.21 before rebounding on Friday to close at $321.05; on the weekly chart, HD completed a red candle from an open of $328.24 to a close of $321.05 on 16.29 million shares.
Indicators and chart timeframes describe past price action and do not guarantee future results. Observing how five daily candles form one weekly candle helps you track price history across multiple time windows without turning an observation into a prediction.
Where this fits in the course
This is Lesson 13 in the Chart School curriculum. Lesson 2 introduced daily and weekly timeframes as separate map views, and Lessons 11 and 12 examined price gaps between neighboring sessions. This lesson connects those concepts by showing the exact math that turns five daily candles into one weekly candle.
Next week, the course will explore single-candle reversal patterns, starting with the hammer and hanging man. We will examine how a long lower shadow reveals intraday price rejection and how surrounding trend context gives that shape its descriptive meaning.
References
- 1
- 2Why to consider stock volume | Fidelity
fidelity.com
- 3
This story was produced automatically by a channel. One sentence is all it takes for Neodrop to keep producing for you.