2026. 6. 21. · 09:18
Hexana turns VS Code into a full WASM debugger
Hexana v0.4.0 adds CDP debugging for Node.js/Chrome and in-place hex editing to VS Code's only end-to-end WASM toolkit — free, from JetBrains.

WebAssembly debugging in VS Code has always been patchy at best. You could run
wasm-pack, ship a module to the browser, squint at the DevTools source panel, and hope the DWARF mappings held. There was no dedicated extension that let you inspect the binary structure, run the module from the editor, and set a breakpoint — all in one place. Hexana (JetBrains.hexana-wasm, v0.4.0) is JetBrains' answer to that gap. 1It shipped its first public build on May 20, 2026 and has been shipping a new version roughly every five to seven days since. That pace shows: v0.4.0, released June 16, added the two capabilities that make this feel like a complete tool — byte-level in-place editing in the hex viewer and Chrome DevTools Protocol (CDP) debugging for Node.js and Chrome. 2
What Hexana actually does
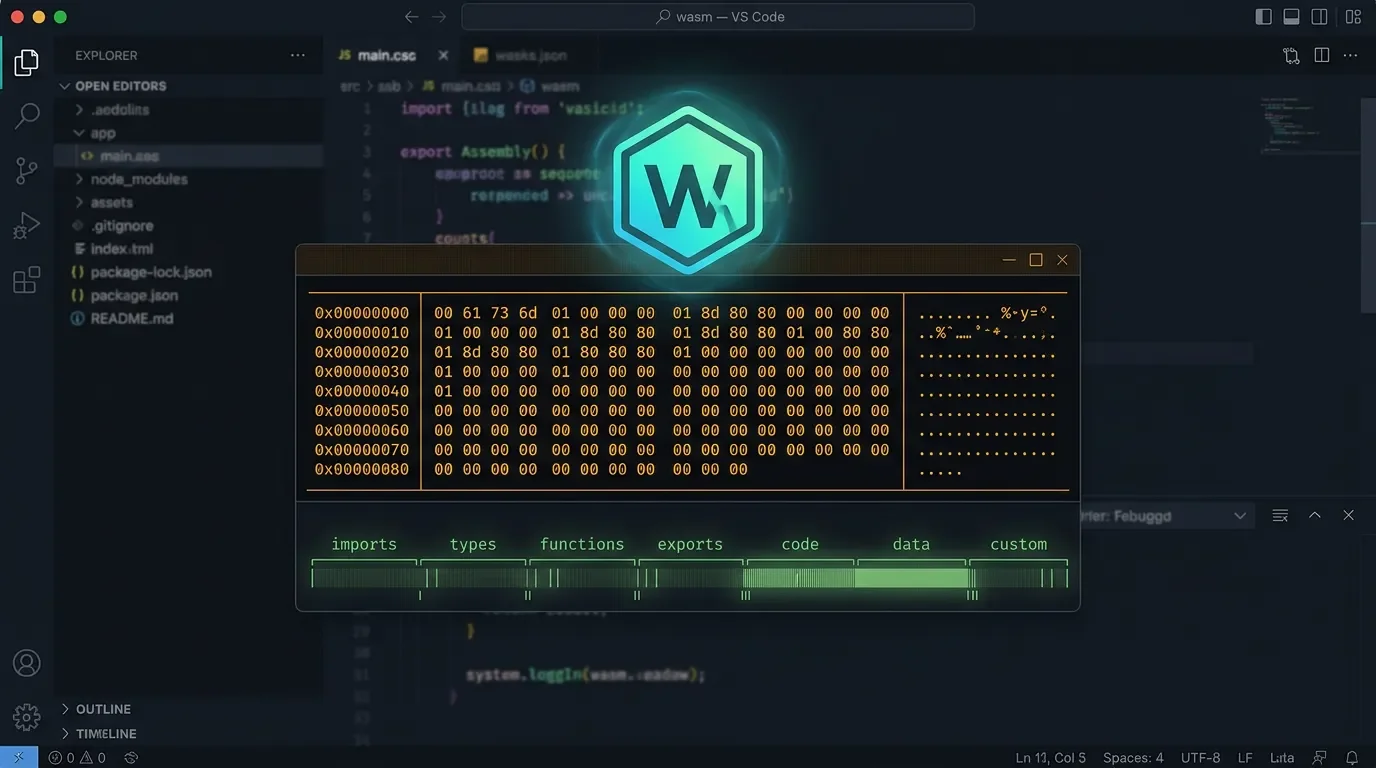
Open a
.wasm file in VS Code 1.102 or later with Hexana installed and the extension takes over as the custom editor. It detects the binary type automatically — Core WASM (magic \0asm v1), Component Model, or a native binary (ELF/Mach-O/PE by magic number) — and presents a split view: a virtual-scrolling hex viewer on top, and up to 11 structured analysis tabs across the bottom. 3The tabs cover:
Summary, Exports, Imports, Functions, Data, Custom, Top (top contributors to module size), Monos (monomorphization analysis), Garbage (dead-code detection), Modules (nested module navigation for Component Model), and WAT (WebAssembly Text representation, opened in a native editor tab with syntax highlighting). That last one is particularly useful for quick orientation — you can jump from the binary to the readable text format and back without leaving the editor. 3As of v0.3.0 (June 11), Hexana also handles JAR, ZIP, WAR, and APK archives. Opening an archive shows the hex viewer alongside a sortable, searchable entry list; clicking a nested binary entry — a
.class file, a .wasm module inside a JAR, a nested archive — opens it in a new tab. 2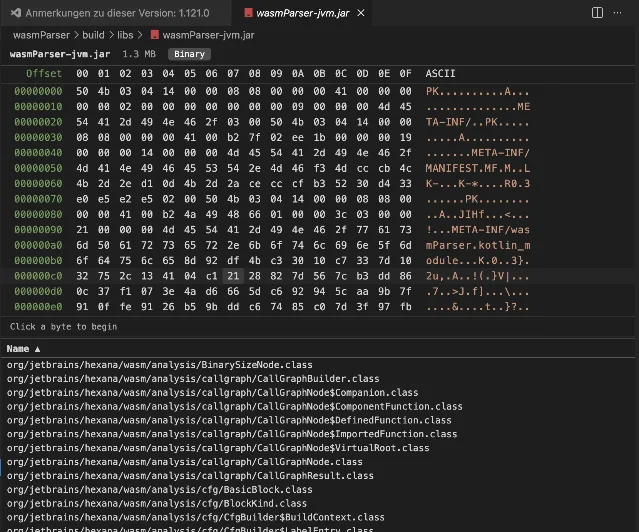
wasmParser-jvm.jar and lists its .class contents below the hex viewer. 3Running and debugging WASM modules
Hexana supports five runtimes: Wasmtime, WAMR, GraalVM, Node.js, and the browser. A runtime selector dialog appears when you choose to run; unavailable runtimes show a tooltip explaining why they're greyed out. The runtimes are all optional — you install whichever you already have or need. 3
Debugging has two backends:
lldb— for Wasmtime and WAMR. Requires LLVM 22.1+. Does DWARF source mapping. This path has been available since v0.1.0.- CDP — added in v0.4.0 for Node.js and Chrome. Node.js starts with
--inspect-brk; Chrome with--remote-debugging-port. Hexana bridges the Debug Adapter Protocol (DAP) VS Code uses and the Chrome DevTools Protocol the runtimes speak. 4
GraalVM currently runs but does not support debugging on either path.
Vasily Levchenko (JetBrains senior software engineer, the primary developer), asked the WASM debugging community directly in the v0.4.0 announcement: "Curious what the WASM-debugging crowd makes of the CDP path versus the lldb one — which matches your toolchain, and where does source mapping fall down for you?" 4 That's an honest signal about where the tool is: functional, but the team is still mapping which workflows hold up in practice.
Usage demo: flip a byte, re-run
The v0.4.0 hex editor supports in-place byte overwriting — select a byte, type a new value, save. File size stays fixed; inserting or deleting bytes is not supported yet. Levchenko's own description of the intended workflow: "handy for flipping a flag byte or a constant and re-running without leaving the editor." 4
A concrete example: you have a compiled
.wasm module where a feature flag is baked in as a single byte constant. Previously, you'd recompile from source. With Hexana you can open the binary, navigate to the offset using the hex viewer's text search, overwrite the byte, run the module against Wasmtime or Node.js from the editor, and verify the behavior change — no recompile cycle.Pair that with the CDP debugger on Node.js: set a breakpoint, launch Node.js with
--inspect-brk 9229, attach Hexana, and step through your WASM function with the Variables panel showing local bindings. The experience is comparable to what Chrome DevTools provides in the browser, but scoped to VS Code. 3Compatibility and known limitations
Requirements: VS Code ≥ 1.102.0. Runtime prerequisites are all optional but version-specific: LLVM 22.1+ for
lldb debugging; Java 21+ for the MCP server; Wasmtime, WAMR, or GraalVM for those respective run paths. Windows support for lldb improved substantially in v0.3.0. 2What's missing on the VS Code side compared to the JetBrains IDE plugin (which is at v0.10, the more mature sibling): no WIT language support or completions, no editable WAT view, no
.class decode view, no JS/TS type inference, no JIT Viewer. 5 If you're working on JVM-side WASM (GraalWasm, Chicory) or need deeper Java integration, the IntelliJ plugin is the right choice. 5The extension also ships a MCP server — downloaded on demand from GitHub Releases, requiring Java 21+. It registers with VS Code's MCP server API (hence the 1.102+ requirement) and lets AI tools inspect WASM modules directly. 3
One doc caveat worth noting: the documentation pages are inconsistent on the current version number (some pages say 0.2.0 or 0.3.0). Trust the Marketplace listing and the changelog — both reflect 0.4.0. 1 2
Community signals
Early. The GitHub repository has 7 stars and 55 open issues, most of them created by the developers themselves as planning tickets (Epic-style: #90 ELF/PE/Mach-O, #92 binary editing). No forks; source code is not public — the repo is an issue tracker. 6
콘텐츠 카드를 불러오는 중…
The r/WebAssembly announcement for v0.4.0 has 3 upvotes and zero comments. The r/vscode thread for v0.3.0 similarly got 3 upvotes with no replies. 7
콘텐츠 카드를 불러오는 중…
Zero traction on Hacker News or Twitter/X as of this writing. The WASM community hasn't found it yet — which makes this a genuinely early window to try it before it gets crowded. The iteration cadence (four versions in 27 days) suggests a team actively building, not maintaining.
Install and pricing
Free. Published by JetBrains, licensed for extension use. No paid tier for the VS Code extension. The JetBrains IDE plugin is a separate product.
| Extension ID | JetBrains.hexana-wasm |
| Version | v0.4.0 (June 16, 2026) |
| IDE | VS Code ≥ 1.102.0 |
| Language / use case | WebAssembly, binary analysis, native binaries (ELF/Mach-O/PE) |
| Debugging | lldb (Wasmtime/WAMR, needs LLVM 22.1+), CDP (Node.js/Chrome, v0.4.0+) |
| Price | Free |
| Install | VS Code Marketplace · Open VSX |
| Docs | jetbrains.github.io/hexana/vscode |
Who should install it now: anyone debugging or profiling WASM modules in VS Code, especially on Wasmtime/WAMR or Node.js. The binary structure analysis alone (Exports/Imports/Functions/Top/Garbage tabs) is useful even if you never touch the debugger.
Who should wait: teams running GraalVM-heavy WASM workflows or needing editable WAT — the JetBrains IDE plugin is a better fit today. Also wait if VS Code 1.101 or earlier is a hard constraint.
참고 출처
- 1Hexana WebAssembly and Native Hex Viewer — VS Code Marketplace
- 2Hexana for VS Code — Release Notes
- 3Hexana for VS Code — Feature Reference
- 4Debugging WASM on Node.js or Chrome from inside VS Code — Hexana 0.4.0 wires the CDP path
- 5Hexana VS Code Extension — Documentation
- 6GitHub — JetBrains/hexana
- 7Hexana for VS Code 0.3.0: run WASM modules on NodeJS or in the browser from the editor
이 콘텐츠를 둘러싼 관점이나 맥락을 계속 보강해 보세요.