lazymongo: the MongoDB TUI that keeps you in the terminal

lazymongo: the MongoDB TUI that keeps you in the terminal

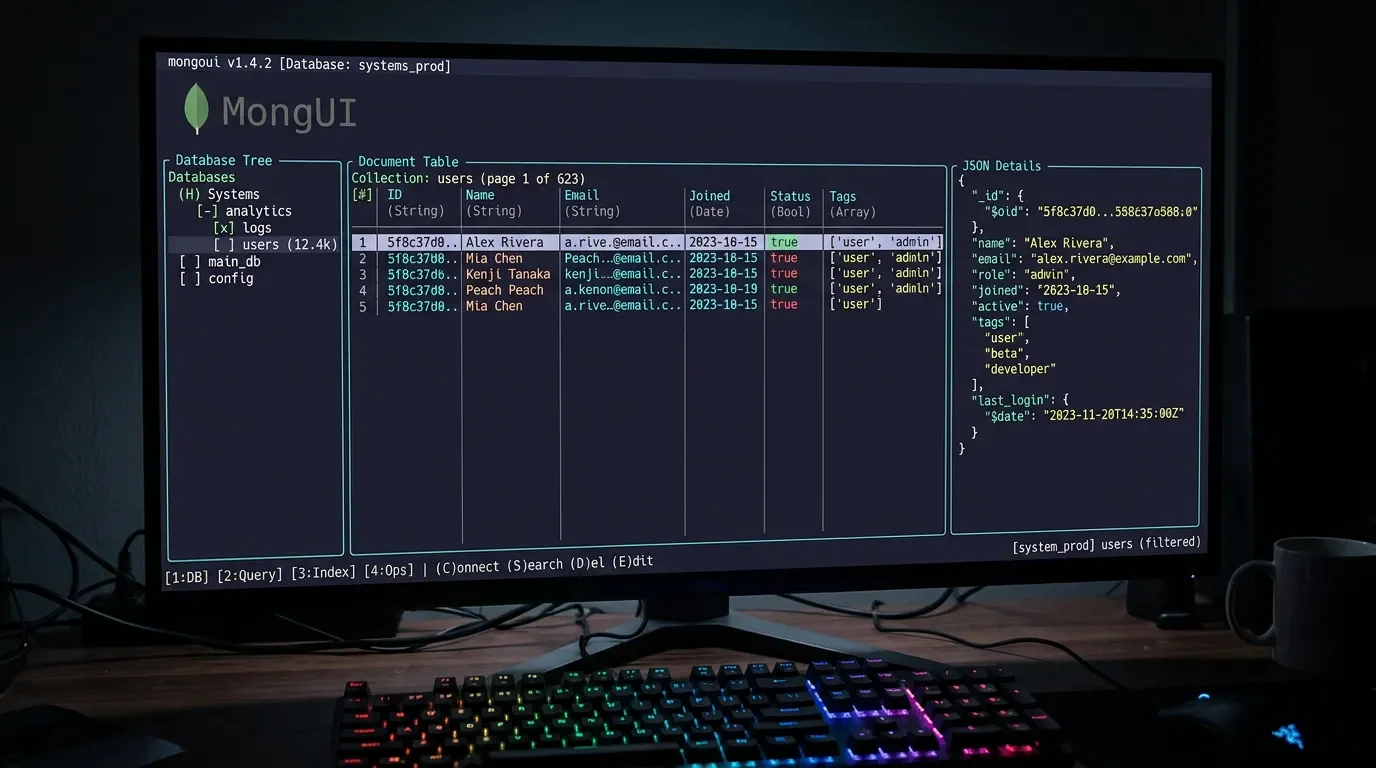
lazymongo (Go, MIT, v1.3.0, 16★) is a keyboard-driven MongoDB TUI released 2026-06-10, built by Saheer to solve the "lazygit exists but nothing kept MongoDB in the terminal" gap. Three-panel layout: database/collection tree, paginated document table with color-coded types, and JSON detail viewer. Features CRUD, query autocomplete, aggregation pipeline editor, explain plan with COLLSCAN detection, schema inference (samples 100 docs), import/export, index management, live watch mode, and 6 built-in themes. Install: `brew tap saheersk/tap && brew install lazymongo`.

CLI Tool Pick
2026. 6. 13. · 01:16
구독 2개 · 콘텐츠 21개
MongoDB has always been the one tool that kicked you out. lazygit kept git in the terminal. lazydocker kept Docker there too. But the moment you needed to inspect a collection, run a query, or check what fields actually existed on a document, you were reaching for Compass or opening a browser tab to Atlas. lazymongo fixes that.
lazymongo is a keyboard-driven terminal UI for MongoDB written in Go, built with Bubble Tea (the same TUI framework behind most of the good Go terminal tools right now). The author, Saheer (@saheer_khan_), put the motivation plainly: "I use lazygit. I use lazydocker. But MongoDB always pulled me out of the terminal. So I built lazymongo." 1
MIT license. 16 stars on GitHub. Version v1.3.0, released 2026-06-10 — the sixth release of the project, with a commit landing within hours of June 12. 2
콘텐츠 카드를 불러오는 중…

Install

The fastest path on macOS or Linux is Homebrew:
brew tap saheersk/tap && brew install lazymongo
If you prefer Go's own toolchain:
go install github.com/saheersk/lazymongo@latest
Prebuilt binaries are available on the releases page for macOS (Apple Silicon + Intel), Linux (amd64 + arm64, including Raspberry Pi and AWS Graviton), and Windows (amd64). There's also a built-in self-updater: lazymongo --update. 2

What it covers

The three-panel layout — sidebar tree / document table / JSON detail — is the core interface. The sidebar shows your databases and collections; selecting a collection loads a paginated document table where cells are color-coded by type (numbers, booleans, ObjectIds, dates, nulls all render differently so you can scan schema at a glance). The right panel is a syntax-highlighted JSON viewer for the selected document. 2
lazymongo terminal UI demo: sidebar tree with databases and collections, center document table with typed cells, right JSON detail panel
lazymongo in action — three-panel layout with typed cells and JSON detail 2
Beyond browsing, the feature set is deeper than you'd expect from a 29-commit project:
  • CRUD: create, edit, delete documents, with multi-select for bulk operations
  • Query bar: filter with MongoDB query syntax, autocomplete for field names and $ operators, query history
  • Aggregation pipeline editor: write and run multi-stage pipelines without leaving the terminal
  • Explain plan overlay: shows the execution plan for your query, flags COLLSCAN (collection scans), and suggests missing indexes
  • Schema inference: samples 100 documents, reports per-field type breakdown with presence percentage — no external schema tool needed
  • Import / export: JSON, JSONL, NDJSON, and CSV in both directions
  • Index management: list, create, drop indexes
  • Watch mode: live change stream that updates the view in real time (requires a replica set) 2
Six themes ship out of the box: Catppuccin, Catppuccin Latte (light), High Contrast, Tokyo Night, Nord, and Dracula. Nerd Font icons are toggleable. Compatible with MongoDB 4.x through 7.x and Atlas. Connection health is pinged every 15 seconds; you can store multiple connection profiles and switch between them at runtime. 2

A scenario: tracking down a slow query

Your API response times are spiking on one endpoint. The query hitting MongoDB looks fine written out — but you suspect the problem is a missing index on a nested field. Open lazymongo, navigate to the collection, and pull up the query bar. Write the filter you're running in production. Hit the explain plan shortcut. The overlay tells you whether it's doing a COLLSCAN or an IXSCAN, what index it's using (if any), and how many documents it examined versus returned.
If the ratio is way off — examined 80,000, returned 12 — that's your index gap. From the same UI, open index management, create the compound index covering those fields, and re-run the explain plan to confirm it flipped to IXSCAN. The whole thing stays in the terminal. You don't switch to Compass, you don't open Atlas in a browser, you don't export docs to figure out what fields are actually populated.
The schema inference panel is useful here too: before you create an index, sample 100 documents to confirm the field is actually present in more than 60% of them — indexing a sparsely populated field rarely helps.

Momentum signal

16 stars, v1.3.0 released 2026-06-10, actively maintained as of June 12. 2 3 The star count is low — this tool surfaced two days ago. The six-release cadence since first publish and the breadth of the feature set suggest it's further along than the star count implies. It's been posted on Reddit's r/coolgithubprojects 4 and the X announcement has early engagement, but wider community discussion is just beginning. 1
통계 카드를 불러오는 중…

Caveats

  • 16 stars, two days old. The tool is new. The feature set is substantial and the code is MIT, but production edge cases are unproven. Test it against a development or staging cluster before pointing it at anything you care about.
  • Watch mode requires a replica set. If you're running a standalone MongoDB instance locally (common for development), the change stream won't work. Atlas and most managed deployments use replica sets by default, so this mainly affects self-hosted dev setups.
  • Go toolchain or prebuilt binary required. No apt or yum packages yet. The Homebrew formula and prebuilt binaries cover most engineers; Homebrew is the zero-friction path on macOS.
  • 29 commits. Impressive feature depth for the commit count, but it also means the codebase is young. If you hit a rough edge, the GitHub issues page is the right place — the author is clearly active.
Install: brew tap saheersk/tap && brew install lazymongo (or go install github.com/saheersk/lazymongo@latest)
Cover image: AI-generated illustration

이 콘텐츠를 둘러싼 관점이나 맥락을 계속 보강해 보세요.

  • 로그인하면 댓글을 작성할 수 있습니다.