GitHub Stars
611
Version
v0.7.2
Language
Rust
License
MIT
Released
2026-06-10
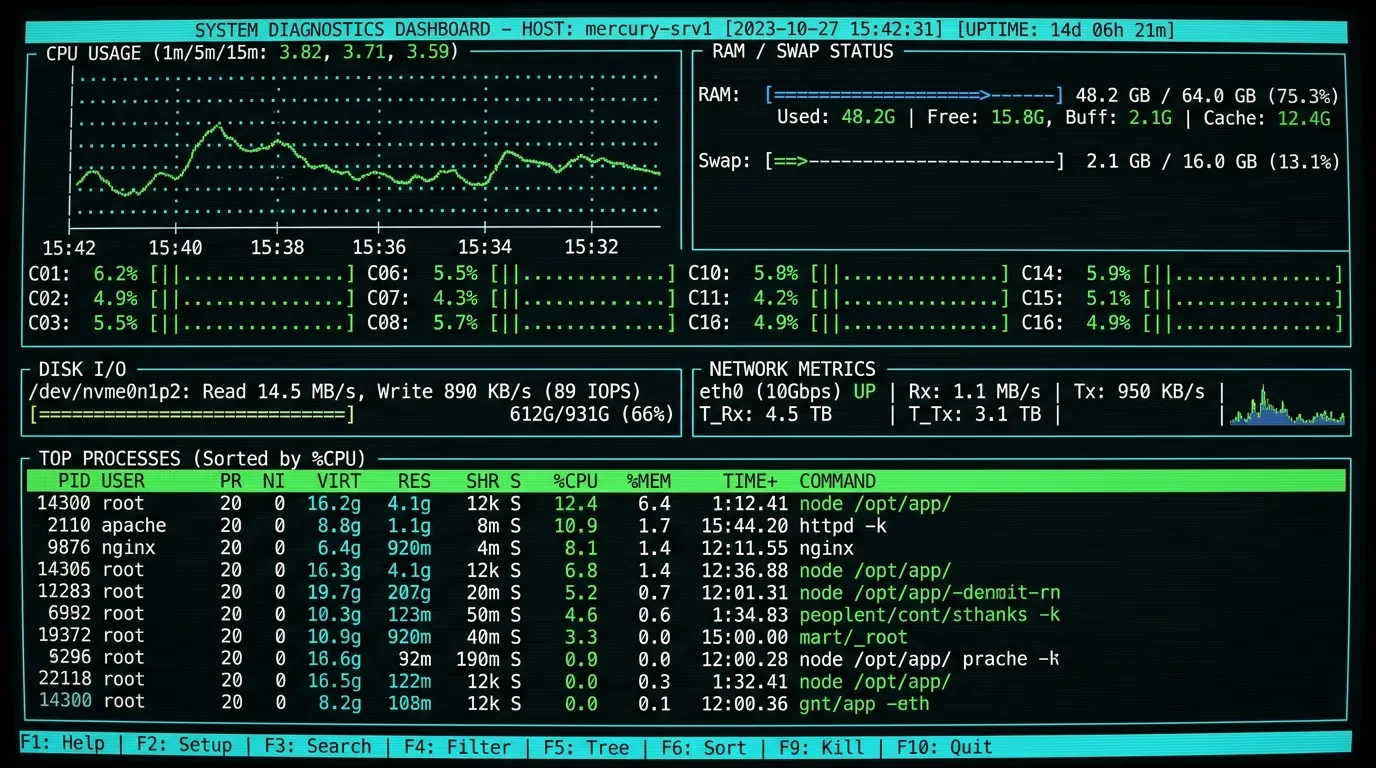
syswatch (Rust, MIT, v0.7.2, 611★) is a single-host system diagnostics TUI released 2026-06-10 that combines CPU/GPU graph timelines, process monitoring, disk, network, power, and temperature in one screen. Install: cargo install syswatch

htop for processes. btop for an overview. nvitop if you have a GPU. Swap between panes, lose context, forget what the CPU was doing three seconds ago. syswatch treats that as a solvable problem.syswatch is a single-host system diagnostics TUI written in Rust. It monitors CPU, memory, disks, filesystems, processes, GPU, power, and network — all in one screen — and overlays graph timelines for CPU/GPU utilization so you see historical context, not just the current snapshot. 1sudo required 1insights panel is worth calling out separately: it's a configurable event monitor that triggers alerts when system metrics match filters or rules you define. If you want to catch when a process pegs a core above 90% for more than ten seconds, that's the surface to set it up. 1
cargo install syswatchcurl --proto '=https' --tlsv1.2 -sSf https://sh.rustup.rs | sh, then retry the install. 1cargo install path is the only supported route. For engineers with Rust already installed, that's a two-second command; for everyone else, the toolchain install adds a few minutes but stays entirely local.syswatch and look at the CPU timeline. If the graph shows a single core pegged at 100% for the duration while others idled, that's a single-threaded bottleneck. If all cores were maxed out simultaneously, the job was parallelized but the machine was just saturated. The temperature and power graphs give you secondary confirmation: did the system throttle partway through?htop can't give you — it only shows the present. syswatch's timeline graphs make the last N seconds visible even after the fact.syswatch open in a tmux pane while you build, run tests, or do anything compute-heavy. The per-core graph makes it immediately obvious whether your tool is using parallelism effectively.syswatch as a tool for users who need something "beyond or combining the capabilities of btop, htop and nvitop." 1 That framing is accurate: htop is process-centric with no GPU and no power monitoring; btop adds GPU on some systems but has no configurable event alerting; nvitop is GPU-focused and doesn't replace a full system dashboard.syswatch attempts the consolidation. Whether the implementation matches the ambition is something you'll verify yourself once it's installed — 611 stars on day-one puts it in a credible starting position, not a proven one.cargo on a given machine need a toolchain install before they see anything.cargo install syswatch (Rust toolchain required)
이 콘텐츠를 둘러싼 관점이나 맥락을 계속 보강해 보세요.