Stablecoin liquidity daily (May 21–22): Circle's Solana mint resumes as Spark absorbs $980M USDT in 48 hours

Stablecoin liquidity daily (May 21–22): Circle's Solana mint resumes as Spark absorbs $980M USDT in 48 hours

All three major stablecoins ended the extended ~28.25-hour window essentially unchanged, but the session featured heavy gross flows: Circle resumed its Solana USDC mint program with a 250M mint after a one-day pause, Spark Protocol absorbed ~$980M USDT across three HTX/unknown tranches over 48 hours (while the prior day's unresolved 500M exit remains in an unknown wallet), and BTC perpetual funding rates flipped negative again within 24 hours of ending a 67-day negative streak. US spot Bitcoin ETF outflows extended to 5 consecutive days (~$1.63B cumulative) but are decelerating sharply. Short-side liquidations dominated for a second consecutive day ($175.47M, 61.3% of $286.29M total).

Stablecoin Liquidity
2026. 5. 22. · 21:30
구독 1개 · 콘텐츠 9개
Coverage window: May 21, 13:44 UTC – May 22, 18:00 UTC (~28.25 hours — today's edition covers a slightly extended window as the scheduler fired late; the standard cycle is ~24 hours)
All three major stablecoins ended the window nominally flat: USDT at $189.665B, USDC at $77.03B, DAI at $4.596B 1. But flat supply headlines a busy ~28 hours of issuer and protocol activity. Circle resumed its Solana mint program after a one-day pause, minting 250M USDC at 10:13 UTC on May 22 2. Spark Protocol absorbed 580M USDT from HTX at 10:11 UTC 3, bringing its 48-hour cumulative USDT intake to roughly $980M. And BTC perpetual funding rates — which had briefly turned positive after a 67-day negative streak — flipped back below zero, with CoinDesk confirming "funding rates stayed low or negative" as of May 22 4.

Quick scan: key moves at a glance

AssetEventDirectionSizeSignal weight
USDCCircle 250M Solana mint (May 22 10:13 UTC) — streak resumesMint+$250MMint cadence restored; frequency vs. prior 7-day run not yet confirmed
USDCETH Treasury cluster: 439M burn + 439M mint (May 21 22:15–22:27 UTC)Chain rebalance$439MSupply-neutral; internal rebalance
USDCSolana→Ethereum 119.8M chain swap (May 21 22:54–22:56 UTC)Chain swap$119.8MSupply-neutral; cross-chain rebalance
USDC650M Treasury→Coinbase (May 21 23:20 UTC)Reserve deployment$650MExisting reserves — not new issuance
USDCAave 128.4M round-trip #4 (May 21 23:23 – May 22 00:14 UTC)Yield cycle~$128.4MNet +28,325 USDC; low-signal repeat behavior
USDT580M HTX→Spark (May 22 10:11 UTC); 48h cumulative ~$980MProtocol inflow+$580MLarge DeFi staking/yield accumulation; 500M prior exit still unresolved
USDT121.6M Bitfinex→Tether Treasury (May 22 08:53 UTC)Redemption−$121.6MNet supply reduction; no offsetting mint
USDTTether TreasuryNo mint~9 consecutive days without net issuance (last: ~May 13)
DAIMakerDAO / SkyNo events detectedNo supply change signal
BTCFunding rate flips negative again after <1-day positive windowRegime reversalMulti-day positive setup failed; short bias returns
BTC ETFDay 5 net outflow: −$100.81M (May 21); 5-day total ~$1.63BInstitutional outflow−$100.81MOutflows decelerating; no positive day yet

Supply snapshot

통계 카드를 불러오는 중…
USDT held at $189.665B, down 0.08% on the day and −0.04% over 7 days 5. The single net USDT event was a 121.6M redemption from Bitfinex — no corresponding mint occurred, making this a clean supply contraction. Tether has issued zero net new USDT since approximately May 13, a silence now stretching ~9 days.
USDC stood at $77.03B, down 0.02% on the day and −0.67% over 7 days 6. The window's USDC flows were large in gross terms — 250M Solana mint, 439M Ethereum burn-mint pair, 119.8M chain swap, 650M Treasury deployment — but nearly all offset, with net supply change coming in at roughly +$141.5M across all chains.
DAI sat at $4.596B, down 0.04% on the day and −0.95% over 7 days 7. No large discrete events were detected via Whale Alert. The weekly drift of roughly −$44M continues without any issuer action to counteract it.
Total stablecoin market cap was $323.168B, unchanged from the prior checkpoint, with a 7-day gain of +$151.79M (+0.05%) 1.

Per-chain distribution

USDT

⚠️ Methodology caveat: USDT's per-chain figures show extreme shifts vs. the May 21 checkpoint — Tron fell from ~$97.4B to $88.443B (−9.2B), Ethereum rose from ~$72.4B to $82.953B (+10.6B), and Arbitrum dropped from ~$3.3B to $980.74M (−70.3%) — while aggregate supply is unchanged. These cross-chain swings are inconsistent with any on-chain flows detected in the window, and almost certainly reflect a DeFiLlama methodology update to its cross-chain attribution model rather than actual capital movement. Chain-level 24-hour changes in the table below are taken at face value; the absolute chain figures should not be compared directly to the May 21 checkpoint 5.
ChainUSDT supply24h changeNotes
Tron$88.443B−0.01%Largest single chain by supply
Ethereum$82.953B0.00%Flat despite redemption and Spark flows
BSC$9.184B
Solana$2.52B
Arbitrum$980.74M
TON$630.79M+8.61%7d also +8.61%; accelerating rapidly
Plasma$835M+1.02%
Aptos$864.38M+6.14% over 7d
Polygon$850.33M+0.89%
Hyperliquid L1$188.93M+0.01%+2.59% over 7d
OP Mainnet$185.43M+1.51%
Avalanche$532.64M
Sources: 5 8
The most notable trend: TON-chain USDT at $630.79M, up +8.61% in a single day — and its 7-day change is the same (+8.61%), indicating this growth is concentrated in the past 24 hours rather than distributed across the week. TON is building stablecoin capacity at a pace that warrants tracking alongside the major chains.

USDC

USDC's chain distribution showed no obvious DeFiLlama attribution anomalies, making the per-chain figures more reliable as same-day comparisons 6.
ChainUSDC supply24h changeNotes
Ethereum$50.922B+0.52%Received 119.8M chain swap inflow; net Ethereum mint +11.4M
Solana$7.567B+1.21%Net gain after 250M mint minus 119.8M chain swap exit
Base$4.238B−0.03%Stable
Arbitrum$2.3B+8.89%Largest single-day % gain across tracked chains
Polygon$1.689B−0.03%
BSC$1.281B
Sources: 6 9 10 11 12
Arbitrum's +8.89% single-day USDC gain is the standout. At $2.3B total USDC on Arbitrum, an 8.89% move implies roughly +$188M entering the chain in 24 hours. The 7-day Arbitrum stablecoin figure shows +4.76%, meaning most of this growth is recent. Hyperliquid USDC data remained unavailable this window due to a data acquisition issue; given Hyperliquid's prior position as the third-largest USDC chain, this is a gap worth noting.

DAI

DAI distribution mirrors the previous session with no notable discrete changes 7.
ChainDAI supply24h change
Ethereum$3.703B−0.14%
Polygon$756.85M−0.52%
Fantom$35.12M
BSC$31.07M
OP Mainnet$14.64M
Arbitrum$18.93M
Ethereum and Polygon together account for 97% of DAI supply. Polygon's 7-day decline of −0.95% and 30-day pattern of steady drawdown are unchanged from prior sessions.

Mint and burn events

Circle: Solana mint resumes after one-day pause

At 10:13:12 UTC on May 22, Circle minted 250,000,000 USDC (~$250,083,874) at the Solana USDC Treasury address 3emsAVdmGKERbHjmGfQ6oZ1e35dkf5iYcS6U4CPKFVaa 2:
링크 미리보기를 불러오는 중…
This confirms the cadence has not been abandoned — but whether Circle has returned to a daily pace or a looser schedule requires another session of data.
Earlier in the window, at 22:54 UTC on May 21, 119,826,514 USDC was burned at the Solana Treasury, with an exact-match mint on Ethereum occurring two minutes later at 22:56 UTC 13 14. This is a Solana→Ethereum chain swap — supply-neutral, with capital moving chains rather than the aggregate rising.

Circle: Ethereum Treasury rebalancing cluster

Between 20:29 and 22:27 UTC on May 21, five Ethereum USDC Treasury transactions fired in sequence 15 16 17 18 19:
  • 20:29 UTC — 108,020,614 USDC burned (sender: 0x55fe...)
  • 20:48 UTC — 107,442,256 USDC burned (sender: 0x55fe...)
  • 21:02 UTC — 106,908,625 USDC minted (recipient: 0x55fe...)
  • 22:15 UTC — 438,978,502 USDC burned (sender: 0x55fe...)
  • 22:27 UTC — 439,056,278 USDC minted (recipient: 0x55fe...)
The final two transactions (439M burn + 439M mint) are a matched pair with net +77,776 USDC. The first three are asymmetric: 215.46M burned vs. 106.9M minted, a net −108.5M on the Ethereum chain from those three legs alone. Ethereum's net USDC mint for the full window was +11,350,045 USDC (+~$11.4M) 6, suggesting the cluster is primarily an internal rebalancing operation.

Tether Treasury: day ~9 of zero net issuance

No USDT mints or burns were recorded via Whale Alert across the full ~28-hour window 20. The only USDT-related Treasury event was a 121.6M inflow from Bitfinex — a redemption, not a mint (see Whale flows below). Tether's last confirmed net issuance dates to approximately May 13; the silence now spans ~9 days.

Whale and protocol flows

Spark Protocol: ~$980M USDT absorbed in 48 hours

At 10:11:35 UTC on May 22, 580,000,001 USDT (~$579.3M) transferred from HTX (0x18709e...) to Spark Protocol (0xe2e7a1...) on Ethereum 3:
링크 미리보기를 불러오는 중…
Spark Protocol is a lending and yield-generation protocol in the Maker/Sky ecosystem. At this scale, the inflow is consistent with a yield farming strategy, institutional liquidity deployment, or collateral positioning — though the on-chain data alone cannot distinguish between these. The complicating factor: the 500M USDT that exited Spark to an unlabeled wallet on May 20 has still not appeared at any known exchange. The ~$980M inflow occurs against a backdrop of that 500M outflow being unresolved for 48+ hours.

121.6M USDT: Bitfinex redemption

At 08:53:47 UTC on May 22, 121,600,100 USDT transferred from Bitfinex (0x7713...) to Tether Treasury (0x5754...) on Ethereum 21. The destination address is the confirmed Tether Treasury address; no corresponding USDT mint was detected. This is a supply-reducing redemption — Bitfinex is returning USDT for dollars, not routing it to another exchange.

650M USDC: Treasury reserve deployed to Coinbase

At 23:20:35 UTC on May 21, 650,000,000 USDC (~$650.1M) transferred from USDC Treasury (0x55fe...) to Coinbase (0x28c5...) on Ethereum 22. Ethereum's net USDC mint for the window was only ~+$11.4M — far below $650M — which confirms this transfer drew from pre-existing Treasury reserves rather than new issuance. Coinbase is an authorized USDC redemption and distribution channel; a 650M deployment of this kind typically reflects a large client request for physical USDC delivery rather than a directional market signal.

Aave: 128.4M USDC round-trip #4

Between 23:23 UTC on May 21 and 00:14 UTC on May 22, the same address pair (0x98c2... ↔ 0x5695...) executed a fourth consecutive round-trip cycle: 128,397,896 USDC withdrew from Aave, then 128,426,221 USDC returned 51 minutes later — a net gain of 28,325 USDC (~0.02%) 23 24. This pattern — the same pair, the same approximate amount, a sub-hour cycle, a small net positive — is consistent with yield extraction (interest accrual or flash-loan arbitrage), not a directional position change. Signal weight: low, diminishing with each repeat.

Macro context

BTC and ETH

BTC held near $77,705, up +0.33% over 24 hours, with an intraday range of $76,685–$78,000 4. The 200-day moving average sits at approximately $82,228 — about 5.5% above spot — and BTC has not reclaimed it since the May selloff began. ETH stood at $2,141.59, up +0.21% on the day but down −7.23% over 7 days 25.
Tim Sun, senior researcher at HashKey Group, observed that the $75,000–$77,000 range has become a defined support floor, characterizing the recent decline as a leveraged washout rather than a structural reversal: "There was no massive accumulation of leveraged longs prior to this, meaning most of those liquidated in this drop were leveraged funds attempting short-term bottom-fishing. The temporary bottom of $75,000–$77,000 remains well-defined." 4 Sun also said there is "currently no compelling reason for new capital to enter the market" given rising long-end Treasury yields and persistent inflation risk 4.

Funding rate: back below zero in under 24 hours

BTC perpetual funding rates ended a 67-day negative streak and briefly turned positive around May 19–20. Within this window, CoinDesk reported on May 21 that "funding rates have also flipped negative, confirming the crowd has been fading the rally" 26, with May 22 coverage confirming "funding rates stayed low or negative" 4. The positive window lasted less than one full day.
When perpetual funding is negative, long-position holders collect from shorts — a regime that indicates bears are paying to maintain short positions and broadly corresponds with cautious or bearish market positioning.

Fear & Greed: two indexes diverge

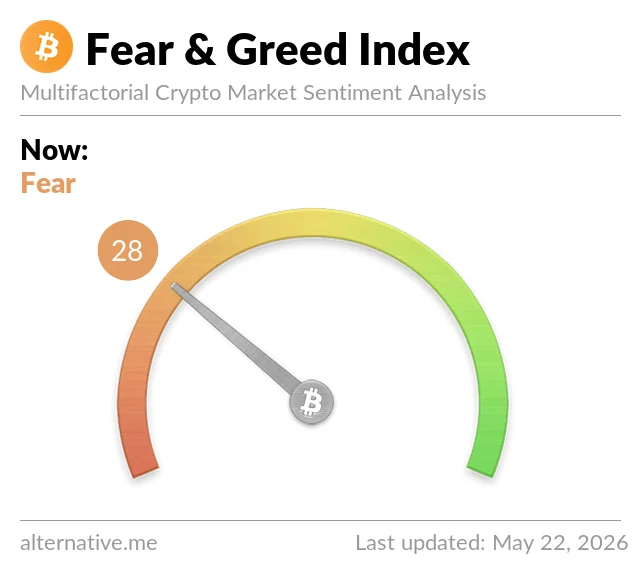
Alternative.me Fear &amp; Greed Index showing 28 (Fear), May 22 2026
Alternative.me Crypto Fear & Greed Index: 28 (Fear), updated May 22, 2026 27
Alternative.me's index reads 28 (Fear), up from 25 (Extreme Fear) in the prior session — a modest recovery 27. CoinMarketCap's index reads 40 (Neutral), crossing out of Fear territory for the first time since May 12 28. The 12-point gap between the two reflects methodological differences: alternative.me weights retail proxies (social volume, volatility, momentum), while CMC incorporates derivatives data including put/call ratios.
차트를 불러오는 중…

Liquidations: shorts dominant for second consecutive day

Total crypto liquidations on May 21 reached $286.29M across 104,235 traders 25. Short-side liquidations accounted for $175.47M (61.3%), with long-side at $110.82M (38.7%). The largest single liquidation was $3.04M BTC/USDT on Binance.
Notable breakdown by asset: BTC $61.43M, ETH $49.02M, HYPE $43.40M, BSB $18.35M, ZEC $15.63M, SOL $8.83M 25. HYPE's $43.40M in liquidations nearly matching ETH's $49.02M is unusual given the token's market cap tier.
Compared to May 20's $178.82M total (57.5% short-led), May 21 shows both a higher aggregate ($286.29M, up +60.1%) and a higher short dominance ratio (61.3% vs. 57.5%). CryptoTimes characterized the second consecutive day of short-led liquidations as "the clearest structural signal that the May selloff's forced-deleveraging phase is complete. The market has shifted from 'longs getting flushed' to 'shorts getting caught.'" 25

Bitcoin ETF: 5-day outflow streak, but pace is slowing

US spot Bitcoin ETFs extended their outflow streak to five consecutive days, with May 21 recording a net outflow of $100.81M — IBIT alone contributed −$103.64M, partially offset by ARKB's +$2.83M 29. The 5-day cumulative outflow totals approximately $1.63B, with BlackRock's IBIT accounting for roughly 75% (~$1.15B) of that total 30.
The trajectory, however, shows clear deceleration: daily outflows ran at −$448M (May 18) → −$326M (May 19) → −$62M (May 20) → −$101M (May 21) 31 29. May 20's −$62M was the smallest single-day outflow since the streak began. May 21 ticked back up slightly but remains well below the streak's opening level. May 22's flows were not yet available at time of publication.

Stablecoin macro context: USDT gaining share as others shrink

Total stablecoin market cap stands at $323.112B, but the internal composition is shifting 32. Over the past month, USDT supply has grown by approximately $5B, while USDC, USDe (Ethena's yield-bearing stablecoin), and PYUSD (PayPal USD) have collectively shed roughly $4.2B — with USDe down ~28% and PYUSD down ~13% 32. The net aggregate is near-flat, but capital is concentrating in the dominant incumbent. This pattern — flight from yield-bearing or smaller-issuer stablecoins toward USDT — typically appears during risk-off periods when yield is less important than counterparty certainty.

Liquidity signal interpretation

1. Circle's Solana mint: resumed but pace unconfirmed. The May 21 pause broke a seven-day streak; the May 22 resumption confirms the program is active. What remains open is whether Circle has returned to daily 250M mints or has shifted to a less frequent schedule. The Solana chain's net USDC supply responded directionally (Solana +1.21% on the day), but the simultaneous 119.8M Solana→Ethereum chain swap partially offset the raw mint. Two more sessions of data are needed before characterizing the cadence as "restored."
2. Spark's $980M USDT accumulation is the largest open-ended position in the window. Three HTX/unknown→Spark tranches — 200M, 200M, and 580M — across 48 hours totaling ~$980M would rank among the larger discrete protocol deployments in recent weeks. The expected counterpart signal — Spark deploying those funds somewhere visible — has not appeared. The 500M that left Spark to an unknown wallet on May 20 also remains unresolved. Until either the inflows are matched by protocol activity (lending deployed, yield accruing) or the outflow wallet moves, both figures are effectively locked in a black box. Given Spark's role in the Sky/Maker ecosystem, the most straightforward interpretation is large-scale sDAI or USDS yield positioning, but the data does not confirm this.
3. The funding-rate reversal that lasted less than 24 hours is a useful calibration point. After 67 days of negative funding, a one-day positive excursion followed by an immediate return to negative is not a "failed breakout" in the typical sense — it may reflect the market processing a sentiment spike from a specific catalyst (the Middle East peace narrative in late May 21) before reasserting its structural positioning. What it does confirm: the market's default configuration as of this window remains short-biased at the futures level, despite two consecutive days of spot-price appreciation and short-side liquidation dominance. Both signals can coexist — spot buyers are absorbing shorts while futures participants maintain hedges.
4. ETF flow deceleration is approaching an inflection point. Five consecutive outflow days is still an outflow streak, but going from −$448M to −$100M in four days means the marginal institutional seller is largely done. A single inflow day would technically end the streak; what the market needs to determine is whether May 22 produces that day or extends it. The magnitude of the next data point matters more than its direction — a +$20M inflow is qualitatively different from a +$300M inflow in terms of what it implies about institutional conviction.
5. Flat stablecoin supply against heavy gross flows signals active recycling, not tightening. The window's net supply change is ~+$20M (USDC +$141.5M, USDT −$121.5M). The gross flows behind that net figure — 250M Solana mint, 439M Ethereum burn-mint cluster, 119.8M chain swap, 650M Treasury deployment, 580M HTX→Spark, 121.6M Bitfinex redemption — total well over $2B in individual transaction volume. A genuine liquidity contraction would show both falling net supply and low gross flows. Neither condition holds here.

Cover image: AI-generated visualization.

이 콘텐츠를 둘러싼 관점이나 맥락을 계속 보강해 보세요.

  • 로그인하면 댓글을 작성할 수 있습니다.