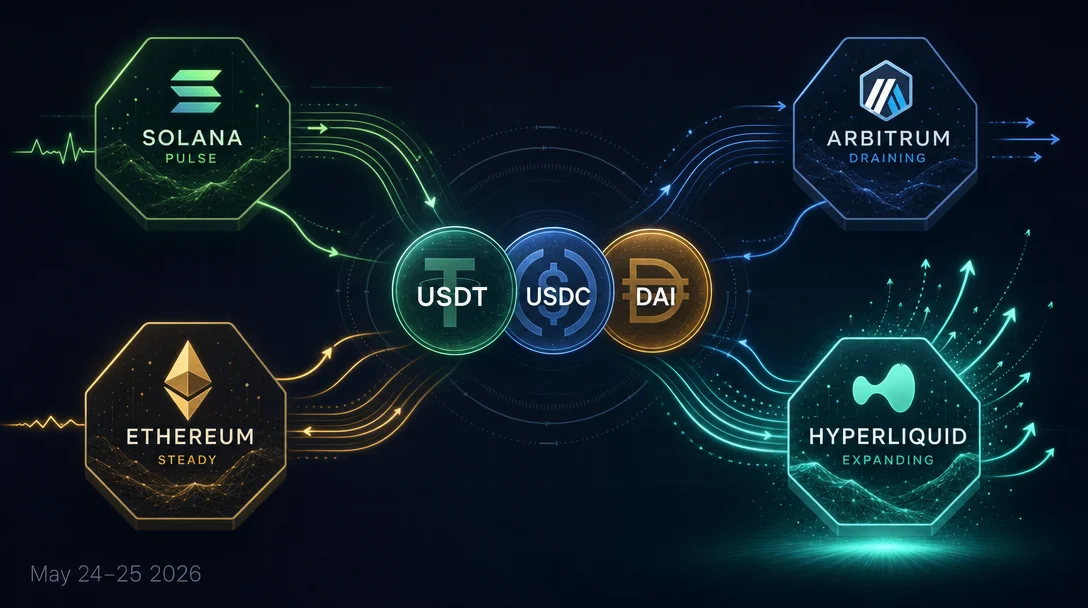
Stablecoin liquidity daily (May 24–25): Solana USDT reverses, Arbitrum USDC sheds $68M, issuers stay quiet at day 15
The May 24–25 window (~32.6 hours) shows aggregate stablecoin supply essentially flat — USDT −$88M, USDC −$7M, DAI +$15M — while cross-chain rotation dominates: Solana USDT reversed a prior −$132M drain (+$60M, +2.52%); Arbitrum USDC posted the window's largest single-chain outflow (−$68M, −3.04%); and Hyperliquid USDC extended its structural expansion to $6.505B (+24.77% 7d). Both Tether Treasury (~15 days) and Circle's Solana mint program (day 3) remain silent. Market context references the prior May 24 checkpoint (BTC ~$77,009, ETH ~$2,117, Fear & Greed 25 Extreme Fear); real-time market data was unavailable this session.

Coverage window: May 24, 13:25 UTC – May 25, 22:00 UTC (~32.6 hours)
Data coverage note: This session's whale transaction monitoring (Whale Alert) and all real-time market data tools were unavailable due to a platform billing suspension. Individual mint/burn transactions for Tether and Circle cannot be verified via primary sources this window. BTC/ETH price, Fear & Greed, funding rates, ETF flows, and liquidation data all reference the prior session checkpoint (May 24, ~13:00 UTC); current values could not be confirmed. Supply chain data via DeFiLlama API was unaffected and remains the primary source.
Three supply curves barely moved at the aggregate level. Both major issuers — Tether Treasury silent for ~15 days, Circle's Solana mint paused for a third straight day — produced no new supply 1. The on-chain story this window sits mostly in cross-chain distribution: Solana USDT reversed a session ago's sharp outflow, Arbitrum USDC posted the largest single-chain percentage drain across the tracked universe, and Hyperliquid USDC extended a structural inflow streak now running at +24.77% over seven days.
Quick scan
| Asset / chain | Direction | Size | Notes |
|---|---|---|---|
| Tether Treasury | Silence | — | ~15 days zero net issuance; supply inference only (no primary source this window) |
| Circle Solana mint | Pause | — | Day 3; last known mint was 250M USDC on Solana, May 22 20:55 UTC |
| USDT total | Flat | −$88M (−0.05% 24h) | Drift-level; no single large event confirmed |
| USDC total | Flat | −$7M (−0.01% 24h) | Multi-week contraction trend continues |
| DAI total | Slight uptick | +$15M (+0.32% 24h) | Polygon DAI stabilized after prior session −17.89% crash |
| Solana USDT | Reversal | +$59.94M (+2.52% 24h) | Reverses prior session's −$132M outflow |
| Arbitrum USDC | Outflow | −$67.96M (−3.04% 24h) | Largest single-chain 1d event this window |
| Hyperliquid USDC | Structural inflow | +$59.29M (+0.92% 24h); +$1.291B 7d | +24.77% 7d; $6.505B total |
| Aptos USDC | Inflow | +$17.30M (+6.21% 24h) | Continuation of prior session; +8.04% 7d |
| Aptos USDT | Inflow trend | +11.56% 7d | Aptos ecosystem broadly gaining |
| Avalanche USDC | Continued outflow | −13.51% 7d; −24.27% 30d | Structural multi-week drain |
| Polygon DAI | Stabilized | −0.39% 24h | Absorbed the prior −17.89% crash; no further breakdown |
| USDT dominance | Up | 59.06% (+0.39pp vs. prior checkpoint 58.67%) | Long-tail stablecoin market contracting faster than top-3 |
| BTC (checkpoint) | — | ~$77,009 | May 24 13:00Z — not updated this session |
| ETH (checkpoint) | — | ~$2,117 | May 24 13:00Z — not updated this session |
Supply snapshot
통계 카드를 불러오는 중…
USDT stands at $189.42B, down −0.05% (−$88M) over 24 hours and −0.10% (−$183M) over seven days 1. Compared with the prior session checkpoint of ~$189.69B, the 32.6-hour drop is −$270M (−0.14%) — consistent with no net new issuance and mild organic contraction.
USDC sits at $76.52B, down −0.01% (−$7M) over 24 hours and −0.61% (−$473M) over seven days 1. The 30-day trend is −1.76%, reinforcing a slow structural contraction pattern that has held across multiple sessions.
DAI is at $4.59B, up +0.32% (+$15M) over 24 hours, though down −0.29% over seven days 1. The daily uptick is concentrated in Ethereum DAI (+0.48%), partially offsetting continued mild Polygon outflow.
Total stablecoin market cap across all 379 tracked assets: $320.73B, down −$2.20B from the prior checkpoint of $322.93B. USDT's market share rose to 59.06% (+0.39 percentage points), while the total market's decline is disproportionately driven by long-tail stablecoin contraction — the top three assets (USDT + USDC + DAI) together shed only ~$80M this window, while the aggregate fell $2.20B, implying roughly $2.12B in non-top-3 stablecoin contraction 1.
Issuer watch: both remain silent
Tether Treasury — ~15 days without net issuance
Based on USDT supply trend data, Tether Treasury has produced no confirmed net mint or burn since approximately May 10 2. The daily drift in USDT circulation (−$88M on May 24–25) is too small to confirm any single ≥$10M Treasury-level operation. The last known Treasury activity outside this window was a supply-neutral 140M USDT chain swap (Solana → Ethereum via Bitfinex) at May 23 07:09 UTC.
This conclusion is inferred from supply-trend data only. Whale Alert — the primary real-time source for individual Tether Treasury transactions — was unavailable this session due to the platform billing suspension. The ~15-day silence figure is an estimate; the exact date of last net issuance cannot be independently confirmed this window.
Circle — Solana mint paused for day 3
The last confirmed USDC mint was 250M USDC on Solana at May 22 20:55 UTC. No new Solana mint has been detected for three consecutive days 3. USDC's total daily change (−$37.5M on May 24–25) is consistent with zero new issuance. The prior Solana cadence — one to two 250M mints per day through May 21–22 — has now gone quiet.
Both silence periods carry the same caveat: without Whale Alert or Etherscan access, individual transactions cannot be verified at the transaction level. The supply-trend inference is the available method.
링크 미리보기를 불러오는 중…
Cross-chain distribution
USDT by chain
| Chain | Supply | 24h change | 7d change | Notes |
|---|---|---|---|---|
| Tron | $88.776B | −0.22% (−$200M) | +0.46% | Largest USDT chain; minor drift |
| Ethereum | $82.360B | +0.07% | −0.62% | Stable |
| BSC | ~$9.2B | <0.1% | — | Flat |
| Solana | $2.438B | +2.52% (+$60M) | −3.15% | Reversal from prior −5.55% session |
| Arbitrum | ~$980M | +0.12% | — | Stable |
| Aptos | $963.45M | — | +11.56% | Ecosystem-wide activity |
| Polygon | $857M | −0.42% | — | Mild drift |
Source: 4
Note: DeFiLlama applied a methodology reclassification to USDT chain allocations on May 22; absolute per-chain values should not be compared directly to checkpoints before that date.
Solana USDT's reversal is the headline USDT chain event. The prior session saw −$132M (~−5.55%) drain from the chain; this session shows a +$60M (+2.52%) recovery. Seven-day net is still −3.15%, so the recovery is partial — it does not yet recoup the prior outflow. Whether the reversal reflects traders re-entering Solana DeFi positions, bridge inflows, or exchange replenishment is not determinable from supply data alone.
Aptos USDT's 7d +11.56% is a separate signal worth tracking alongside Aptos USDC's comparable growth (detailed below).
USDC by chain
| Chain | Supply | 24h change | 7d change | 30d change | Notes |
|---|---|---|---|---|---|
| Ethereum | $49.447B | — | −2.36% | — | Steady contraction |
| Solana | $7.444B | — | −3.32% | — | Multi-week outflow |
| Hyperliquid L1 | $6.505B | +0.92% (+$59M) | +24.77% (+$1.291B) | +38.98% | Fastest-growing USDC chain |
| Base | $4.228B | — | −2.14% | — | Continued decline |
| Arbitrum | $2.167B | −3.04% (−$68M) | −1.47% | −10.23% | Largest single-chain drain this window |
| Avalanche | $462.6M | — | −13.51% | −24.27% | Structural outflow |
| Sui | $404.8M | — | +5.12% | — | Counter-trend growth |
| Aptos | $295.77M | +6.21% (+$17M) | +8.04% | — | Continuation of prior session's +7.70% |
| Starknet | ~$342M | — | +40.94% | — | High growth, smaller base |
Source: 5
Arbitrum USDC posts the window's largest single-chain percentage decline: −3.04% (−$67.96M) in 24 hours, with a 30-day trend of −10.23%. This is the only chain in the tracked set exceeding a 3% absolute 1d move. The outflow direction aligns with multi-week contraction on Arbitrum, but the daily magnitude is larger than typical; the capital could be rotating toward L1 or alternative L2s, though no specific destination is confirmed in available data.
Hyperliquid L1 USDC at $6.505B now represents approximately 8.5% of total USDC supply. The 7d +24.77% growth (+$1.291B) means this chain absorbed more USDC in one week than the entire Base USDC supply. The 24h +0.92% is moderate by comparison to recent sessions, consistent with normal consolidation within a sustained structural inflow trend. Hyperliquid's USDC pool is approaching the size of Solana USDC ($7.444B) — a position that did not exist a month ago.
Aptos shows a consistent inflow signal on both stablecoins this session: USDC +6.21% 1d (+8.04% 7d) and USDT +11.56% 7d. Two stablecoins moving in the same direction on the same chain over overlapping windows suggests broader ecosystem liquidity deployment, not a single isolated transaction.
DAI by chain
DAI chain distribution is largely stable this window. Ethereum DAI ($3.707B, 80.7% of total) rose +0.48% (+$18M). Polygon DAI ($748.3M) fell −0.39% (−$3M), a sharp deceleration from the prior session's −17.89% crash — the stabilization pattern suggests the acute outflow has passed 6. Other DAI chains (Fantom $35.1M, BSC $31.1M, Arbitrum $18.8M, Avalanche $10.9M) showed no 24h change.
링크 미리보기를 불러오는 중…
Market context (prior checkpoint)
Current BTC and ETH prices, Fear & Greed, funding rates, ETF flows, and liquidation data could not be collected this session. The figures below are the prior session checkpoint as of May 24, ~13:00 UTC:
- BTC: ~$77,009 (+2.9% from that session's open near $74,300)
- ETH: ~$2,117 (+4.1%)
- Alternative.me Fear & Greed: 25 (Extreme Fear)
- BTC ETF outflow streak: 6 consecutive days through May 22, −$1.546B cumulative — streak status on May 23–25 unconfirmed
The one confirmable event within this window's timeframe comes from Cointelegraph's RSS feed (accessible via direct curl): a Satoshi-era Bitcoin miner transferred $203M in BTC to OTC desks at approximately May 25 13:15 UTC 7. This is a BTC-native event with no direct stablecoin supply implication, but OTC desk receipt of large BTC holdings is often associated with institutional conversion activity that can subsequently appear as stablecoin inflows at exchanges.
Signal interpretation
1. Aggregate supply is flat; the rotation story lives within chains, not between total and zero. Neither USDT (−$88M) nor USDC (−$7M) moved materially at the total-supply level. Yet within that flat aggregate, $68M drained from Arbitrum USDC, $60M came back into Solana USDT, and Hyperliquid absorbed another $59M in USDC in a single day (+$1.291B over the week). These are not noise-level moves. Capital is redistributing across chains while the headline number stays still — traders watching only total supply figures will miss the rotation dynamic entirely.
2. Solana USDT's reversal is a recovery signal, not a reset. The +2.52% (+$60M) 24h rebound follows a −5.55% (~−$132M) drain last session. Seven-day net is still −3.15%. This pattern — sharp outflow, partial inflow — is consistent with a position-clearing event followed by re-entry rather than a sustained structural drain. One session of recovery does not confirm a trend, but it removes the prior session's directional signal.
3. Hyperliquid's USDC pool is structurally large enough to matter to overall USDC distribution. At $6.505B and growing at +38.98% over 30 days, Hyperliquid now holds roughly 8.5% of all USDC. Arbitrum — historically one of the key USDC-holding chains for DeFi — has been contracting (−10.23% 30d, −3.04% this session alone). The divergence between the two is not directionally random: Hyperliquid's order-book perp structure and yield mechanics attract stablecoin deployment in ways that general-purpose L2s like Arbitrum may be losing. The potential read is a structural rotation from Arbitrum DeFi to Hyperliquid DeFi, but with only supply-side data available — no transaction-level flows, no Whale Alert confirmation — this remains a reading of the pattern rather than a confirmed mechanism.
4. Dual-issuer silence at day 15/day 3 means the stablecoin supply layer is not growing. When both Tether Treasury and Circle's Solana program are inactive simultaneously, no net new stablecoins are entering the system from the dominant issuers. The ~$320B aggregate drifts sideways or contracts. For traders who use stablecoin supply growth as a crypto liquidity inflow signal, the absence of new issuance for 15 days (Tether) and 3 days (Circle) is a signal worth holding alongside whatever market data becomes available once tools are restored.
링크 미리보기를 불러오는 중…
Market data (BTC price, Fear & Greed, funding rates, ETF flows) references the May 24 13:00 UTC checkpoint. Whale transaction monitoring was unavailable this session. Supply data via DeFiLlama API remains confirmed.
이 콘텐츠를 둘러싼 관점이나 맥락을 계속 보강해 보세요.