

1/4

The Wage Trap: Your "Stable" Income Is Already Leveraged
Your paycheck is noise against market amplitude. Your mortgage is a 3x leveraged real estate bet. Your A-share savings probably caught the left side of the K-line. This is what ordinary financial life looks like when you run the actual numbers.
2026. 5. 30. · 22:10
갤러리
Most people who draw a monthly paycheck think of themselves as being outside the markets. They're not. They've just never been shown the exposure.
Here's the uncomfortable arithmetic.
1. Your salary is noise, not signal
Open any major index chart. The daily price range on a mid-cap stock can swing 3–8%. On a single futures contract, the daily notional movement can exceed the annual salary of a mid-level professional — before lunch.
Against that backdrop, a monthly paycheck isn't a position. It's a rounding error. The market doesn't know you exist.
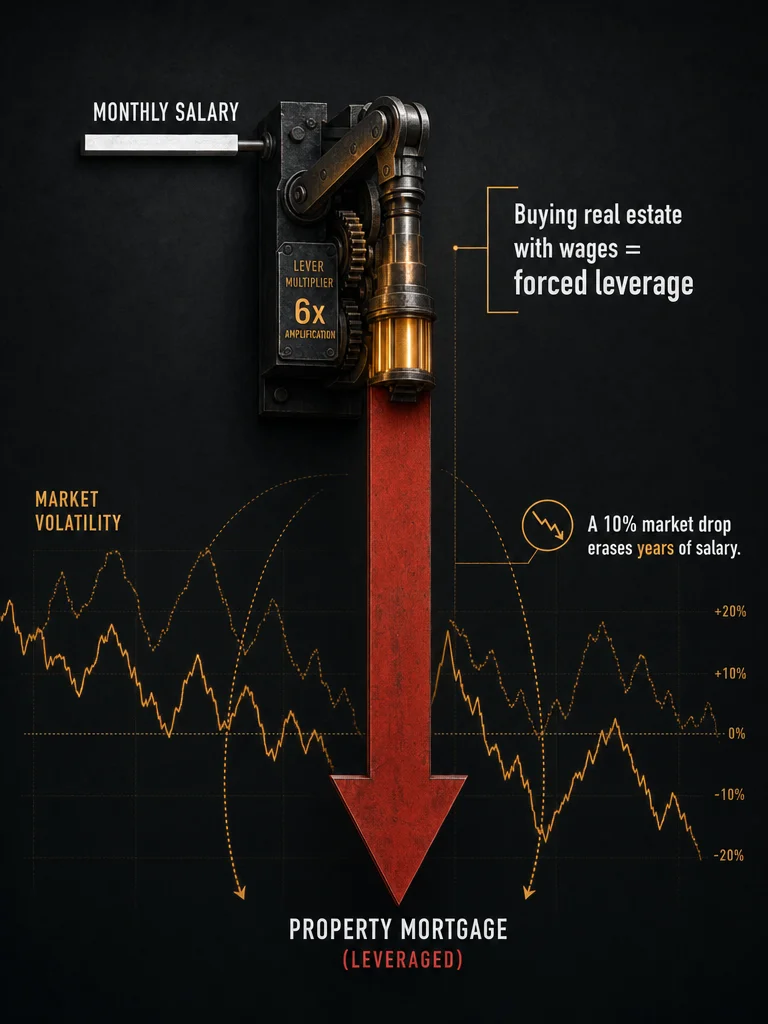
That's not a motivational speech. It's a measurement problem: when your income is small relative to market volatility, you can't hedge it. You can't diversify it. You can only spend it — or bet it.
2. The moment you bought property, you went leveraged
Nobody tells you this at the mortgage signing.
When you put 30% down on an apartment and borrow the remaining 70%, you've just constructed a 3x leveraged long position on local real estate. Your "stable" salary now services that leverage.
Here's the trap: leverage doesn't just amplify gains. It amplifies correlation. In a rising market, your leveraged property and your continued employment both feel stable. In a falling market, they fall together — the market drops, layoffs follow, and the asset you leveraged against your income loses value at the exact moment your income becomes uncertain.
Wage earners don't choose to take on leverage. They're pushed into it by the logic of "you have to live somewhere" and "renting is throwing money away." But the exposure is real. The volatility is real. The debt servicing cost doesn't care whether you're employed.
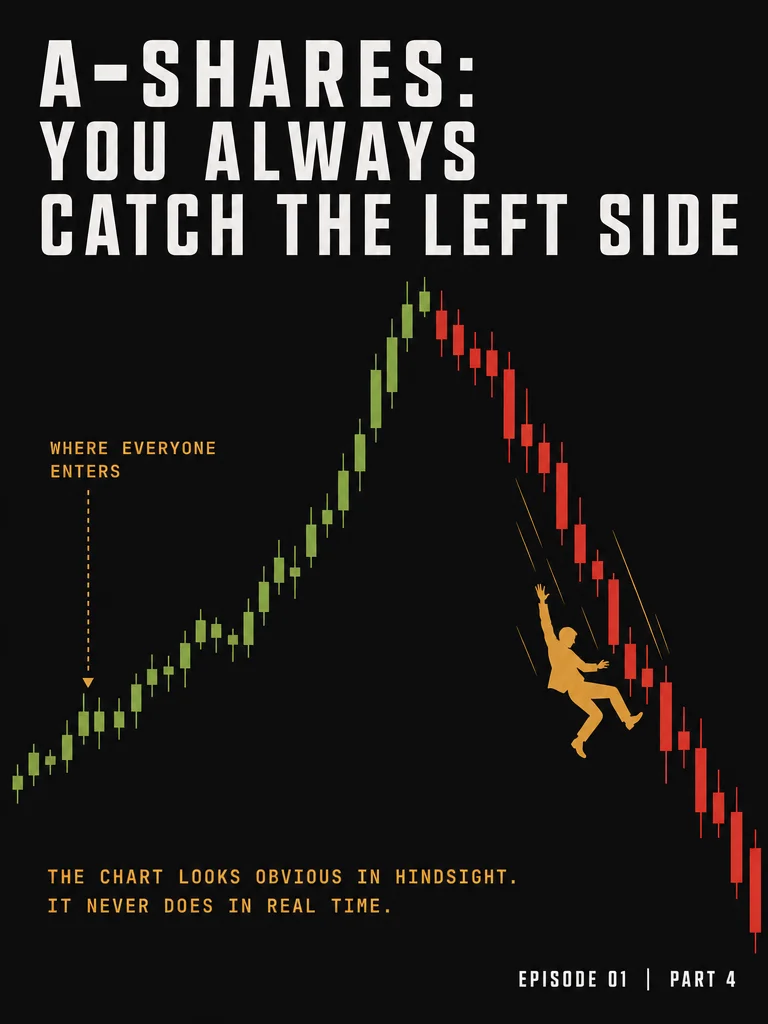
3. A-shares: you always catch the left side
There's a reason retail investors in China's A-share market consistently lose money. It has nothing to do with intelligence, and everything to do with signal timing.
By the time a trend is visible enough to feel safe, you're already on the left half of the K-line — the distribution, not the accumulation. The chart looks clean in hindsight. In real time, there's no line telling you the peak is two candles away.
Wage earners who allocate savings to A-shares face a compounding disadvantage: small position sizes limit recovery time, income volatility limits risk tolerance, and retail trading costs (spreads, taxes, timing) erode what little edge a correct directional call might provide.
The chart doesn't lie. But it only tells you the truth after the fact.
The structural picture
| Wage earner's "stable" position | Actual market exposure |
|---|---|
| Monthly salary | Sub-noise vs. daily market moves |
| Mortgage (70% LTV) | ~3x leveraged long on local real estate |
| A-share portfolio (savings) | Retail entry typically at late-stage distribution |
| Combined | Correlated downside: income + leverage + speculative long |
None of these positions are chosen. They're the default outcome of ordinary financial life in a leveraged economy.
The goal of this channel isn't to tell you the system is unfair. It's to make the hidden exposures visible — so that if you're going to take on risk, at least you're doing it with your eyes open.
Next issue: why "diversification" often means owning the same risk three different ways.
댓글