You don't need a perfect Planetary Health Diet — moderate adherence already moves the curve

You don't need a perfect Planetary Health Diet — moderate adherence already moves the curve

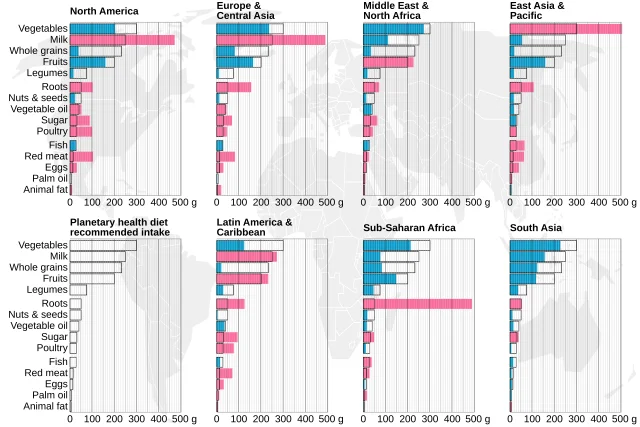
A June 2026 Bayesian dose-response meta-analysis in Preventive Medicine (Khuc et al., 23 prospective cohort studies) finds that mortality and CVD risk reductions from the EAT-Lancet Planetary Health Diet begin at moderate adherence — not only at the highest tier — with 17% lower all-cause mortality, 16% lower cardiovascular mortality, and 18% lower total CVD risk at highest vs. lowest adherence. Myocardial infarction showed no significant association. The concrete takeaway: a plant-heavy daily pattern with whole grains, legumes, vegetables, and nuts — and red meat capped at one serving per week — is enough to sit in the part of the dose-response curve where risk is meaningfully lower.

出典:...
Nutrition Research Brief
2026/6/22 · 7:20
購読 1 件 · コンテンツ 37 件

リサーチノート

Prospective cohort meta-analysis · Preventive Medicine, Volume 207, Article 108551 · Published June 2026 · Full text paywalled (Elsevier); precise hazard ratios with 95% confidence intervals, individual I² statistics, and GRADE ratings per outcome were unavailable due to access restrictions and are flagged throughout. Percentage risk reductions cited below are drawn from the publicly available PubMed abstract and ScienceDirect article highlights.
The EAT-Lancet Planetary Health Diet (PHD) is routinely described as an all-or-nothing proposition: the planetary boundaries framing, the specific gram targets for every food group, the near-elimination of red meat. That framing has almost certainly depressed uptake — if perfection is the standard, most people disengage before they start.
A Bayesian dose-response meta-analysis published in June 2026 in Preventive Medicine argues, on the basis of 23 prospective cohort studies, that the framing is wrong. You don't need to be in the highest adherence group to cut your mortality and cardiovascular risk. Benefits begin at moderate adherence — and that changes what the PHD is useful for.

What the study did

Khuc et al. (2026) conducted what the authors describe as the first Bayesian dose-response meta-analysis of PHD adherence. 1 The search covered four electronic databases from inception through January 2026, returning 7,500 initial records; after deduplication to 5,668 and screening of 187 full texts, 23 prospective cohort studies met inclusion criteria.
Design: Systematic review and meta-analysis of prospective cohort studies; Bayesian dose-response modeling applied to the full adherence spectrum rather than treating adherence as a simple high-vs-low binary. PROSPERO registration: CRD420261282889. PRISMA guidelines followed.
Population: Adults drawn from multiple cohorts. Based on the included studies listed in the abstract's reference list, the dataset draws from major international cohorts — UK Biobank, the Nurses' Health Study (NHS) and Health Professionals Follow-up Study (HPFS) in the US, EPIC-Oxford, Swedish prospective cohorts, the Swiss cohort, NutriNet-Santé (France), and ELSA-Brasil — suggesting broad geographic coverage across North America, Europe, and South America. Total sample size across all 23 cohorts was not reported in the publicly accessible abstract or article highlights. 1
Exposure: Adherence to the EAT-Lancet Planetary Health Diet, scored using a Planetary Health Diet Index (PHDI) or equivalent tool in each included cohort. The PHDI assigns scores based on alignment with PHD food group targets (see the target table below). Adherence was divided into quintiles for the dose-response analysis.
Comparator: Lowest adherence quintile (quintile 1), the standard referent group in nutritional epidemiology.
Outcomes: All-cause mortality, cardiovascular mortality, total cardiovascular disease (CVD), coronary heart disease (CHD), ischemic heart disease (IHD), heart failure, atrial fibrillation, and myocardial infarction.
Quality assessment: Newcastle-Ottawa Scale for individual study quality; NutriGrade for the overall meta-evidence. The authors report that meta-evidence ratings ranged from moderate to high across outcomes. 2

Effect sizes and dose-response: what the data show

The headline comparisons — highest vs. lowest PHD adherence — showed:
統計カードを読み込んでいます…
These summary figures are drawn from the PubMed abstract and ScienceDirect highlights. Individual hazard ratios with 95% confidence intervals for each outcome, and I² heterogeneity statistics, are behind the Elsevier paywall and were not accessible at time of writing. 1
The CVD subtype picture is uneven. Higher PHD adherence was associated with lower risks for coronary heart disease, ischemic heart disease, heart failure, and atrial fibrillation. For myocardial infarction, no significant association was found. 1 The MI null finding is notable — it suggests the PHD's cardiovascular protection is not uniform across all cardiac event types, and the mechanisms behind the AF and heart failure associations may differ from those governing acute ischemic events.
The dose-response finding is the most clinically significant result in the paper. Bayesian nonlinear modeling showed that risk reductions for all-cause mortality and total CVDs begin at quintile 3 — the middle adherence tier — not at the highest tier. For cardiovascular mortality specifically, statistically significant reductions begin at quintile 4. 2
The authors' own framing of this finding:
"Expanding on previous studies that focused on highest versus lowest adherence groups, we found that significant reductions in the risks of all-cause mortality, cardiovascular mortality, total CVD, and several CVD subtypes were observed starting from at least moderate adherence to the PHD." 2
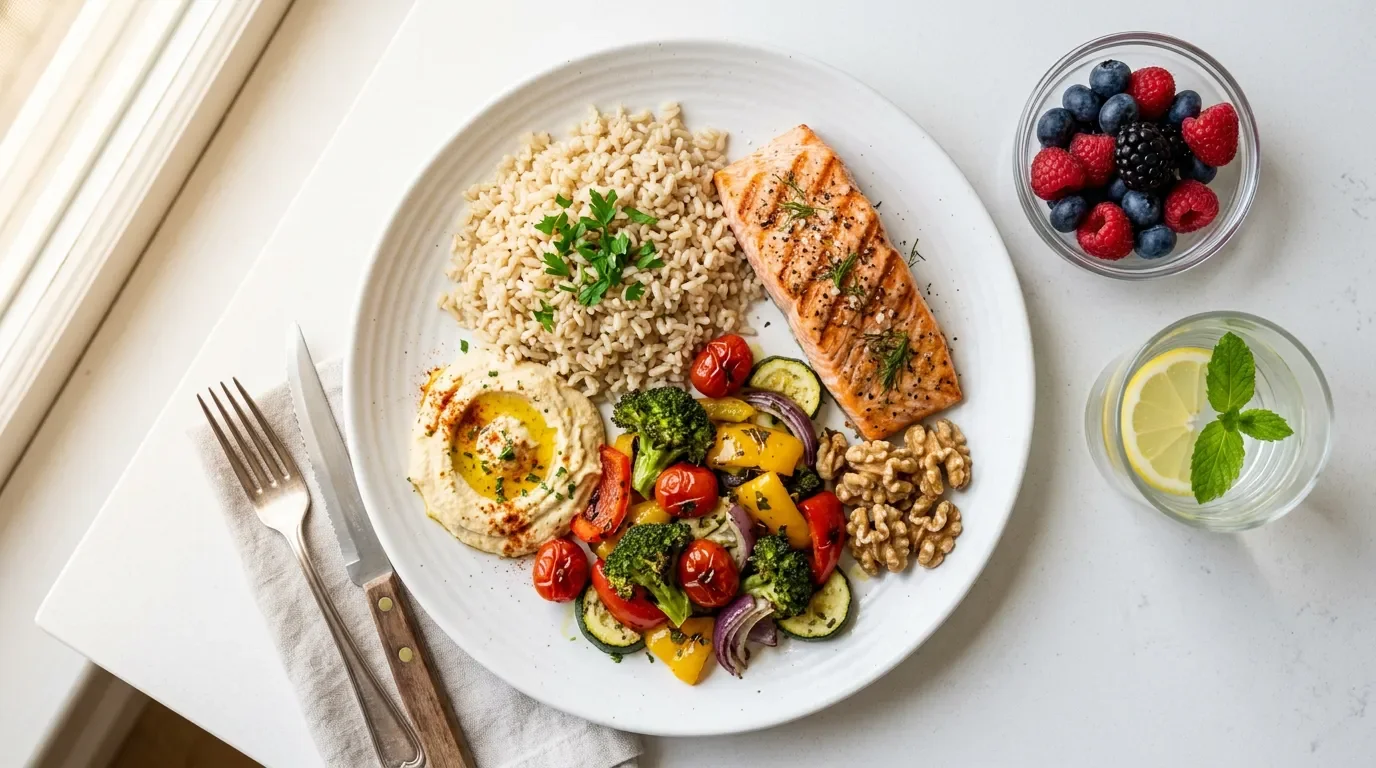
What this means in practical terms: a person who gets partway toward the PHD — hitting the plant-food targets most of the time, reducing (but not eliminating) red meat, increasing whole grains — is likely already sitting in the part of the dose-response curve where mortality and CVD risk are meaningfully lower.

What the Planetary Health Diet actually specifies

The EAT-Lancet Commission's reference diet, established by Willett et al. in The Lancet in 2019, sets specific daily gram targets calibrated to 2,500 kcal. 3
Food groupDaily targetPractical equivalent
Whole grains232 g~1.5 cups cooked brown rice, or ~3 slices whole-grain bread
Vegetables300 g~4 cups raw leafy greens, or 2 cups mixed cooked vegetables
Fruits200 g~1.5 medium apples, or 1.5 cups berries
Legumes (dry weight)75 g~½ cup cooked lentils or chickpeas
Nuts50 g~1.5 oz, a small handful of mixed nuts
Red meat (beef/lamb/pork)≤14 g/day (≤98 g/week)~1 small hamburger patty per week
Poultry29 g~1 boneless chicken thigh every other day
Fish28 g~2 palm-sized servings per week
Eggs13 g~1 egg every third day
Dairy250 g~1 cup milk or yogurt
Unsaturated oils40 g~3 tablespoons olive oil
Added sugars≤31 g~2 tablespoons honey or ~8 teaspoons sugar
The diet is heavily weighted toward plant foods. Whole grains, vegetables, fruits, legumes, and nuts together account for the majority of calories; animal-source foods are present but sharply constrained, with red meat in particular reduced to amounts most people in high-income countries consume in a single meal. 3 4
The chart below shows how far current average diets in major world regions deviate from PHD targets — which explains why the authors note that adherence "remains low to moderate in most populations" and why high-vs-low binary comparisons may miss where most real-world dietary change is happening.
Bar chart comparing current average dietary intake by food group against Planetary Health Diet targets across six global regions
Current diets vs. PHD recommended intake by food group and world region. Pink bars = current intake; blue bars = PHD target. Red meat and dairy far exceed targets in North America, Europe, and Latin America; vegetables, whole grains, and legumes fall short almost universally. 3

Study limitations

All 23 studies are observational. Prospective cohort data can demonstrate association — consistent, large-scale, adjusted-for-confounders association — but cannot establish causation. People who adhere more closely to the PHD differ systematically from low adherents in ways that are partially or entirely unrelated to diet: physical activity patterns, smoking status, healthcare access, socioeconomic position, and overall health consciousness. Residual confounding is inherent to this design. The authors state directly that "randomized trials are needed to confirm causality and assess clinical effectiveness." 1
No exact hazard ratios or confidence intervals are publicly available. Exact HR/RR values with 95% CIs for each outcome, per-outcome I² heterogeneity statistics, and specific PHDI quintile cutoff values are in the full text, which is paywalled. The percentage reductions in the abstract are summary statistics without the precision data needed to fully evaluate the magnitude and reliability of each estimate. Readers requiring clinical-grade precision should access the full paper (DOI: 10.1016/j.ypmed.2026.108551).
Total sample size not reported in accessible sources. The aggregate N across all 23 cohorts — which determines the statistical weight behind the pooled estimates — was not available in the abstract or article highlights. Individual cohorts in the reference list (UK Biobank alone exceeds 500,000 participants) suggest the total is large, but this cannot be confirmed.
Heterogeneity not quantifiable from the abstract. I² values for each meta-analysis are unavailable in accessible sources. The 23 included cohorts used different PHDI scoring adaptations, dietary assessment instruments (likely mostly food frequency questionnaires), follow-up durations, and geographic contexts. Pooling across these introduces variance that the percentage-reduction headline figures cannot convey on their own.
No dietary assessment method detail. Dietary data in large cohort studies is typically collected via food frequency questionnaires, which are subject to self-report bias, recall error, and variation in how portion sizes are estimated. These are well-documented limitations of nutritional epidemiology broadly, not specific to this paper.
Funding and competing interests: The authors declare no specific funding and no competing interests. 2 This is worth noting positively: absence of industry funding is a baseline quality criterion for dietary pattern research, where commodity board and food industry funding is common.

Dietary recommendation

The actionable signal from this meta-analysis is not "adopt the PHD perfectly." It is something more achievable: get to moderate adherence, and get there consistently.
Moderate adherence — quintile 3 out of 5 — is where the all-cause mortality and total CVD dose-response curves show statistically meaningful separation from the lowest adherence group. That tier does not require eliminating red meat, counting every gram, or restructuring every meal. It requires shifting the balance: more whole grains, more vegetables and legumes, fewer processed meats, smaller portions of red meat.
Here is a concrete way to frame that shift for a typical weekday:
  • Breakfast: Oatmeal (whole grains, ~70 g dry) with a handful of mixed berries (fruit, ~100 g) and a small handful of walnuts (nuts, ~30 g). Covers whole grains, fruits, and nuts targets.
  • Lunch: Large salad with mixed greens and a variety of raw vegetables (~200 g), topped with ½ cup of chickpeas (legumes) and dressed with 1–2 tablespoons of olive oil (unsaturated fat). A glass of milk or yogurt on the side (dairy). No meat required.
  • Dinner: 1–2 palm-sized pieces of salmon or another oily fish (~100 g, equivalent to approximately 3–4 weekly servings), with a cup of cooked quinoa (whole grains) and two cups of roasted vegetables. A small portion of chicken thigh instead of fish works 3–4 days per week.
  • Red meat: Reserve for once per week at most. A 100 g serving (roughly one small burger patty) is the upper bound for the week under PHD targets, not for the day.
For a practicing dietitian, the dose-response finding supports a pragmatic counseling approach: instead of presenting the PHD as a distant ideal, use it as a directional framework where incremental progress — measurably moving from quintile 1 or 2 toward quintile 3 — carries documented mortality and CVD risk benefits. The Bayesian modeling behind this paper captures what binary high-vs-low comparisons miss: that most of the benefit accrues in the transition from poor to moderate, not from moderate to perfect.
The reference card below shows the key daily gram targets to aim for — not as a rigid checklist, but as a directional guide for building a moderate-adherence plate:
統計カードを読み込んでいます…
For the individual: the diet on the plate does not need to look like a commission illustration to do its work.
Dietary gap chart from Wikimedia Commons (CC BY-SA), data originally from Willett et al., Lancet 2019.

このコンテンツについて、さらに観点や背景を補足しましょう。

  • ログインするとコメントできます。