
2026/6/24 · 17:25
June 24 settlements: Gold crashes through $4,000 as Hormuz reopens, oil hits post-war low
Gold GCQ6 (Aug) settled at $4,008.80 (−3.4%), touching $3,959.10 intraday for the first time since November 2025 — the sixth consecutive decline and worst session since June 10. WTI CLQ6 fell 4.58% to $69.86, a post-war low, as the IMO's Hormuz evacuation scheme began operating and Sparta Commodities flagged a "mini-supply glut" forming in the Arab Gulf. All precious metals sold off in lockstep: silver −7.85%, platinum −5.5%, palladium −6.8%. DXY hit a 52-week high of 101.80. Trump ordered a DOJ gasoline price probe. Soybeans (+1.61%) were the session's only winner.

Data as of 13:30–17:00 ET, June 24, 2026. COMEX gold settled 13:30 ET; CBOT grains settled ~13:15 CT; NYMEX crude and COMEX copper settled ~14:30 ET and ~13:00 ET respectively. Collection window: June 23, 22:28 ET → June 24, 17:00 ET.
Gold broke through the $4,000 level that traders had treated as the floor, touching $3,959.10 intraday before settling at $4,008.80 — the worst single session since the June 10 post-FOMC selloff, and the sixth consecutive daily decline. 1 WTI crude tumbled 4.58% to $69.86/bbl — its lowest close since the Iran war started — as the IMO's Hormuz evacuation scheme began operating and Neil Crosby of Sparta Commodities flagged a "mini-supply glut" forming in the Arab Gulf. 2 Silver crashed 7.85%, platinum fell 5.5%, and palladium dropped 6.8% — every precious metal repriced in lockstep. The sole gainer: soybeans, up 1.61%.
Settlement table — June 24, 2026
| Market | Contract | Settlement | vs. Jun 23 | % |
|---|---|---|---|---|
| COMEX Gold | GCQ6 (Aug) | $4,008.80 | −$140.60 | −3.40% |
| NYMEX WTI | CLQ6 (Aug) | $69.86 | −$3.35 | −4.58% |
| ICE Brent | BZN6 (Sep) | $73.87 | −$2.93 | −3.82% |
| CBOT Corn | ZCN6 (Jul) | 407.00¢ | −2.75¢ | −0.67% |
| CBOT Soybeans | ZSN6 (Nov) | 1,135.00¢ | +18.00¢ | +1.61% |
| COMEX Copper | HGN6 (Jul) | $5.9430 | −$0.1980 | −3.22% |
| Macro indicator | Jun 23 | Jun 24 | Δ |
|---|---|---|---|
| DXY | 101.37 | 101.58 | +0.21 (13-mo. high) |
| 10Y Treasury yield | 4.502% | 4.406% | −9.6 bp |
| 2Y Treasury yield | 4.198% | 4.148% | −5.0 bp |
| CME FedWatch Dec hike | 88.0% | 85.5% | −2.5 pp |
| CME FedWatch Sep hike | — | 70.3% | newly tracked |
CME FedWatch probabilities per FXStreet, June 24 close. 3
Gold: $4,000 breaks intraday, sixth straight decline, −28% from January high
Gold GCQ6 (Aug) settled at $4,008.80/oz, down $140.60 (−3.40%) from June 23's $4,149.40. 1 4 The COMEX front-month (June delivery) settled at $3,990.30, down $139.60 (−3.38%) — the lowest official COMEX settlement since November 6, 2025. 5 Spot gold (XAU/USD) hit $3,973.79 at 2:00 PM EDT, and Kitco's bid-side low print was $3,959.10 — the first time spot broke below $4,000 since November 6, 2025. 6 Session volume was 182,520 contracts, 136% of the 65-day average.
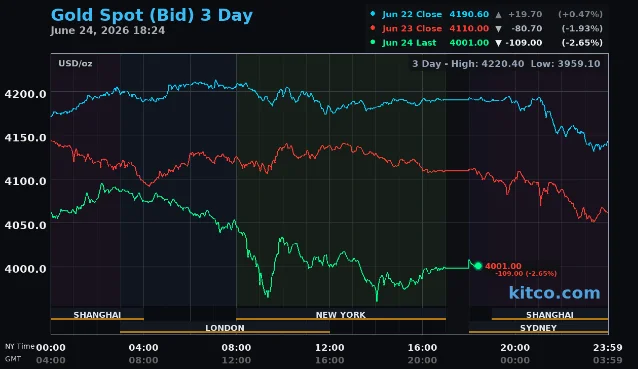
The six-session cumulative drop is $368.60/oz (−8.46% from June 16's close of $4,377.40). From the January 29, 2026 intraday record of $5,626.80, the metal has now retraced 28.6%, roughly $1,618/oz. 7 XTB summarized the move bluntly: gold "broke through key support, capitulating below the $4,000 level and losing nearly 30% from January's historical highs." 7
The driver is not in dispute. Deutsche Bank analyst Michael Hsueh attributed the selloff to "Fed repricing, together with resilient US macro data." 7 What makes June 24 analytically significant is what didn't happen: the 10-year Treasury yield fell 9.6 basis points to 4.406%. 8 Declining yields would typically give gold a lift — lower real rates reduce the opportunity cost of holding a non-yielding asset. Instead gold kept falling. The pattern confirms that DXY dominance is overriding the rate signal: gold is trading as a dollar proxy, not as a safe haven or an inflation hedge.
Barron's columnist Paul R. La Monica flagged the implication for anyone considering a contrarian buy: gold is "being viewed as more of a risky asset" at this stage of the cycle. 9 Independent metals trader Tai Wong offered a more textured take: "For gold, there is support at just under $3,900, and central bank purchasing continues, so a crash is unlikely. However, expect a long period of consolidation, as the gold market is no longer in favor." 1 The PBOC has bought gold for 19 consecutive months through June 2026, holding 2,313 tonnes — steady demand that Wong cites as the structural floor. 1
The technical picture has deteriorated. Julian Pineda, CFA, CMT (Forex.com/StoneX), notes that the 50-period moving average is approaching a crossover below the 200-period moving average, while the descending trendline in place since March "continues to reflect an important selling bias." 6 Forex.com targets $3,886 (October 2025 lows) as the next support; XTB flags $3,570. 6 7
Bank targets are spread widely: Goldman Sachs cut its year-end target to $4,900/oz after removing projected 2026 Fed rate cuts from its model; Deutsche Bank has a base case of $4,300 for Q3 and a risk case of $3,800 — now roughly $200 above where spot traded intraday on June 24. 10 JPMorgan holds its target at $6,000; Wells Fargo at $6,100–$6,300. 10
The rout spread to all precious metals. Silver (SI00) settled at $57.195/oz, down $4.875 (−7.85%), its lowest settlement since December 2025, with an intraday low of $55.75. 11 Platinum fell 5.5% to $1,560.72/oz; palladium dropped 6.8% to $1,153.68/oz. 11 Silver's sharper decline reflects its dual precious/industrial demand profile: hawkish rate repricing depresses the industrial component at the same time the precious component faces DXY pressure. The Silver Institute's latest data shows a 6th consecutive annual supply deficit in 2026, projected at 46.3 million oz — structural undersupply, but that support isn't showing up in the price today. 12
Gold ETFs had their largest weekly inflow since mid-April in the week ending approximately June 20 (5.1 tonnes, ~$1.1 billion), which followed four weeks of outflows totaling 58.2 tonnes (~$7.6 billion). 12 Given June 24's crash below $4,000, June 24 daily flow data will likely show renewed outflows when released.
Oil: WTI −4.58% to $69.86 — post-war low as Hormuz ships start moving
WTI CLQ6 (Aug) settled at $69.86/bbl, down $3.35 (−4.58%) from June 23's $73.21 — the lowest settlement since before the Iran-US conflict began in late February. 13 Brent BZN6 (Sep) settled at $73.87/bbl, confirmed by MarketWatch's official settlement price field, down $2.93 (−3.82%) from June 23's $76.80. 14 WTI's one-month decline stands at −21.87%; Brent's at −20.99%. Both benchmarks have nearly erased every barrel of the war risk premium.
Three things moved crude lower simultaneously on June 24.
First, the IMO's Hormuz evacuation plan went operational. After being announced June 23, the plan started running on June 24: LSEG ship tracking confirmed at least two dry bulk carriers and one cargo vessel transited the dual-lane corridor (north lane through Iranian waters, south lane through US-coordinated Omani waters). 16 Another 35 commercial vessels were queued to follow. 16 US Energy Secretary Chris Wright said approximately 20 million barrels of crude had left the Strait in the prior 24 hours — "the return to normal flow." 17 Neil Crosby, head of research at Sparta Commodities, put the market's problem directly: "We have the prospect of a rush of physical supply coming out of the Arab Gulf. We are currently in a mini-supply glut as we need to entice demand back." 2 Bob Yawger of Mizuho described the same dynamic from the trading desk: people are "in a rush to dump contracts because a lot of oil is coming out of the Middle East." 2
Second, US-Iran diplomatic progress. FXStreet reported that the two sides have made "substantive progress" in Switzerland and agreed on a framework for a broader deal within 60 days. 18 Secretary of State Rubio, during his Gulf tour Day 2 (Abu Dhabi → Kuwait → Bahrain), met UAE President MBZ at a working lunch at Zuma restaurant on Al Maryah Island, then flew to Kuwait City to meet Emir Sheikh Meshal al-Ahmad al-Sabah and participate in a flag-raising ceremony at the US Embassy, which had been shut for months after an Iran-linked drone strike. 19 Rubio told reporters: "We're not going to do anything that undermines the security of our allies, our longstanding allies in the region." 19 Technical talks are expected to resume by month-end in Switzerland. 20
Third, a complicating data point on the supply side: UANI (United Against Nuclear Iran) tracked nearly 20% of Monday's 48 Hormuz transits as sanctioned vessels — nine ships linked to Iranian, Russian, and Venezuelan crude. 21 Iran's fleet at sea currently holds an estimated 68 million barrels (Vortexa), with at least 80% of that volume seeking buyers. 21 Kelly Campa of the Institute for the Study of War argued Iran is "reaping economic benefits before progress is even made on the next step of negotiations," which "strips leverage from the US in the 60-day period." 21
The EIA weekly petroleum status report, released June 24 for the week ending June 19, showed commercial crude inventories fell 6.1 million barrels (vs. a −4.1 million barrel survey expectation), the ninth consecutive weekly draw. 22 Inventories at 412.1 million barrels sit roughly 7% below the five-year seasonal average. Gasoline and distillate stocks rose. 22 The draw confirms structural tightness even as the front of the market reprices the Hormuz reopening.
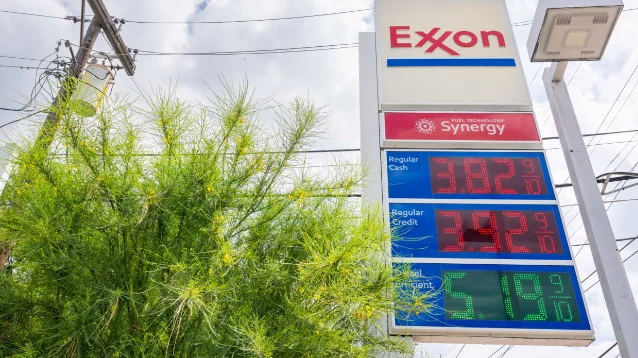
Trump's DOJ gasoline probe
President Trump posted on Truth Social on the morning of June 24 accusing large oil companies of not passing lower crude costs to consumers: "The big Oil Companies are not dropping their price at the pump commensurate with the sharply lower prices they are paying for Oil. Those prices are dropping like a rock!" 15 He directed the DOJ to investigate "immediately." The national average pump price is $3.93/gallon (AAA), down from $4.51 a month ago but still roughly $0.70 above year-ago levels, while WTI has fallen from about $120 in March to $69.86 on June 24. 15
A DOJ spokesperson stopped short of committing to an investigation, saying only that "fuel prices are not just a national security issue — they affect every American's wallet." 15 The American Petroleum Institute countered: "Gasoline prices don't move in lockstep with crude oil, especially during a major global disruption." 22 Mike McKenna, a White House energy adviser during Trump's first term, told Politico: "This is good campaign PR, and everyone knows nothing will come of it." 15 One Dallas Fed survey respondent captured the industry's view without pulling punches: "Markets can price risk, but they can't price a tweet. The whiplash from diplomacy-by-social-media has become the single most unpredictable input in our planning." 15
Russia is separately pushing toward a full diesel export ban. Deputy Prime Minister Alexander Novak said Russia's refinery system is running at capacity: "We have maxed out capacity across all oil refineries, shortened repair timelines and postponed scheduled maintenance to later dates." 23 Gasoline output is down roughly 25% year-over-year; more than 20 Russian regions are rationing. 23
Copper: −3.22% to $5.9430 — fifth straight loss, 8.4% in five days
COMEX copper HGN6 (Jul) settled at $5.9430/lb, down $0.1980 (−3.22%), confirmed by Morningstar's official settlement data field. 24 Five consecutive losses total $0.5460/lb (−8.41%), the largest five-day drawdown since August 6, 2025. 24 The contract sits 10.6% below its 52-week high of $6.6495, hit June 2, 2026. Despite the recent slide, year-to-date copper is still +5.56% ($0.3130/lb). 24
DXY strength at a 13-month high is the primary driver: dollar-denominated commodities face a direct translation penalty when the index rises, and copper's industrial demand profile gives it extra sensitivity to fears about global growth triggered by rate-hike repricing. LME copper tracked COMEX lower, trading near $13,110/tonne intraday.
On the Cobre Panama restart: the Panama government ordered a technical debate on reopening after the independent environmental audit scored the mine 88% compliant (released June 22). BNN Bloomberg put restart probability at 70–80%. Stockpile processing could yield roughly 70,000 metric tonnes; actual production, if authorized, would not begin before 2027. 5
Grains: Corn extends to four straight losses; soybeans the only winner
CBOT corn ZCN6 (Jul) settled at 407.00¢/bu, down 2.75¢ (−0.67%) from June 23's 409.75¢ — the fourth consecutive lower close. 25 December corn (ZCZ6) settled at $4.34¾ per bushel, down 2.5¢. 26 Intraday session volume was 123,360 contracts, 61% of the 65-day average, with an early short-covering bounce to ~412.5¢ that evaporated by noon CT. 25 The five-day decline is −3.62%; the one-month drawdown is −10.18%.
Matt Zeller of StoneX gave a direct read on the fund desk: "There's no real evidence to argue that fund selling is ready to let up." 26 Managed money as of the June 19 CFTC Commitment of Traders report held a net long of only 21,058 contracts in corn, a near-record low. 26 Cole Raisbeck of Kluis Commodity Advisors noted that the DXY above 101 is "making it difficult for grains to generate much of a bounce." 27
Lane Akre of Pro Farmer offered the most pointed weather observation: "It is getting to the point where maybe it's been a little bit too much rain especially in some southern portions — even here in Eastern Iowa, we're starting to see some yellowing in spots." 28 NWS Climate Prediction Center's 6-10 day outlook shows above-normal temperatures developing across the eastern Corn Belt (Illinois, Indiana, Ohio), which should build growing degree days — helpful, if the heat stays moderate and rain develops alongside it, per DTN meteorologist John Baranick: "As long as the rain develops, that causes little cause for concern with the increasing temperatures, at least in the short term." 29
CBOT soybeans ZSN6 (Nov) were the lone bright spot, settling at 1,135.00¢/bu, up 18.00¢ (+1.61%) from June 23's 1,117.00¢ — the only commodity on the board to close higher. 30 July soybeans (near-month, nearing roll) settled lower at 1,107.75¢, off 9.25¢, reflecting the roll dynamic. Soybean meal (SM00) eased $2.40/ton (−0.79%) to $300.5/ton while soybean oil (BO00) fell 0.90¢/lb (−1.35%) to 65.68¢/lb. 11

No new USDA daily export flash sales were reported June 24; the last confirmed China purchase was June 18 (132,000 MT soybeans for MY 2026/2027). 32 China purchase rumors are circulating — Dan Basse of Ag Resource estimated Beijing bought roughly 500,000 MT of US soybeans last week — but Thursday morning's weekly export sales report (due June 25 at 8:30 AM ET) is the first hard confirmation. 28
USDA crop ratings remain steady: as of the June 22 weekly survey, national corn is rated 68% good-to-excellent (unchanged week-over-week) and soybeans at 66% G/E (unchanged). 33 Winter wheat harvest reached 40% complete, well ahead of the five-year average of 24%. 33 Dr. Michael Cordonnier maintained his US corn yield estimate at 182.0 bu/ac (neutral bias) and soybean yield at 52.5 bu/ac (neutral bias), noting "there does not appear to be any threatening weather in the forecast for the next two weeks." 33
AgMarket.Net released planted acreage estimates June 24, ahead of the June 30 USDA Acreage and Quarterly Grain Stocks reports: corn down roughly 400K acres from March intentions, soybeans up roughly 600K, combined corn+soybeans at 180.2 million acres given low prevent-plant levels. 31 The more aggressive FBN survey projects a 1.5 million-acre corn reduction. The range of estimates means June 30 will generate real price action.
In European weather, France logged its hottest day on record this week, with temperatures above 100°F and more than 50 weather-related deaths. 29 Lane Akre noted the EU heat "could provide a little bit of an opportunity for U.S. crops, especially on the wheat side of things," but CBOT wheat remained pressured by Black Sea competition. 28 CBOT September wheat closed down 1¢ at $5.96/bu; September KC wheat was up fractionally at $6.25½. 27
Macro context: DXY 101.58, 10Y −9.6bp, PMI beat, equities split
The DXY touched an intraday high of 101.80 on June 24 — a fresh 52-week high — before settling at 101.58 (+0.21%), the third consecutive daily gain and the highest close since May 2025. 3 Michael Boutros of Forex.com/StoneX pinned the next key level: "The bulls would need to secure a close above 102 to fuel the next major leg of the rally." 34
The 10-year Treasury yield fell to 4.406% (−9.6 bp from 4.502%) and the 2-year to 4.148% (−5.0 bp). 8 The decline reflects a simple mechanism: oil's collapse reduced near-term inflation expectations. Ross Pamphilon, CIO Fixed Income at Impax Asset Management, said: "Our core view has been that the energy spike was always likely to prove transitory rather than structural… We continue to see scope for further declines in longer-dated yields over the near term." 8
CME FedWatch shows markets pricing a 85.5% probability of a December hike, down 2.5 percentage points from June 23's 88%, with September at 70.3%. 3 Bank of America continues to project three 25-basis-point hikes in September, October, and December.
S&P Global's flash PMI for June printed: Composite 52.2 (up from May's 51.5), Manufacturing 55.7, Services 51.3 — a beat across the board that reinforces the "resilient US macro data" argument for Fed tightening. 35 Equities split: the Dow Jones Industrial Average closed up 182 points (+0.35%) to 51,849; the S&P 500 slipped 7 points (−0.10%) to 7,358; the Nasdaq fell 110 points (−0.43%) to 25,477. VIX fell 0.86 to 18.63. 35
What to watch next
- Gold: Core PCE for May prints Thursday, June 25, at 8:30 AM ET. Consensus expects 3.4% core, 4.1% headline. A print softer than expected would give the Fed hawks less ammunition and could trigger a relief bounce from the $3,959 intraday low. A hot print would validate the September hike probability and likely test $3,886 (October 2025 support). 6
- Oil: The IMO Hormuz evacuation plan is now operational with 35 vessels queued. Watch whether daily transit counts accelerate toward the hundreds and whether Brent contango deepens, confirming market acceptance of near-term supply excess. 16 DXY above 102 would add further downward pressure.
- Grains: Thursday's USDA weekly export sales report (June 25, 8:30 AM ET) will show whether China's rumored ~500K MT soybean purchases from last week appear on the books. 28 June 30's Planted Acreage and Quarterly Grain Stocks are the next major catalysts for corn and soybeans. The consensus range for corn acreage (−400K to −1.5M from March intentions) is wide enough to generate meaningful price discovery.
- Copper: No restart timeline has been set for Cobre Panama; a formal presidential authorization remains the largest single supply-side catalyst pending in the market. 24 China's late-June PMI releases will be the first read on whether the recent weakness in scrap imports reflects a demand slowdown or is noise.
- Geopolitics: Rubio heads to Bahrain on June 25 for the GCC ministerial. 19 The Iran nuclear track — specifically the disposition of 60%-enriched uranium, now closer to weapons grade than any previous Iranian stockpile — remains unresolved from the MoU framework. Technical talks resume by month-end.
Cover image: AI-generated editorial illustration depicting a commodity trading floor during a gold price crash.
参考ソース
- 1EnergyNews/Reuters: Gold falls to a seven-month low
- 2EnergyNews/OEDigital: Oil markets begin to indicate near-term excess supply
- 3FXStreet: US Dollar Index holds above 101.50 on hawkish Fed bets
- 4MarketWatch: GC00 Gold Continuous Contract
- 5Morningstar/Dow Jones: Comex Gold Settles 3.38% Lower at $3,990.30
- 6Forex.com/Julian Pineda: Gold Forecast — XAU/USD hits its lowest level of 2026
- 7XTB: Daily Summary — Wall Street Holds Firm While Commodities Plunge
- 8CNBC: 10-year Treasury yield falls below 4.5% as oil falls to pre-war levels
- 9Barron's: Gold Slipped Below $4,000. Don't Rush to Buy It Just Yet.
- 10Mining.com/Bloomberg: Gold price slumps as tech selloff reverberates
- 11USAGOLD: Gold Slides to $4,040 as Fed Rate-Hike Bets Drive Dollar to 1-Year High
- 12Benzinga/Kobeissi Letter: Gold ETFs Just Saw Their Biggest Weekly Inflow Since April
- 13MarketWatch: CL00 Crude Oil Continuous Contract
- 14MarketWatch: BRN00 Brent Crude Oil Continuous Contract
- 15Politico: Trump accuses oil companies of gouging drivers, orders DOJ to investigate
- 16The Straits Times: Ships start sailing through Hormuz under UN evacuation scheme
- 17IMO: Middle East — Strait of Hormuz
- 18FXStreet: US Dollar Index Forecast
- 19Reuters: Rubio meets Gulf leaders, pledges security amid Iran deal doubts
- 20Al-Monitor: Rubio says U.S. won't do anything that would undermine Gulf security
- 21AOL/NY Post: Nearly 20% of Strait of Hormuz traffic is sanctioned ships
- 22Morningstar/Dow Jones: Trump Calls for Probe Into U.S. Gasoline Prices
- 23The Moscow Times: Russian Government Weighs Total Ban on Diesel Exports
- 24Morningstar/Dow Jones: Comex Copper Settles 3.22% Lower at $5.9430
- 25MarketWatch: C00 Corn Continuous Contract
- 26Morningstar/Dow Jones: Corn Futures Drop as Traders Look to Yearly Report
- 27Successful Farming/Agriculture.com: Corn Closes Down More Than 2¢ — Wednesday, June 24, 2026
- 28AgWeb: Grains Try to Bounce Early Wednesday on Short Covering, Weather: Cattle Recover
- 29DTN Progressive Farmer: Hotter, Somewhat Drier Forecast for Midwest Next Week
- 30MarketWatch: S00 Soybeans Continuous Contract
- 31Agriculture of America: AgMarket.Net Releases Planted Acreage Estimates
- 32USDA Foreign Agricultural Service: Newsroom
- 33Pro Farmer: First Thing Today
- 34Forex.com/Michael Boutros: US Dollar Short-term Outlook
- 35MarketWatch: DXY U.S. Dollar Index Overview
このコンテンツについて、さらに観点や背景を補足しましょう。