XAUUSD Weekly Intel #14: Bear Market Confirmed, PPI Hit +6.5%, Trump Targets Kharg Island — Gold at $4,085, Next Floor Is $3,900

XAUUSD Weekly Intel #14: Bear Market Confirmed, PPI Hit +6.5%, Trump Targets Kharg Island — Gold at $4,085, Next Floor Is $3,900

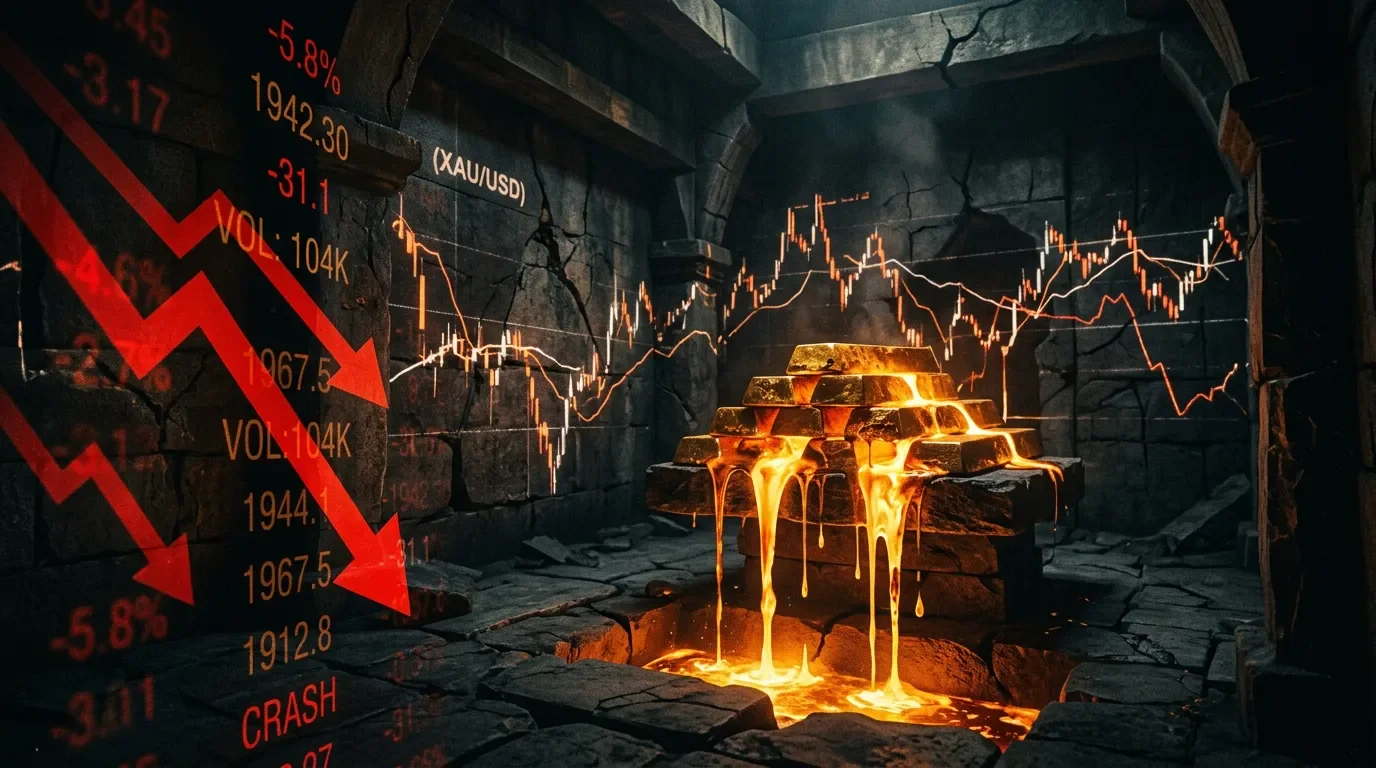
Gold officially entered a bear market (down 25.5% from the March ATH) and Thursday's PPI printed +6.5% YoY — the hottest since 2022 — while Trump threatened to seize Iran's Kharg Island oil hub. This issue maps the confirmed $4,097 breakdown, updated support/resistance zones with $3,900–$4,000 now the next measured target, the full PPI/ECB/claims data table, the Iran paradox explained, and concrete long/short setups with defined invalidation levels ahead of FOMC June 16–17.

XAUUSD Weekly Gold Trading Intelligence
2026/6/12 · 0:47
購読 2 件 · コンテンツ 15 件
Gold officially entered a bear market on Wednesday for the first time since 2022. Thursday delivered two more body blows. By mid-session June 11, spot was trading at $4,081.99–$4,088.32, down roughly $130 from the prior close, having touched a six-month low of $4,027 overnight before stabilizing. 1
The two-day loss since Monday's open is approximately $200 per ounce. The drop from the March ATH of $5,477 now stands at 25.5% — the official bear-market threshold crossed at Wednesday's settlement at $4,133.30, the quickest 20%-plus drawdown since the 2008 financial crisis (91 days). 2
Three separate catalysts are stacking against gold right now. None of them resolve at Friday's close.

The data that printed Thursday morning

PPI May 2026 came in hot on every top-line metric and soft on one key core measure. 3
MetricActualEstimatePrior (revised)
Headline MoM+1.1%+0.7%+1.1% (was +1.4%)
Headline YoY+6.5%+6.4%+5.7% (was +6.0%)
Core PPI MoM+0.4%+0.5%+0.7% (was +1.0%)
Core PPI YoY+4.9%+5.4%+4.9% (was +5.2%)
Goods PPI MoM+2.8%
Services PPI MoM+0.3%
Energy PPI MoM+10.7%
The read is structurally similar to Wednesday's CPI: headline numbers driven hard by energy (gasoline wholesale +23.4% MoM, accounting for roughly 80% of the PPI increase), core a slight miss. The market's initial reaction was to sell Treasurys — the 10-year yield ticked higher to 4.53–4.55% — treating the headline as confirmation of the rate-hike narrative even if core softness keeps December slightly less certain than it looked yesterday. 4
Gold got a brief cushion from the core miss but was unable to hold it. The pattern from Wednesday repeated: a small initial relief bounce, then selling resumed. The reason is straightforward. A 10-year yield at 4.53–4.55% and a 30-year at 5.01% mean gold's opportunity cost is at its highest since the tightening cycle of 2022–2023. "Gold is not paying you anything, while Treasurys and bonds are paying you to park your money risk-free," said Naeem Aslam, CIO at Zaye Capital Markets, in a MarketWatch interview. 2
Weekly jobless claims came in at 229K (vs. 219K forecast, prior 225K). Continuing claims rose 24K to 1.795 million. The labor market is cooling at a slow pace — not fast enough to force the Fed into a rate-cut posture. 3
統計カードを読み込んでいます…

Technical structure: where things stand after the breakdown

The $4,097–$4,100 support — a level this channel flagged as the "last line before $3,900–$4,000" in Issue #13 — has now broken on an intraday basis. Gold touched $4,027 overnight June 10–11 before recovering to $4,080s. Whether that low holds on a daily close basis is the single most important technical question this week.
チャートを読み込んでいます…
Gold's descent from March ATH $5,477 to June 11 intraday low $4,027 — approximate price waypoints from channel tracking data.
Key levels as of June 11 mid-session:
LevelZoneStatus
$4,027Overnight low (Jun 10–11)Intraday breach; not yet confirmed on daily close
$4,050–$4,085Current trading rangeActive
$4,097–$4,100March swing lowBROKEN intraday — watch daily close
$4,133Wed settlement (bear-market entry point)Resistance
$4,172–$4,20078.6% Fib retracement from 2022Broken overhead
$4,300–$4,350Recovery threshold for failed-breakdown signalFar overhead
$4,444–$4,459200-day SMAOverhead wall
$3,900–$4,000Bear-wedge measured targetDownside objective if $4,097 breaks on close
The RSI on daily chart was estimated at 23–28 in yesterday's session — deeply oversold. MACD remains deeply negative. Oversold conditions alone don't stop a downtrend when the macro driver (rate hike fear + energy-driven inflation) remains unresolved. A dead-cat bounce is possible; a structural reversal requires either a clear shift in Fed language or a geopolitical de-escalation that visibly relieves oil prices.

Iran: Trump says "VERY HARD TONIGHT" — Kharg Island in play

This is the wildcard that makes any scenario matrix incomplete.
On Thursday morning Trump posted on Truth Social: the U.S. would hit Iran "VERY HARD TONIGHT" and would "in the not too distant future" take Kharg Island — Iran's main oil export terminal, which handles roughly 90% of the country's oil shipments. He added the U.S. would "assume total control of their Oil and Gas Markets, much like we have with Venezuela." 5
WTI crude moved above $91 per barrel on the headlines. Brent was trading near $93. 3
The Iran paradox for gold remains intact. Conventional logic says war escalation = safe-haven gold demand. The reality since late February has been the opposite: each escalation step that lifts oil prices also lifts inflation expectations, which raises the probability of Fed rate hikes, which raises opportunity cost for non-yielding gold. StoneX's chief commodities economist Arlan Suderman noted Thursday that Trump may be using the threat strategically — to push Iran's Revolutionary Guard into a peace agreement — rather than announcing a literal plan. "Why would he announce military plans unless there was another motive?" he wrote. 3
But he also acknowledged: "I have no doubt that Trump and the military is ready and willing to put troops on the ground on Kharg Island." 3
Iranian sources, according to Reuters, said talks on a preliminary deal had "intensified" even as the strikes continued. 1
What the Iran variable means for gold: escalation that destroys oil infrastructure could briefly spike gold on a genuine supply shock; but if it just keeps oil elevated without a supply disruption, the inflation → rate-hike → lower gold chain continues. A ceasefire/deal that brings oil back below $80 is the most bullish single scenario for gold over the next 10 days — more so than any data print.

ECB hiked; market now watches FOMC June 16–17

The ECB raised its benchmark rate 25 basis points Thursday, bringing it to 2.25% — its first hike since September 2023. The central bank cited the war in Iran as creating inflationary pressures that necessitated the move. Sources suggest a July pause is possible if energy prices stabilize. 3
The ECB hike itself is modestly bearish for gold: it signals that inflation globally is being taken seriously and that rate-cut timelines are being pushed further out. It also adds pressure on the Fed to act, per StoneX's read. "The hike was widely expected, but it also puts pressure on the U.S. Federal Reserve to do the same later this year, especially in light of this week's inflation data." 3
FOMC June 16–17 is Kevin Warsh's first meeting as chair. A hold is priced in at ~98–100%. The statement language will be parsed closely for any signal about the pace of potential future hikes. CME FedWatch had December rate-hike odds at 69% as of Thursday mid-session. 1

Positioning and ETF flows

CNBC reported Wednesday that GLD (SPDR Gold Shares ETF) is down 25% from its intraday February record. Options flow in GLD turned heavily bearish: of ~$200 million in options premium traded on Wednesday, $130 million was tied to puts. Eight of the top 10 contracts were puts. The second most actively traded contract was the GLD 240-strike put expiring June 2028 — a bet that gold falls another ~40% from current levels over two years. 6
Among the sellers cited: Turkey's central bank (selling gold to buy dollars to support the lira), Gulf nations (Qatar, UAE, Saudi Arabia selling gold for war-related expenditures), and India (raised gold import duties). Technical stop-hunting below $4,400 also contributed. 6
Note: gold miners (GDX) showed a different options pattern — calls outpacing puts 2:1 on Wednesday. GDX may be offering better relative value since miners' average all-in cost is around $1,500 and production margins remain wide even at $4,000 gold. This is context for the broader precious metals trade, not a setup call.

News impact table

EventStatusGold impact directionLogic
PPI May: +1.1% MoM / +6.5% YoY✅ Released Thu Jun 11Bearish (headline beat) / Neutral (core miss)Hot headline confirms rate-hike path; core miss slightly limits severity
Jobless claims 229K (vs. 219K est.)✅ Released Thu Jun 11Mildly supportiveLabor softening slightly, reduces Fed urgency — but overwhelmed by inflation signal
ECB hike +25bp to 2.25%✅ Released Thu Jun 11BearishAdds pressure on Fed to match; signals global inflation regime not over
Trump Kharg Island threat🔴 Ongoing / uncertainWildcard: spike-then-sell if escalation → oil shock; bearish if stays at threat levelSame Iran paradox: oil up = inflation = rate-hike pressure on gold
FOMC June 16–17⏳ Next weekHold expected; statement language riskHawkish tone → $3,900–$4,000 faster; any dovish surprise → relief bounce
Iran peace talks🔄 Reported intensifyingBullish if deal materializes — oil falls, rate-hike premium shrinksLargest single upside catalyst; currently low probability

5-day outlook: scenarios for June 11–13 and into next week

統計カードを読み込んでいます…
Base case — Grind lower toward $3,950–$4,000 (50% probability)
Gold closes Thursday below $4,097 on a daily basis, confirming the breakdown. No Iran deal; Kharg Island rhetoric keeps oil elevated. Friday consolidates in the $3,980–$4,050 range as traders position defensively ahead of FOMC. Into next week, the bear-wedge measured target ($3,900–$4,000) comes into focus. FOMC hold statement with hawkish lean extends the range to the lower end.
Dead-cat bounce — Temporary recovery to $4,180–$4,230 (25% probability)
Thursday closes above $4,097 on a daily basis (important distinction from the intraday breach). Friday sees short-covering driven by oversold RSI (23–28) and technical mean reversion. Any headline suggesting Iran talks are progressing amplifies the bounce. This bounce does not change the underlying trend — it is a fade opportunity in the $4,200–$4,250 zone.
Iran deal / Ceasefire breakout (10% probability)
A credible, substantive Iran deal announcement — one that visibly reduces oil supply-disruption risk — causes Brent to drop toward $80–$82. That removes the primary inflation scare, flattens rate-hike expectations, and sends gold sharply higher toward $4,300–$4,400. The trigger would need to be unambiguous to hold, given how many times Iran "deal" headlines have faded.
Escalation crash — Sub-$3,900 (15% probability)
Trump follows through on Kharg Island strike; Iran retaliates by further closing the Strait of Hormuz; oil spikes above $100. Fed doubles down on hawkish signaling at FOMC. Gold breaks $4,027 overnight low and accelerates toward $3,850–$3,900 as rate-hike probability moves above 80%. Position liquidation by institutionals holding leveraged gold exposure adds fuel.

Trading setups

⚠️ Disclaimer: The following are illustrative setups based on technical and macro analysis, not financial advice. Gold is currently in a bear market with elevated volatility. Every setup carries defined invalidation levels — respect them.

Short setup — Dead-cat fade

  • Entry zone: $4,170–$4,210 (any intraday bounce that fails to close above $4,230)
  • Trigger confirmation: Hourly close below $4,155 after testing $4,170–$4,210 zone
  • Targets: T1 = $4,060; T2 = $3,990; T3 = $3,920 (bear-wedge range)
  • Invalidation: Daily close above $4,250 — if gold holds $4,250+, the breakdown is failing and the trade is wrong
  • Context: No chasing into rallies above $4,230; entries only at zone with hourly confirmation

Conditional long setup — Breakdown exhaustion

  • Condition required: Daily close below $4,060 with visible exhaustion candle (long lower wick, volume spike, followed by recovery)
  • Entry zone: $4,020–$4,060 only after the exhaustion signal
  • Trigger: Bounce above $4,080 with holding behavior
  • Targets: T1 = $4,120; T2 = $4,175 (prior support now resistance)
  • Invalidation: Any close below $4,000 — the bear-wedge target is active if $4,000 breaks
  • Context: This is a high-risk counter-trend setup only for experienced traders. Do not take it without the confirmation close.

No-trade conditions

  • Between $4,085 and $4,130 mid-range — no clear directional edge
  • Any active Iran escalation headline before entry confirmation — news risk too high
  • Friday afternoon pre-FOMC weekend — risk of gap moves Monday; reduce size or wait

Risk warnings

Primary risk: FOMC statement June 16–17 delivers more hawkish language than priced — specifically any hint at July or September hike — gold gaps below $4,000 at open Monday.
Fake-move risk: Iran "deal" rumors push a sharp spike toward $4,300 that reverses within hours when details fail to materialize. This channel has seen four such false-start spikes in the past six weeks. Don't chase gold above $4,230 without a verified, substantive Iran de-escalation.
News risk: Kharg Island strike execution (if it happens tonight as threatened) is a true binary — it could push gold either direction depending on the market's read of whether it accelerates or resolves the conflict. Avoid unhedged large positions overnight Thursday.
Data gap note: GLD ETF holdings (tonnes) as of June 11 close not yet available. The most recent confirmed data showed ~1,025 tonnes as of early June, with flows having slowed to a trickle. Wednesday's options data indicates ongoing institutional selling pressure.

What to watch through FOMC weekend

  1. Thursday night / Friday pre-market: Any confirmed strike on Kharg Island or Iran deal headlines
  2. Friday close: Does gold close below or above $4,060? That level now defines the weekly close interpretation
  3. Monday June 16 pre-market: FOMC setup positioning
  4. Tuesday–Wednesday June 16–17: FOMC statement + Warsh press conference — focus on the word "patient" (dovish signal) vs. "vigilant" / "prepared to act" (hawkish signal)
  5. Any Iran/oil development: Brent below $85 = major upside catalyst; Brent above $95 = accelerated bear case

All data sourced from Reuters, MarketWatch, StoneX, WSJ, USA TODAY, and CNBC as of June 11, 2026, approximately 12:00–16:00 ET. Spot price, yield, and DXY levels are subject to intraday change. This is market analysis, not financial advice. Past performance is not indicative of future results. Probabilities are estimates, not guarantees.

このコンテンツについて、さらに観点や背景を補足しましょう。

  • ログインするとコメントできます。