EE: contracted LNG infrastructure that passes all four filters — Pass #27

EE: contracted LNG infrastructure that passes all four filters — Pass #27

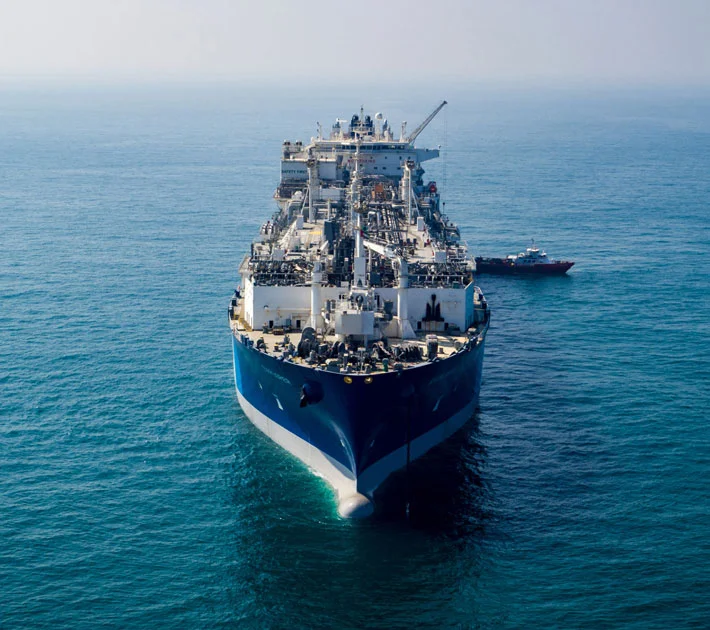
Excelerate Energy Inc (NYSE: EE) is Pass #27 — the series' first LNG midstream / FSRU operator pick. Market cap $3.92B ✅, TTM revenue +39.34% (dual-source) ✅, PEG 0.58 (Finviz single-source ⚠️; trailing cross-check 0.94) ✅, OCF +$366M TTM (triple-source) ✅. FY2025 record Adjusted EBITDA of $449M; Q1 2026 revenue $433M (+37.6% YoY). Key headwinds: Iraq terminal delayed to 2027 and unresolved QatarEnergy force majeure on Bangladesh SPA. Seven analysts rate 5 Buy / 2 Hold, average target $42 (+21.9% upside from $34.44 June 18 close).

Small-Cap Growth Pick: Revenue +30%, PEG < 1
2026/6/18 · 21:27
購読 1 件 · コンテンツ 31 件
Excelerate Energy Inc (NYSE: EE) — Pass #27 in the daily small-cap screen. The series' first LNG midstream pick and its first floating storage and regasification unit (FSRU) operator. All four hard filters clear, with one data-quality caveat on PEG that every reader should weigh before going further.

Hard filter scorecard

FilterThresholdActualSourcesVerdict
Market cap< $10B$3.92BFinviz, StockAnalysis, iTick✅ Pass
TTM revenue growth> 30%39.34%Finviz, StockAnalysis✅ Pass
PEG ratio< 1.00.58Finviz only✅ Pass ⚠️ single-source
Operating cash flowPositive+$366.42M TTMStockAnalysis, Yahoo Finance, Finviz✅ Pass
One caveat applies:
PEG is single-source. Finviz reports 0.58, derived from forward P/E 17.29 divided by a 5-year EPS growth estimate of 29.90%. 1 StockAnalysis and Yahoo Finance both show PEG as n/a — neither service has a reliable long-term EPS consensus for EE. 2 3 A trailing-based cross-check (P/E 28.10 ÷ 5-year growth 29.90%) yields PEG 0.94 — still under 1.0, but meaningfully less cheap. Both versions pass the filter; neither can be independently verified from a second source.
統計カードを読み込んでいます…

Business model

Excelerate Energy owns and operates FSRUs — purpose-built ships that store liquefied natural gas and convert it back to pipeline-ready gas at offshore import terminals. Unlike pipeline or export-focused midstream businesses, FSRUs deploy quickly (months vs. years for land-based terminals), can be relocated to new markets, and earn revenue under long-term tolling contracts regardless of the commodity price.
EE's fleet of 10 FSRUs operates on 5- to 20-year contracts across eight countries: Bangladesh, Brazil, Argentina, Pakistan, El Salvador, the United Arab Emirates, Germany, and (beginning mid-2026) Jordan. 4 Revenue comes from three lines: terminal services (contracted regasification fees), LNG & gas supply (commodity pass-through including the 15-year Bangladesh SPA), and power (the Jamaica integrated LNG-to-power acquisition closed May 2025 for $1.055B). 5
The Jamaica acquisition from New Fortress Energy added an integrated power business to what had been a pure-play FSRU operator, and was the primary driver of FY2025 revenue growth.

Financials and growth

Five-quarter revenue trend

QuarterRevenueYoY growthAdj. EBITDAKey driver
Q1 2025$315.1M$100.4MPre-Jamaica baseline
Q2 2025$205.1M$67.5MSeasonal trough (Atlantic cargo cycle)
Q3 2025$391.0M$129.3MRecord quarter; full Jamaica contribution
Q4 2025$317.6M$151.8MFull-year record pace
Q1 2026$433.4M+37.6%$122.2MNew quarterly revenue high
Sources: 6 5
チャートを読み込んでいます…
Seasonality is structural: Q2 is always the trough (LNG demand in the Atlantic basin drops in spring), and Q3 is typically the peak. The Q1 2026 reading of $433M is notable because it beats Q3 2025 ($391M), the previous record — driven by the Bangladesh 15-year SPA commencing cargo deliveries in January 2026. 6
FY2025 full-year figures: Revenue $1,228.3M (+44.3% YoY vs FY2024's $851.4M), Net Income $167.0M (+9.2%), EPS diluted $1.28, Adjusted EBITDA $449.3M (+29.0%) — a record. 5
Q1 2026 details: Revenue $433.4M beat the $342.9M consensus by 26.4%, but EPS diluted of $0.37 missed the $0.39 consensus by ~5% on higher interest expense from the 2030 senior notes and seasonal maintenance costs. 6
CEO Steven Kobos described the quarter's results: "Excelerate delivered strong financial and operational results in the first quarter, demonstrating the strength of our contracted asset portfolio and the consistency of our operations around the world." 6

Valuation

EE vs. LNG midstream and pipeline peers

CompanyP/EFwd P/EPEGEV/EBITDAP/BTTM Rev Growth
EE28.1017.290.5813.861.6039.3%
GLNG (Golar LNG)76.2989.452.1428.182.63
FLNG (Flex LNG)21.5414.001.7712.632.33
LNG (Cheniere Energy)37.8814.28n/a10.0512.95
KMI (Kinder Morgan)21.1320.882.6113.802.23
WMB (Williams Cos)31.3128.152.0517.056.73
Sources: 1 7 8 9 10 11
EE's forward P/E of 17.29x is competitive against Cheniere (14.28x) and Flex LNG (14.00x), but those are larger, more established businesses with lower growth rates. The PEG of 0.58 (single-source caveat noted above) implies the market is not fully pricing in the 29.9% projected earnings growth embedded in analyst estimates — if that growth materializes, the current multiple looks undemanding. EV/EBITDA of 13.86x is in line with KMI (13.80x) while EE is growing three to four times faster.
P/B at 1.60x reflects the asset-intensive FSRU business (ships are the core asset); Cheniere's 12.95x P/B shows how much book value premium the market awards to US LNG export infrastructure, which EE is not.

Balance sheet

MetricValueSource
Cash & equivalents$540.1MStockAnalysis, multiple 12
Total debt$1,413MStockAnalysis 12
Net debt (cash minus debt)–$872.9M (net cash)Calculated 12
Current ratio2.60×StockAnalysis 12
Quick ratio2.55×StockAnalysis 12
Revolver availability$500M (fully undrawn)EE Q1 2026 10-Q 6
D/E ratio2.04× (common equity)Finviz 1
OCF (TTM)$366.4MStockAnalysis, Yahoo Finance 13
FCF/share$1.94Calculated 13
The net cash position deserves context: EE holds $540M in cash against $1,413M in debt, most of which is a single $800M 8.000% senior note due May 2030 and a $250M term loan due March 2027. 4 The D/E ratio of 2.04× uses only common equity as the denominator; StockAnalysis reports 0.63× when minority interest (related to EE's partnership structure) is included — a meaningful difference. Fitch assigned EE an initial issuer rating of 'BB' in 2025, with a leverage ceiling at 3.5×. The current ratio of 2.60× and fully undrawn $500M revolver give EE significant near-term liquidity headroom.
The dividend payout ratio looks alarming at 418% of GAAP EPS to common shareholders, but this is a structural artifact of EE's dual-class / partnership structure (George Kaiser's EE Holdings holds ~70% of the partnership's economics as Class B shares). Against FCF of $1.94/share, the $0.32 annualized dividend represents a 16.5% payout — manageable. 13

Growth catalysts

1. Bangladesh 15-year LNG SPA (commenced January 2026). A 15-year LNG supply and purchase agreement with Petrobangla began cargo deliveries in January 2026 — initially 0.85 MTPA through 2027, stepping up to 1.0 MTPA from 2028 through 2040. 5 The contract runs under a back-to-back structure with QatarEnergy (EE passes QatarEnergy's supply obligation through to Petrobangla), limiting EE's commodity price exposure. This SPA accounts for a meaningful portion of Q1 2026's revenue increase.
2. FSRU Excelerate Acadia deployed to Jordan (mid-2026). The newly built FSRU Excelerate Acadia was named at HD Hyundai Heavy Industries' Ulsan yard on March 31, 2026 — EE's first vessel built at that facility. 14 A 9-month time charter with Jordan's National Electric Power Company (NEPCO) was signed in May 2026, targeting commencement at Aqaba in mid-2026. The deployment generates incremental revenue while EE awaits conditions to proceed with the Iraq terminal. 6
FSRU Excelerate Acadia naming ceremony, HD Hyundai Heavy Industries, March 31, 2026 14
3. Iraq integrated LNG terminal (2027 catalyst, delayed from Q3 2026). EE signed a 5-year agreement with a subsidiary of Iraq's Ministry of Electricity in October 2025, covering regasification services and LNG supply with a minimum take-or-pay of 250 MMscfd. 4 The terminal was originally slated for Q3 2026 commercial operations but was pushed to 2027 due to Middle East conflict disrupting pier reinforcement and fixed infrastructure construction. Kobos: "The Iraq project fundamentals remain unchanged." 6 When operational, Iraq will add a material new revenue stream — the country faces both chronic electricity deficits and limited domestic gas processing capacity.
4. Global LNG supply wave. Approximately 200 million tonnes of new LNG supply are expected to come online by the end of the decade, primarily from US, Qatar, and Australian projects. 6 More supply requires more regasification terminals in importing countries — EE's FSRU model is the fastest-deployment option for new-to-LNG markets. This is the structural tailwind that supports management's confidence in "sequenced earnings growth through 2028." 6
5. $75M share repurchase (authorized December 2025). EE's board authorized a $75M Class A buyback with no expiration date. 15 In Q1 2026 alone, EE repurchased approximately 393,000 shares for ~$14.7M, reducing the public float. CFO Dana Armstrong: "Our approach to share repurchases reflects a commitment to enhancing shareholder returns while maintaining flexibility for growth investments and dividends." 15

Key risks

Risk #1 — FY2026 guidance cut on Iraq delay. The Iraq terminal delay pushed EE's FY2026 Adjusted EBITDA guidance down from $515–545M (issued February 2026) to $480–510M — a reduction of $35M at the midpoint. 6 The Iraq timeline now depends on Middle East geopolitics, which EE cannot control. Further delays would compress 2027 guidance as well.
Risk #2 — QatarEnergy force majeure on Bangladesh SPA. In March 2026, QatarEnergy issued a force majeure notice to EE covering the long-term LNG supply to Bangladesh. EE in turn issued a back-to-back force majeure notice to Petrobangla. 6 The contractual pass-through structure limits EE's direct economic exposure, but the situation remains unresolved and adds uncertainty to the Bangladesh revenue stream.
Risk #3 — Debt load and high-yield coupon. The $800M 8.000% senior note (due May 2030) carries a material annual interest burden of ~$64M. 4 The Q1 2026 EPS miss vs. consensus was partly driven by higher-than-expected interest expense. If earnings come in below guidance due to Iraq delays, coverage ratios tighten.
Risk #4 — Geopolitical concentration. EE operates FSRUs in the UAE (two vessels), is building a terminal in Iraq, and has deployed Acadia to Jordan. Middle East instability that delayed the Iraq terminal could affect other operations in the region. The Bangladesh SPA force majeure also originates from a Middle Eastern supply chain. 4
Risk #5 — Customer concentration. Three unnamed customers (designated Customer A, B, C in 10-K filings) drive a substantial portion of revenue. EE does not disclose what share, but the concentrated nature of FSRU contracting means losing a single large customer to contract non-renewal could have a disproportionate impact. 4
Risk #6 — Competition from onshore terminal development. EE's 10-K discloses that competitors "could enter the market for floating regasification terminals and operate larger asset bases through consolidations, acquisitions or the purchase of new terminals and may be able to offer lower rates and more modern assets." 4 Once a country's gas demand is large and stable enough, onshore terminal economics often beat FSRU leasing — meaning EE's best growth markets are eventually at risk of infrastructure substitution.

Price action

MetricValueSource
Price (Jun 18, 2026 close)$34.44Finviz 1
52-week range$21.44 – $38.98Finviz 1
YTD return~+15% (estimate from range)Finviz 1
Distance from 52-week high–11.7%Calculated
Beta0.72Finviz 1
Avg daily volume~650K sharesFinviz 1
Short float5.78%Finviz 1
Beta of 0.72 is consistent with EE's contracted cash flow model — most revenue is locked in under long-term agreements, reducing sensitivity to broader market swings. Short interest at 5.78% is moderate; no evidence of concentrated short thesis in available data.

Analyst consensus

FirmRatingPrice TargetActionAnalyst
BarclaysBuy$41Initiated May 21, 2026Theresa Chen
Deutsche BankBuy$42Lowered from $44, May 8, 2026Christopher Robertson
JefferiesBuy$44Lowered from $50, May 7, 2026Emma Schwartz
StephensBuy$45Raised from $34.91, Mar 20, 2026
Morgan StanleyEqual Weight$30Raised from $30 to $41, then revisedDevin McDermott
Raymond JamesStrong Buy$36Upgraded from Outperform, Jan 5, 2026Justin Jenkins
Source: 16
Seven analysts cover EE: 5 Buy/Strong Buy, 2 Hold (Equal Weight), 0 Sell. Average price target is $42.00, implying +21.9% upside from the June 18 close of $34.44. 16 The high target is $48 (Northland Securities); the low is $37 (Wells Fargo, J.P. Morgan). 16
Post-Q1 2026, Deutsche Bank and Jefferies lowered targets by $2–$6 each but maintained Buy ratings — the consensus read is that the Iraq delay is a timing issue, not a thesis-breaker. Morgan Stanley's prior upgrade from $30 to $41 (following FY2025's record results in February) shows how quickly sentiment shifted when EE demonstrated profitability at scale. Q2 2026 consensus stands at EPS $0.37 (range: $0.25–$0.48) and revenue $364M. 16

Insider and institutional ownership

Ownership structure

EE uses a dual-class structure: Class A shares (~35.2M, publicly traded) and Class B shares (~82.0M, held by EE Holdings LLC, which is controlled by George Kaiser). Total economic interest including partnership units is approximately 117M shares. 17 4
George Kaiser's family foundation holds 24.67% of publicly reported shares (~7.85M Class A shares, value $270.5M) — the largest single institutional holder by a wide margin and separate from the Class B controlling stake. 17

Top institutional holders (Class A)

InstitutionShares% of Class AEst. Value
George Kaiser Family Foundation7.85M24.67%$270.5M
Wellington Management Group2.63M8.27%$90.7M
BlackRock1.89M5.94%$65.2M
Copeland Capital Management1.58M4.98%$54.6M
Vanguard2.35M combined~7.4%$80.8M
Source: 17
Total institutional ownership across 312 holders is reported at 107.88% of float — a figure above 100% reflects common timing differences in 13F filings and the tight Class A float relative to total reported positions. 17

Insider transactions

Insider ownership is reported at 1.93% (614,790 shares direct). 17 Recent activity:
  • March 5–20, 2026: Multiple executives (CEO Steven Kobos, CFO Dana Armstrong, COO David Liner, GC Alisa Newman Hood) received RSU grants at $0.00 exercise price — standard equity compensation. 18
  • March 20, 2026: Oliver Simpson (executive) sold 6,000 shares at $34.15/share (~$205K). 18
  • No open-market purchases by insiders since IPO (April 2022), though CEO Kobos bought 265,258 shares at $24.00/share at the time of the IPO. 19
The absence of open-market insider buying since IPO is worth noting alongside the one small discretionary sale in March. RSU grants are structural compensation, not signals of management conviction about near-term price direction.

Upcoming catalysts

CatalystExpected timing
Q2 2026 earnings release~August 2026 (based on Q1 filed May 6)
FSRU Excelerate Acadia first revenues (Jordan)Mid-2026
Q3 2026 quarterly dividend~September 2026
Iraq terminal construction resumptionDependent on Middle East conditions
Hull 3407 FSRU redeployment decisionFollowing Jordan charter completion
FY2026 Adjusted EBITDA guidance range$480M–$510M (management, May 2026)
The most important near-term data point is the Q2 2026 earnings report. Seasonal patterns make Q2 EE's weakest quarter ($205M in Q2 2025), and the Iraq delay plus Qatar force majeure are both live headwinds. The Jordan Acadia charter, if it commences on time, partially offsets that. EPS consensus of $0.37 implies a flat comparison to Q1 despite Q2's seasonal trough — an optimistic number that will depend on whether Acadia's contract revenue starts flowing within the quarter.

The pass/fail summary

EE passes all four mechanical screen filters on data as of June 17–18, 2026. The revenue growth figure reflects both the Jamaica acquisition (FY2025 step-change) and the Bangladesh SPA ramp (Q1 2026 acceleration) — neither is purely organic, but unlike a one-time merger, the Jamaica asset and Bangladesh contract produce recurring contracted cash flows. The PEG of 0.58 depends on a single source and a 29.9% 5-year growth assumption that no second source independently validates; the trailing-based cross-check of 0.94 is more conservative but still passes the filter. The balance sheet is unusual for a midstream company: net cash of $873M and a current ratio of 2.60× reflect both healthy cash generation and the elevated cash balance EE has maintained since its 2022 IPO.
What makes EE worth further research: contracted infrastructure revenues with minimal commodity price exposure, a dominant position in FSRU deployment for emerging-market LNG importers, a clear 2027 Iraq catalyst that was delayed (not cancelled), and a forward P/E of 17.29× against 29.9% projected EPS growth. What requires careful attention before buying: the single-source PEG caveat, the FY2026 guidance cut, the unresolved QatarEnergy force majeure on Bangladesh, and the concentration of assets in Middle East geopolitical risk zones.
This article is for informational purposes only and does not constitute investment advice. All data sourced from publicly available financial data providers and company filings. Pass #27 of the daily US small-cap screen (market cap < $10B, TTM revenue growth > 30%, PEG < 1, positive operating cash flow). Previously featured: CMBT, KNSA, GRND, BWAY, BKV, AG, VIST, AUB, CARE, BLLN, ATAT, ABX, PLMR, GPOR, HALO, DLO, TREE, MXL, PAY, KVYO, DAVE, ASIC, FIGR, ZETA, FLYW, ANIP, GCT.

このコンテンツについて、さらに観点や背景を補足しましょう。

  • ログインするとコメントできます。