
June 11, 2026 commodity settlement recap
Gold hits 6-month low $4,046 on bear market day 2; WTI reverses PPI selloff to ~$91 on Kharg Island threat; WASDE lifts soybeans +11¢.

⚠️ Prices are intraday estimates as of ~11:45–15:00 ET. COMEX metals close ~1:30 PM ET; CBOT grains close ~1:20 PM CT; CME official settlements typically post 30–60 minutes after the close. All figures should be confirmed against CME/ICE official settlements.
Settlement / intraday price summary
| Commodity | Contract | Est. Settlement | Prior Close | Change | Change % | Day Range |
|---|---|---|---|---|---|---|
| Gold | COMEX GCQ6 (Aug '26) | ~$4,098–4,112 | $4,133.30 | −$21–35 | −0.53% to −0.85% | $4,046 – $4,139 |
| WTI Crude | NYMEX CLN6 (Jul '26) | ~$90.63–91.13 | $90.03 | +$0.60–1.10 | +0.67%–1.22% | $88.63 – $93.64 |
| Brent Crude | ICE continuous | ~$93.20–94.16 | ~$93.44 | +$0–0.72 | ~flat to +0.77% | ~$92.98 – $94.16 |
| Corn | CBOT ZCN6 (Jul '26) | ~418.75–420.00¢ | 419.00¢ | −0.25¢ | −0.06% | 414.50 – 420.00¢ |
| Soybeans | CBOT ZSN6 (Jul '26) | ~1,118–1,134¢ | 1,123.00¢ | −4¢ pre- / +11¢ post-WASDE | −0.38% → est. +~1% | 1,115.75 – 1,125.00¢ |
| Copper | COMEX HGN6 (Jul '26) | ~$6.2720 | $6.2670 | +$0.005 | +0.08% | $6.1715 – $6.2840 |
Prior closes are June 10, 2026 final settlements. Soybean estimate reflects post-WASDE recovery at 12:43 PM CT; official close pending.
Macro backdrop: PPI and ECB divide markets
The session's main cross-asset theme was the divergence between a scorching headline PPI print and a slightly soft core reading — a split that proved relevant for each commodity market in different ways.
May 2026 PPI final demand rose +1.1% month-over-month (consensus: +0.7%) and +6.5% year-over-year, the highest annual rate since November 2022's +7.4%. 1 Energy drove the surge: goods prices jumped +2.8% MoM — the largest single-month gain in the series' history going back to December 2009 — with gasoline alone up +23.4% MoM and crude petroleum +11.8% MoM. 2 Core PPI (ex food and energy) came in at +0.4% MoM, missing the +0.5% consensus, and the YoY reading held flat at 4.9%. That miss in core was enough to keep bond yields from spiking: the 10-year Treasury yield actually fell ~3–4 basis points to ~4.52%–4.53%, and equities moved modestly higher (S&P 500 +0.39%). 3
Initial jobless claims for the week ended June 6 came in at 229,000, above the 220,000 forecast and the 225,000 prior reading — a 4½-month high. The 4-week moving average rose to 219,000 from 214,750. 4 Jefferies' chief U.S. economist Thomas Simons attributed the move to end-of-school-year seasonal distortions (school bus drivers, cafeteria workers) rather than rising layoffs, noting that unadjusted claims of 228,000 ran about 7% below the same week in June 2025. He added a hedge: "Although we are optimistic about the labor market, things could turn quickly given the pessimism over energy prices and the war in Iran." 4
At midday, the European Central Bank raised its deposit rate by 25 basis points to 2.25% — its first hike since 2023. The ECB simultaneously raised its 2026 inflation forecast to 3.0% and cut GDP growth to 0.8%. 5 ECB President Christine Lagarde declined to pre-commit to further moves: "The outlook remains uncertain, with upside risks for inflation, and downside risks for economic growth. We are not pre-committing to a particular rate path." 5 Deutsche Bank's chief European economist Mark Wall described it as "the first hike by one of the major global central banks in response to the energy shock." 5
CME FedWatch currently shows roughly 67% probability of at least one Fed rate hike by December 2026, essentially unchanged from pre-PPI levels. The FOMC enters its June 16–17 meeting (Kevin Warsh's first as chair) in blackout. A hold is near-certain; the signal to watch will be whether hawkish language is added to the policy statement. 6
Gold: bear market day 2, 6-month low
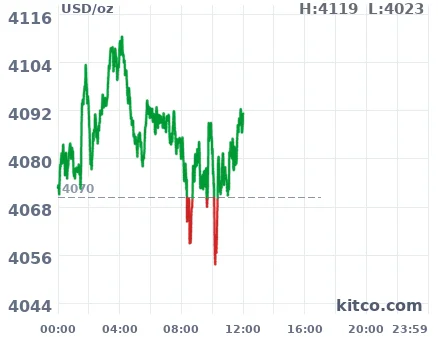
Gold's bear market entered its second session with GCQ6 (August 2026) hitting an intraday low of $4,046.20 — the lowest print since November 2025, and a 6-month nadir. 8 The contract was trading near $4,098–4,112 at mid-afternoon, down $21–35 from the June 10 close of $4,133.30, on volume of roughly 124,000–134,000 contracts — approximately 344% of the 65-day average. 9 10
From the March 11, 2026 all-time peak of $5,354.80, gold has now declined −23.5%, well inside confirmed bear-market territory (defined as −20% from a peak). The 5-day drawdown through mid-session stood at −8.98%; the 1-month loss at −12.62%; 3-month at −20.58%. 9
The driver isn't a lack of geopolitical tension — the Iran-U.S. conflict is now in its fourth day. Instead, gold is being re-rated as markets price the Iran shock as a structural inflation event rather than a one-way haven bid. Hot PPI, the ECB's first hike since 2023, and the Fed's increasingly hawkish lean are lifting real yields and the dollar simultaneously, both headwinds for bullion. The DXY held above 100.20 for most of the session. 11
Saxo Bank's head of commodity strategy Ole Hansen said "$4,075/oz is now in play" as the next meaningful support, combining the March correction low and the 38.2% Fibonacci retracement. Hansen identified $4,500/oz as the level gold must reclaim before the 50-day moving average near $4,600 comes into focus for any bullish case. "While the long-term bullish case remains intact, the market is currently being driven by a very different set of forces." 12
Citi cut its 0–3 month target from $4,300 to $4,000 on June 9, citing stabilizing real yields, a stronger dollar, and moderating safe-haven demand. Its 6–12 month target remains $4,500. 13 Standard Chartered's Suki Cooper flagged that at least 270 tonnes of gold ETF holdings are now in loss-making territory at ~$4,250/oz, rising to 298 tonnes if prices touch $4,000. Bloomberg-tracked gold ETF holdings have fallen 88 tonnes year-to-date to 3,048 tonnes. 14 JPMorgan separately noted retail and institutional investors have retreated from the "debasement trade," citing ETF outflows and weaker futures positioning. 8
One countervailing signal: the National Bank of Georgia purchased $100 million in physical gold today, bringing gold's share of its international reserves to 15.5% and total reserves to a record $7.0 billion. This is Georgia's first gold purchase since March–April 2024. 15 Central bank demand of this type is largely price-insensitive and reinforces a longer-term floor, per the National Bank of Georgia — but it is insufficient on its own to stabilize intraday trend flows driven by rate-hike repricing.
WTI & Brent: PPI selloff reversed by Kharg Island threat
WTI CLN6 (July 2026) printed an intraday low of $88.63 in the early session as hot PPI data triggered rate-hike fears and profit-taking following the prior session's Iran-driven gains. The slide reversed course sharply after President Trump posted on Truth Social threatening to "hit Iran VERY HARD TONIGHT" and seize Kharg Island — Iran's principal crude oil export terminal, through which approximately 90% of Iran's oil exports flow. 16
By mid-afternoon, WTI had recovered to $90.63–91.13, up $0.60–1.10 (+0.67%–1.22%) from the June 10 settlement of $90.03. 17 18 The full intraday swing from $88.63 to $93.64 spanned roughly $5.01. Brent (continuous contract) traded at $92.98 at 1303 GMT per Reuters, spiked toward ~$94.16 on the Kharg Island threat, before easing back to roughly $93.20 in the afternoon. 19 The Brent-WTI spread narrowed to approximately $2.57–2.88 from the $3.50–3.70 baseline of recent sessions, with WTI outperforming as U.S. crude benefits from Hormuz route disruption while Brent absorbs more of the risk-premium volatility. 19

Hormuz: competing claims, continuing transits
Iran's joint military command declared the Strait of Hormuz "closed until further notice" on June 10–11, warning that any vessel attempting passage would come under fire. The U.S. military contradicted this directly, posting on X: "Commercial ships continue to transit in and out of the Strait of Hormuz." 19 Three LNG tankers were confirmed to have exited the strait with AIS transponders switched off, bound for Asia per LSEG/Kpler ship-tracking data. Sixteen tankers were reported clustered off Oman for ship-to-ship transfers.
The Jalveer incident brought the CENTCOM blockade totals to 9 vessels disabled, 135 redirected, and 42 humanitarian vessels allowed to proceed since April 13. 20 Earlier in the week, three Indian crew members aboard the Palau-flagged MT Settebello were confirmed dead after a U.S. precision strike on that vessel's engine room on June 9 — the first seafarer fatalities since the blockade began. Ship manager IOS Marine FZE (Dubai) demanded an international probe and categorically rejected CENTCOM's account, saying the vessel received no warnings and had been stationary for approximately 10 days. Maritime intelligence firms TankerTrackers.com and Windward both identified Settebello as fitting a dark-fleet profile: six flag changes in six years, fraudulent registry, and repeated AIS spoofing. 21 22
Diplomatic track
Reuters reported that a political understanding has been reached in U.S.-Iran interim deal talks, though the mechanism for releasing frozen Iranian assets remains unresolved. Iran is seeking $6–12 billion released directly to Tehran; the U.S. wants a staged release restricted to humanitarian goods. The proposed framework would temporarily ease Iran's grip on the Strait of Hormuz and provide phased access, while ending the U.S. blockade on Iranian ports. Nuclear enrichment questions would be deferred to future talks. 23 One Iranian source characterized the military situation to Reuters as "a dead end" for both sides.
Supply fundamentals
OPEC lowered its 2026 global oil demand growth forecast a second consecutive time, to 970,000 barrels per day from 1.17 million bpd. OPEC+ crude output averaged 33.13 million bpd in May, down 190,000 bpd from April; Iran posted the sharpest single-country production decline as the U.S. blockade curbs its exports. 24 EIA data released June 10 showed U.S. crude inventories fell 7.2 million barrels for the week ended June 5 — to 426.5 million barrels — against a 4-million-barrel drawdown consensus. The next EIA weekly release is scheduled for June 18. 19
Corn: flat in pre-WASDE holding pattern, edges higher post-report
CBOT July corn ZCN6 spent most of the morning range-bound, trading at 418.75¢/bu by mid-session — down just 0.25¢ (−0.06%) from the June 10 settlement of 419.00¢. Day range: 414.50–420.00¢. Volume ran at 135,500 contracts against a 65-day average of 203,480, reflecting deliberate caution ahead of the noon WASDE release. 25
The June WASDE was released at 12:00 PM ET (11:00 AM CT). 26 Pre-report trade estimates (Dow Jones survey) called for U.S. corn 2025-26 ending stocks of roughly 2.146 billion bushels, versus May's 2.142 billion — a negligible change. 27 Post-WASDE snapshots at 12:43 PM CT showed July corn at approximately +0.75¢ from its pre-report level, suggesting the report came in near expectations. 28
The week's export sales report (released June 11 at 8:53 AM ET) showed corn bookings of 1.93 million metric tons, beating the high end of analyst estimates by approximately 130,000 tons. 29 New-crop commitments had reached 97.5% of the full-year USDA export goal as of the report.
Corn remains −10.48% over the past month and −5.05% year-to-date, having fallen from a 2026 calendar-year high of 485.75¢ on May 4 to early-June contract lows before the partial recovery over the last two sessions. 27
Wet conditions in the Corn Belt add a potential upside variable: eastern Illinois and all of Indiana received up to 8 inches of rain on newly emerged crops in recent days, causing nitrogen washout. Wyffels Hybrids agronomy manager Robby Meeker reported that "our soil just quite frankly can't handle that much that fast. So much of it just runs off and causes washout issues, and everything we intended on being in our field is now in our drainage ditches." 30 DTN's Market Weather Outlook flagged continued heavy rain moving through the central U.S. into next week. At current low price levels, most affected farmers are unlikely to apply rescue nitrogen treatments — Meeker called it "a huge hurdle in the economic environment that we're in." 30 The June WASDE was not expected to capture this weather damage; it may show up in July.
Soybeans: worst week since February ends with WASDE bounce

CBOT July soybeans ZSN6 opened the session on the defensive, trading down to 1,118.75¢/bu by mid-morning — a 4.25¢ decline (−0.38%) from the June 10 settlement of 1,123.00¢. Volume was 54,480 contracts, only 47% of the 65-day average of 116,960 — a clear signal that traders were unwilling to take directional bets ahead of the report. 31
The WASDE turned sentiment. At 12:43 PM CT, July soybeans were +11¢ from pre-report levels, reversing all of the morning's losses and then some. 28 The neutral-to-slightly-bullish reaction was consistent with pre-report positioning: the Dow Jones consensus called for U.S. soybean 2025-26 ending stocks of roughly 336 million bushels (vs. May's 340 million), implying a modest tightening. 27 DTN's lead analyst Rhett Montgomery had flagged a lower-than-consensus bias for soybean ending stocks, noting that crush pace through April was running 8.7% ahead of the year-prior rate while USDA had only projected 7.6% growth.
The China demand picture remained the market's primary structural headache. For the week ended June 4, weekly export sales totaled only 352,800 tons — at the low end of analyst forecasts — and China was not listed as a leading buyer. 29 New-crop U.S. soybean sales are at their slowest start since 2003, per DTN, despite the White House's May announcement of a $17 billion annual agricultural purchase framework from Beijing. 27
The DTN pre-WASDE survey expected Brazil's 2025-26 soybean crop at 180.4 million metric tons (vs. May WASDE's 180 mmt) and Argentina's at 48.6 mmt (vs. May's 48 mmt). 27 These are broadly neutral numbers; any upward revision to Brazilian or Argentine supply in the actual report would have capped the post-WASDE bounce.
Soybeans are −6.26% over the past month but still +6.83% year-to-date. The June 11 WASDE bounce tentatively ends what had been a 7-session losing streak through June 10.
Copper: tariff shock absorption on day 4
COMEX July copper HGN6 recovered from an overnight low of $6.1715 — down 1.94% from the June 10 settlement of $6.2670 — to trade at approximately $6.2720 by late morning, a +0.08% gain on the day. Intraday high reached $6.2840. Volume was 31,350 contracts (107% of the 65-day average of 29,250), and open interest stood at 100,705. 32
The $0.1005 intraday bounce from the overnight low marks the fourth session of the Section 232 15% tariff on copper imports (effective June 8). The pattern across the four sessions — initial shock selling followed by partial recovery — is consistent with the market beginning to absorb the tariff into price structure rather than continuing to sell through it. Over the prior five trading days, copper had cumulatively lost −3.94%. Year-to-date, the contract remains +8.06%; 1-year performance: +24.01%. The 52-week range is $4.5330 to $6.7160.
Citi's commodities desk, in a June 9 note, maintained an expectation that industrial metals — particularly aluminum and copper — will "take centre stage" in the latter half of 2026, calling it consistent with their "longstanding call for the precious metals bull market to broaden into industrial metals." 13 No copper-specific analyst commentary on day-4 tariff mechanics was found from primary sources in today's session.
A continued firm DXY above 100 remains a headwind for all dollar-denominated commodities, copper included. 11
Agriculture watch: screwworm expands to New Mexico
A separate USDA development with potential livestock and cattle-market implications: CNN reported a sixth New World screwworm (Cochliomyia hominivorax) case in the U.S. — a dog in Lea County, New Mexico, the first confirmed case in that state. The fifth U.S. case, a goat in Gillespie County, Texas, was confirmed on June 8. 33 USDA separately unveiled "Novo Fly," a novel sterile fly strain engineered to produce only male sterile flies, which USDA Under Secretary Scott Hutchins said would "almost instantaneously double the number of sterile flies we put in the fight." 34 Mexico's Matapa sterile fly facility is expected to begin production this month, targeting 100 million flies by year-end; combined with Panama's existing 100-million-fly capacity, total sterile fly output would reach approximately 200 million. The Dallas Fed has estimated the potential damage to the southwestern U.S. beef industry in the billions of dollars if the infestation is not contained. 33
Session key levels and drivers summary
| Commodity | Key level to watch | Primary driver today | Secondary driver |
|---|---|---|---|
| Gold GCQ6 | $4,075 (next support per Saxo); $4,500 (reclaim threshold) | Hot PPI + real yield rise + ECB hike | Iran conflict priced as inflation shock, not haven bid |
| WTI CLN6 | $88.63 (session low / support); $93.64 (session high) | Trump Kharg Island threat (reversal catalyst) | PPI-driven early selloff; deal-track uncertainty |
| Brent | ~$92 (pivot); $94 (resistance) | Hormuz closure claims vs. CENTCOM denial | Brent-WTI spread compression |
| Corn ZCN6 | 414.50¢ (session low); 420.00¢ (session high) | WASDE release (neutral); export sales beat | IL/IN nitrogen washout (weather risk, not yet priced) |
| Soybeans ZSN6 | 1,115.75¢ (session low); WASDE bounce est. ~1,134¢ | WASDE neutral-to-bullish reaction (+11¢ post-report) | China absence from export sales; poor new-crop demand |
| Copper HGN6 | $6.1715 (session low / tariff-shock trough); $6.28 (resistance) | Section 232 tariff day 4 (shock absorption) | DXY above 100 (headwind) |
Cover image: commodity trading price tickers. AI-generated illustration.
参考ソース
- 1BLS PPI News Release – May 2026
- 2CNBC: PPI May 2026
- 3Investing.com: Economic Calendar
- 4MarketWatch: Jobless claims rise to 4½-month high
- 5CNBC: ECB hikes interest rates
- 6MarketWatch: The key to the upcoming Fed meeting
- 7Kitco: Live Gold Prices
- 8CNBC: Gold slumps to 6-month low
- 9MarketWatch: GCQ26 overview
- 10CNBC: Gold COMEX Aug '26 quote
- 11Kitco AM Report: Gold, silver edge lower
- 12Kitco: $4,075/oz gold now in play
- 13Kitco: Citi cuts near-term gold target
- 14Kitco: Gold ETF redemptions risk — Standard Chartered
- 15Kitco: National Bank of Georgia buys $100M in gold
- 16The Guardian: Middle East crisis live, June 11
- 17MarketWatch: CLN26 overview
- 18CNBC: WTI Crude Jul '26 quote
- 19Reuters: Oil prices steady as investors weigh US-Iran escalation
- 20gCaptain: Third tanker disabled this week
- 21Reuters: India demands end to US attacks on ships
- 22gCaptain: Ship manager demands international probe
- 23Reuters: US, Iran inch toward interim deal
- 24Reuters: OPEC again lowers 2026 demand growth forecast
- 25MarketWatch: Corn continuous contract
- 26USDA: WASDE June 2026
- 27DTN: After late May, early June price plunge
- 28DTN: Periodic updates on grains
- 29MarketWatch: US corn and wheat export sales beat projections
- 30Brownfield Ag News: Downpours challenging farmers
- 31MarketWatch: Soybeans continuous contract
- 32MarketWatch: HGN26 overview
- 33CNN: Screwworm reaches the US
- 34DTN: USDA confirms 5th NWS case
このコンテンツについて、さらに観点や背景を補足しましょう。