
Day 5: What your display is actually telling you
Your eBike's display changes dozens of times per minute — but most new riders only watch the battery bar. Learn what speed, assist level, battery %, trip odometer, and range estimate actually mean, see them in action on the Scott Sub Tour eRIDE with Bosch eBike Flow, and do a 3-step hands-on exercise to connect the numbers to real riding decisions.
Your eBike's display is a small screen with big implications. Those four or five numbers change dozens of times per minute, but most new riders ignore everything except the battery bar. By the end of today's lesson, you'll be reading the display actively — not just glancing at it.
Today's concept
Every standard eBike display shows the same core set of readings. Here's what each one means and — just as important — what it doesn't:
| Reading | What it shows | What it doesn't show |
|---|---|---|
| Speed | Current speed in mph or km/h | Average speed for the ride |
| Assist level | Your selected mode (e.g., Eco / Tour / Sport / Turbo) | Actual watts being delivered right now |
| Battery | State of charge, usually as % or bar segments | Exact km remaining |
| Trip distance | Kilometres or miles since your last reset | Cumulative lifetime distance |
| Odometer | Total lifetime distance on the bike | When the next service is due |
Some displays also show a range estimate — a number like "42 km remaining." That figure is calculated from your current battery % and your recent average power draw. It's a live guess, not a guarantee. Ride harder uphill and that number will drop faster than you'd expect; ease into Eco on a flat stretch and it climbs back up. Think of it as a moving average, not a countdown.
Why it matters
Once you understand what Days 1–4 taught you, the display becomes a feedback loop:
- The assist level indicator tells you which wattage budget (from Day 3) you're spending. Seeing "Turbo" means the controller is authorising up to ~250–300W — that's burning through your 400 Wh battery four to five times faster than Eco.
- The battery % is the raw Wh story from Day 4 compressed into a single number. At 50% on a 400 Wh battery, you have roughly 200 Wh left — which, combined with your assist level and terrain, maps back to the range formula you saw yesterday.
- The speed readout is where Class 1/2/3 rules (from Day 1) become concrete. Class 1 and 3 motors cut assist at 20 mph and 28 mph respectively — you'll see the assist level go quiet on the display as you cross that threshold, even if you keep pedalling.2
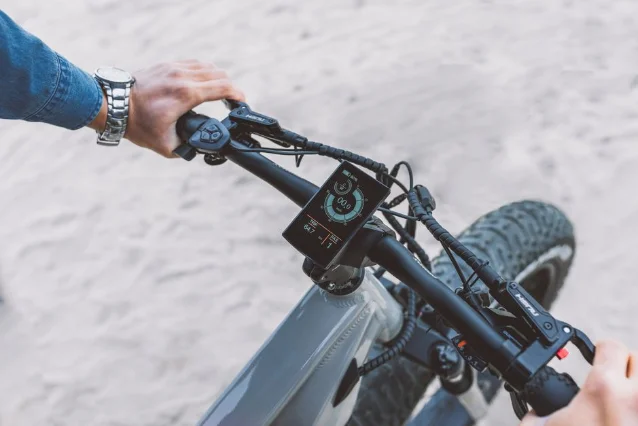
One real example: the Scott Sub Tour eRIDE
The Scott Sub Tour eRIDE is a city and trail crossover bike that runs a Bosch Performance Line motor with a 625 Wh battery and a Kiox 500 display. The Kiox 500 is one of the more capable displays on the market: its 2.8-inch colour touchscreen shows speed, assist level, battery %, trip distance, cadence, and remaining range simultaneously, with the ability to customise which tiles appear and in what order.3
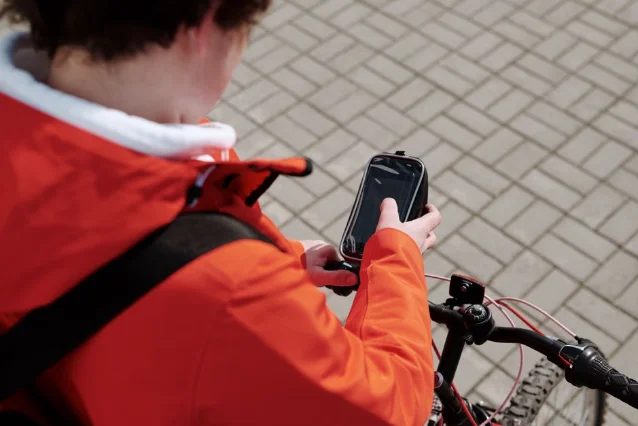
What makes the Scott eRIDE a useful example isn't the display spec itself — it's the pairing with the Bosch eBike Flow app. Once you connect your phone via Bluetooth, the app extends what the display can do:
- Route planning: plan a route on your phone (or import one from Komoot), then get turn-by-turn arrows pushed to the Kiox display, so you're never reaching down to check a map mid-ride.
- Ride statistics: every ride is automatically logged — distance, elevation, average speed, assist-level breakdown, and (with a heart-rate monitor) fitness data. The app also syncs to Strava.
- Firmware updates: Bosch pushes software improvements over Bluetooth. The bike you buy in spring 2025 can receive better battery temperature management or new assist profiles without a trip to the shop.
- Display customisation: through the app you can swap tiles on the Kiox 500 from over 30 data options — useful if you want cadence front-and-centre during fitness rides, or arrival time during a commute.
Not every brand has this level of app integration. Shimano offers the E-TUBE PROJECT app for its STEPS systems (similar display customisation and firmware updates), while Rad Power Bikes uses a proprietary app with more limited data. But the principle is the same across brands: the display is the hardware layer, and the app is the software layer. Together, they give you a full picture of your ride.
One small exercise
Before your next ride — or right now if your bike is nearby — do this:
- Power on your eBike and note the current battery %.
- Set the assist to Eco, then switch to Turbo. Watch whether the range estimate changes (it will drop in Turbo, rise in Eco).
- If you have a companion app, open it and find where ride history is stored. Notice the data that was recorded the last time the bike was used.
The goal isn't to memorise every tile — it's to understand that the display is a live window into the three components you learned about in Days 1–4. Speed and assist level come from the controller; battery % comes from the battery; and the motor's behaviour is the link between all three.
Tomorrow we'll move to Day 6, where we wrap up the fundamentals week with a full look at the eBike class system and how it determines where you're actually allowed to ride.
このコンテンツについて、さらに観点や背景を補足しましょう。