FY2022 ROE
47.2%
FY2023 ROE
38.8%
FY2024 ROE
37.1%
3yr Avg ROE
41.0%
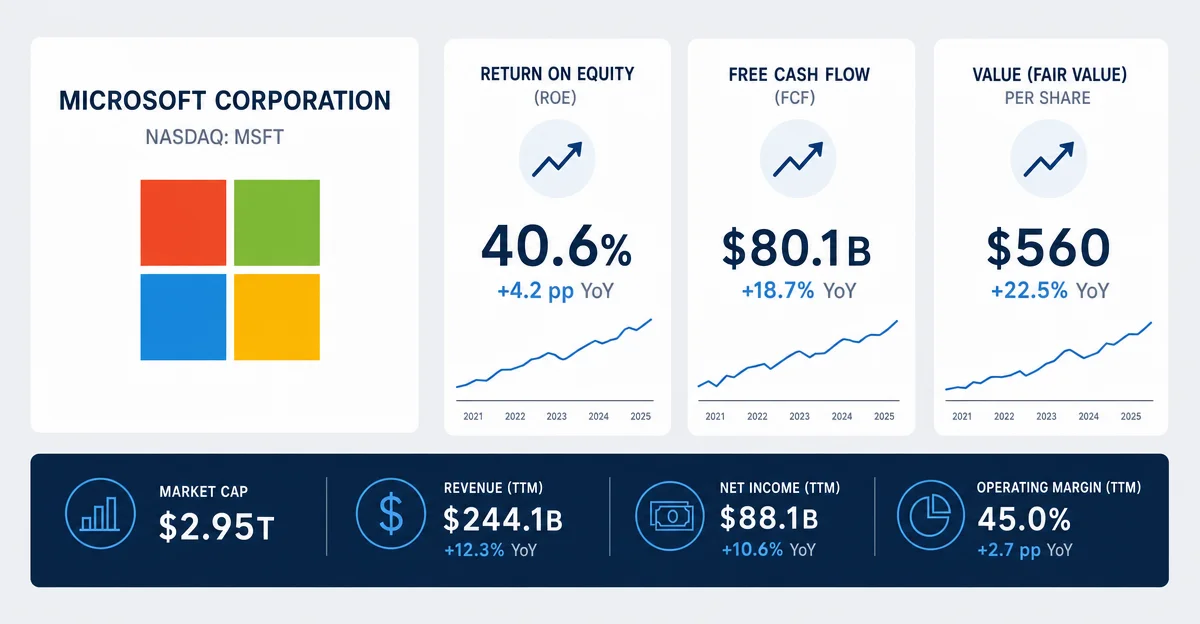
Microsoft clears all three screening gates: 3-year average ROE of 41%, free cash flow above $59B in every year since FY2022, and a forward P/E near 22× on 25% expected EPS growth. Today's data, key risks, and what the valuation implies.
| Fiscal Year | Net Income | Avg Shareholders' Equity | ROE |
|---|---|---|---|
| FY2022 (ended Jun 2022) | $72.7B | $154.3B | 47.2% |
| FY2023 (ended Jun 2023) | $72.4B | $186.4B | 38.8% |
| FY2024 (ended Jun 2024) | $88.1B | $237.4B | 37.1% |
| Fiscal Year | Free Cash Flow |
|---|---|
| FY2022 | $65.1B |
| FY2023 | $59.5B |
| FY2024 | $74.1B |
| FY2025 | $71.6B |
このコンテンツについて、さらに観点や背景を補足しましょう。