Microsoft (MSFT) — key metrics snapshot (June 2, 2026)
Price $441.31 | Market cap $3.28T | Based on TTM and FY2025 data
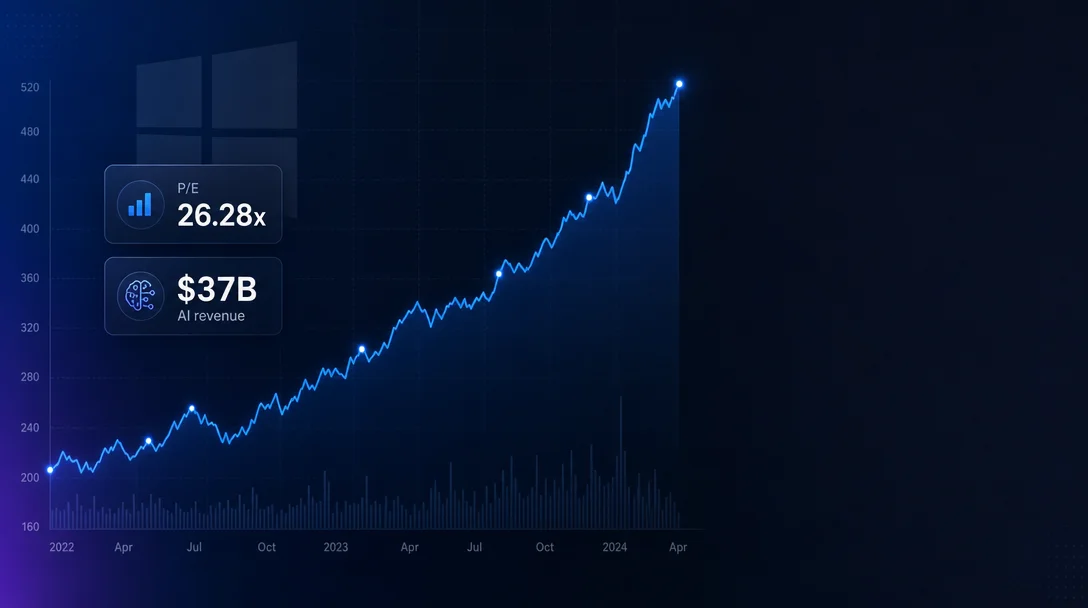
Microsoft Corporation (NASDAQ: MSFT) passes all three hard screening criteria: ROE of 35.09% / 32.83% / 29.65% for FY2023–FY2025 (SEC EDGAR XBRL verified, each year well above the 15% threshold); FCF of $59.5B / $74.1B / $71.6B (all positive, FY2025 dip driven entirely by $64.6B AI CapEx); and a trailing P/E of 26.28x — 22.6% below its own 5-year average of 33.96x and roughly at peer median. The article covers all nine required information areas: business model and three-segment breakdown, year-by-year ROE table, FCF chart and trend, valuation metrics with 7-peer comparison table, net income / operating income / margin trends, balance sheet (D/E 11.8%, interest coverage 80.3x, AAA/Aaa/AAA tri-agency rating), five risk factors (FTC antitrust, EU DMA, AI CapEx ROI, cybersecurity, insider activity), near-term catalysts (July 2026 Q4 earnings, M365 price increases effective July 2026, 27% analyst consensus upside), and competitive moat (46.8% operating margin vs. peers, 450M+ M365 seats, Azure share gains vs. AWS). A bull/bear framework closes the article.

| Fiscal year | Net income | Stockholders' equity | ROE |
|---|---|---|---|
| FY2023 (ended June 30, 2023) | $72,361M | $206,223M | 35.09% ✓ |
| FY2024 (ended June 30, 2024) | $88,136M | $268,477M | 32.83% ✓ |
| FY2025 (ended June 30, 2025) | $101,832M | $343,479M | 29.65% ✓ |
| Fiscal year | Net income | YoY growth | Operating income | Operating margin |
|---|---|---|---|---|
| FY2021 | $61,271M | — | $69,916M | — |
| FY2022 | $72,738M | +18.7% | $83,383M | — |
| FY2023 | $72,361M | −0.5% | $88,523M | 41.8% |
| FY2024 | $88,136M | +21.8% | $109,433M | 44.6% |
| FY2025 | $101,832M | +15.5% | $128,528M | 46.7% |
| Q3 FY2026 (quarter) | $31,800M | +23.0% | $38,400M | 46.8% |
| Company | Trailing P/E | Forward P/E | P/B | EV/EBITDA | P/FCF | FCF yield |
|---|---|---|---|---|---|---|
| MSFT (Microsoft — cloud, AI, productivity, OS) | 26.28x | 23.87x | 7.91x | 18.03x | 44.96x | 2.22% |
| GOOGL (Alphabet — search, GCP, digital ads, AI) | 27.61x | 28.96x | 9.16x | 26.99x | 68.05x | 1.47% |
| AAPL (Apple — consumer hardware, services ecosystem) | 38.21x | 34.58x | 43.41x | 28.55x | 35.84x | 2.79% |
| AMZN (Amazon — e-commerce, AWS) | 30.68x | 30.75x | 6.24x | 18.30x | n/a† | −0.09% |
| META (Meta — social media, digital advertising) | 21.74x | 18.21x | 6.22x | 13.93x | 31.44x | 3.18% |
| ORCL (Oracle — enterprise database, cloud OCI) | 43.89x | 32.41x | 20.96x | 30.12x | n/a† | −3.52% |
| ADBE (Adobe — Creative Cloud, Document Cloud) | 15.28x | 10.88x | 9.31x | 11.11x | 10.27x | 9.74% |
| CRM (Salesforce — CRM platform, enterprise apps) | 23.31x | 14.43x | 4.80x | 15.14x | 15.14x | 8.91% |
| Peer median (7 peers excl. MSFT) | 27.61x | 28.96x | 9.16x | 18.30x | 31.44x | 2.79% |
| Metric | FY2025 (ended June 30, 2025) |
|---|---|
| Long-term debt | $40,400M |
| Debt-to-equity (long-term debt / equity) | 11.8% |
| Interest coverage (operating income / interest expense) | 80.3x |
| Current ratio (current assets / current liabilities) | 1.35 |
| Total assets | $619,003M |
| Credit ratings | S&P AAA (stable); Moody's Aaa; Fitch AAA |
このコンテンツについて、さらに観点や背景を補足しましょう。