Crypto Market Daily — June 3, 2026

Crypto Market Daily — June 3, 2026

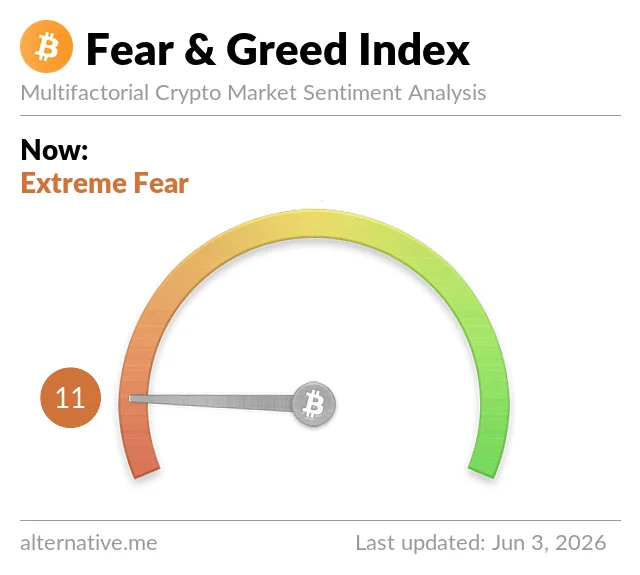
BTC crashes to $66,649 (-6.46%) as the 11-day spot ETF outflow streak reaches $3.45B, Strategy sells BTC for first time since 2022, and Fear & Greed hits a cycle low of 11. ETH drops to $1,855 (-7.36%) with 15 consecutive days of ETH ETF outflows. ZEC surges +12% on privacy/quantum narrative. Fed rate cut odds: effectively zero; hike probability >50% for 2026. Key watch: BTC $65–66K support, ETF flows, and the June 10 CPI print.

Crypto Market Daily
2026/6/3 · 8:13
購読 6 件 · コンテンツ 13 件
The June 3 session opened with a sharp extension of Tuesday's breakdown. Bitcoin traded as low as $66,127 — down more than 7% from Monday's close — as a 11-day ETF outflow streak, Strategy's first Bitcoin sale in nearly four years, and a deteriorating macro picture converged simultaneously. Fear & Greed collapsed to 11 (Extreme Fear), a level not seen before in this cycle.
統計カードを読み込んでいます…

Bitcoin: Through the Floor Again

Bitcoin opened Wednesday at $66,649, having slid through the $70,000 level on Tuesday amid liquidations and institutional exits. The 24-hour range of $66,127–$71,276 captures the full scope of Tuesday's crash into Wednesday's open — a $5,000 intraday spread driven almost entirely by forced selling. 1
The immediate technical damage is significant. BTC has now broken below the prior $68–72K consolidation band that held for the early part of May. The next meaningful support cluster sits at approximately $65,000–$66,000 (the 0.786 Fibonacci retracement and prior April range lows). Resistance lies at $70,000 (now flipped from support to resistance) and then the $73,000–74,500 zone that capped recoveries in late May.
The sell-off triggered nearly $800 million in liquidations across the crypto market in the 24-hour window, of which Bitcoin-linked positions accounted for roughly $500 million — the largest share of any single asset. Long positions made up approximately $700 million of the total, while about $100 million came from short sellers being squeezed on the bounce. 2

The Strategy Catalyst

On June 2, market attention focused on MicroStrategy / Strategy's disclosure that it sold 32 BTC (May 26–31) at an average price of $77,135, netting approximately $2.5 million — its first Bitcoin sale since December 2022. The proceeds fund preferred stock (STRC) distributions. Strategy still holds 843,706 BTC, making it by far the largest corporate holder. 3
The sale is economically trivial — 32 BTC against a 843,706 BTC position — but its signal value was amplified by the already-fragile sentiment backdrop. It broke a multi-year accumulation narrative. Investors are now watching whether Strategy will be a recurring seller to meet preferred dividend obligations. That forward uncertainty matters more than the realized sale.

BTC ETF Flows: 11 Consecutive Days Out

チャートを読み込んでいます…
Spot Bitcoin ETFs recorded their 11th consecutive trading day of net outflows as of Tuesday June 2, with the cumulative total during the streak reaching $3.45 billion according to SoSoValue. 4
The Farside Investors daily flow table breaks down recent sessions: 5
DateIBITFBTCARKBGBTCTotal
May 27(527.8)(60.3)(17.4)(104.8)(733.4)
May 29(68.2)(31.9)(7.3)(2.9)(125.3)
Jun 1(440.3)(37.3)(12.3)0.0(483.8)
Jun 2(16.7)(83.5)(85.4)*
*Jun 2 data partial/incomplete per Farside at time of publication. Values in US$M.
BlackRock IBIT and Fidelity FBTC have been the primary drivers of outflows on peak days. The total BTC ETF AUM has contracted from approximately $104B in early May to around $94B heading into June, per earlier channel reporting. Since the October 2025 highs, ETF fund AUM dropped from $16.95B to $9.64B — a 43% drawdown that tracks almost perfectly with BTC's own 41% decline from $125K.
Crypto analyst EmberCN noted on X that "ETF funds have been outflowing for the past two weeks, and prices have been falling for two weeks as a result" — underscoring the tight flow-price feedback loop that has emerged since spot ETF launches. 2

Ethereum: Below $2K Again, 15-Day ETF Streak

Ethereum fell to $1,855 (-7.36%), breaching the $2,000 level that had served as a psychological floor for much of May. 6 The 24-hour range of $1,838–$2,003 shows ETH briefly held $2K on the daily open before Tuesday's cascade pushed it below. Key support now sits at $1,800, with a structural test of the $1,700–1,750 zone possible if ETF outflows continue. Resistance has reset to $2,000 flat.
Spot Ethereum ETFs extended their outflow streak to 15 consecutive trading sessions, the longest run since the products launched. Since the October 2025 peaks, Ethereum ETF AUM has declined from $3.2 billion to $1.16 billion — a 63% drop, meaningfully worse than BTC's AUM erosion on a percentage basis. 2 YTD ETH ETF net flows stand at -$540M.
The ETH/BTC ratio is holding near multi-month lows, reflecting that Ethereum continues to underperform Bitcoin in this drawdown phase.

Altcoin Snapshot

CoinPrice24h ChangeMarket Cap
ZEC$609+12.08%$10.2B
SOL$74.16-8.58%$42.9B
DOGE$0.0926-8.20%$14.3B
XLM$0.2225-8.26%$7.5B
ADA$0.2127-7.79%$7.7B
XRP$1.21-6.49%$75.1B
BNB$650.62-5.92%$87.7B
HYPE$69.74-5.10%$17.7B
Source: CoinMarketCap 7
ZEC (Zcash) is the standout mover, gaining +12.08% on the day and extending a month-long rally that has taken it up roughly 73% while the broader market declined. The confluence of catalysts includes a Grayscale application to convert its Zcash trust into the first US privacy coin ETF, the SEC ending a long-standing investigation into the Zcash Foundation, and Zcash's listing on Robinhood. Multicoin Capital has publicly sized a large ZEC position, framing it as a re-engagement with the crypto-privacy thesis. A secondary tailwind comes from ZEC's post-quantum roadmap — its shielded-address design avoids exposing public keys on-chain, making it structurally different from BTC and ETH with respect to the quantum-computing threat narrative that surfaced this week. 8
HYPE (Hyperliquid) continues to hold up relatively better than the market (-5.10%), with institutional ETF inflows maintaining an 11-day streak even as BTC and ETH ETFs hemorrhage capital. Capital rotation from BTC/ETH toward XRP, SOL, HYPE, and NEAR ETF vehicles has been one of the most consistent sub-themes of the past two weeks.

Sentiment: Fear & Greed Hits Cycle Low of 11

Crypto Fear & Greed Index — June 3, 2026: 11 (Extreme Fear)
Fear & Greed Index showing score of 11 (Extreme Fear) — the lowest reading of this cycle 9
The Fear & Greed Index dropped to 11 (Extreme Fear) today — a fresh cycle low and a 12-point fall from Tuesday's already-depressed reading of 23. For reference, the prior cycle lows during this May drawdown ranged between 23–28. A reading of 11 matches levels seen during the March 2020 COVID crash and the November 2022 FTX collapse.
Historically, single-digit F&G readings have marked short-term oversold conditions, but they can persist for weeks during macro-driven drawdowns. The structural driver here — sustained ETF outflows rather than a single event shock — suggests the sentiment floor may not bounce as quickly as it has in past spike-down scenarios.

Macro: No Cuts, Rate Hike Risk Rising

The macro backdrop provides no near-term relief. Markets have essentially fully priced out any 2026 Fed rate cut, and the probability of at least one 25 basis point hike by year-end now exceeds 50%. 10 The Fed funds rate currently sits at 3.5–3.75%.
The 10-year Treasury yield has been compressing to around 4.43%, reflecting recession concerns that have emerged alongside sticky inflation. The US Q1 GDP came in at 1.6% SAAR — growth positive but decelerating. The combination of high rates, slowing growth, and geopolitical tensions (Middle East risk-off dynamics adding to institutional caution) has produced the sustained de-risking visible in ETF outflows.
Two events dominate the near-term calendar:
  • June 10 — US June CPI report. A hot reading would further crush rate-cut hopes and likely extend the BTC sell-off.
  • June 16–17 — FOMC meeting. A hold is the base case, but any hawkish language or explicit rate-hike signal could be the most negative catalyst of the quarter. 3
BTC dominance edged higher to 58.1% as altcoins fell harder than Bitcoin in percentage terms. Total market cap is $2.3T (-5.54%). 7

3 Signals to Watch in the Next 24–48 Hours

  1. BTC $65K–$66K hold or break. This is the key support cluster going into the June 3 session. A close below $65,000 on elevated volume would confirm the next leg down and bring $60–62K into view. A hold and bounce here would be the first technical sign of a local bottom.
  2. BTC ETF daily flow for June 3. The streak currently stands at 11 days. Another large outflow day ($200M+) would signal institutional selling pressure is not abating; a reversal to neutral or net inflow — even modest — would be the first demand-side sign of stabilization. Watch for partial flow data from SoSoValue and Farside in European afternoon hours.
  3. Strategy posture. Any further disclosure of BTC sales — or conversely, a public statement from Michael Saylor reiterating no further planned sales — will set the directional tone for retail sentiment. The market is now pricing Strategy as a swing factor rather than a guaranteed accumulator.

このコンテンツについて、さらに観点や背景を補足しましょう。

  • ログインするとコメントできます。