PGR — key metrics snapshot (May 29, 2026)
Price $190.40 | Market cap $111.3B | Based on TTM and FY2025 data

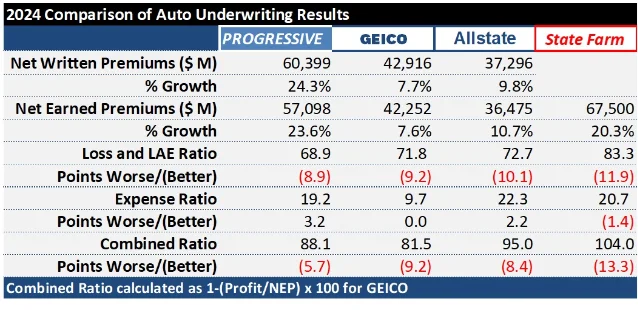
Progressive Corporation (NYSE: PGR) clears all three hard screening criteria: ROE of 19.25% / 33.14% / 37.29% for FY2023–FY2025 (SEC EDGAR XBRL verified); three consecutive years of positive and growing FCF ($10.4B / $14.8B / $17.2B); and a trailing P/E of 9.68x sitting 46% below its own 5-year median of 17.91x. The article covers Progressive's telematics-driven underwriting model, the full SEC-sourced ROE table, FCF trend, a 5-peer valuation comparison table (TRV/ALL/CB/HIG/CINF), balance sheet data (D/E 0.26x, interest coverage 50.9x, AM Best A+ / Fitch AA), risk factors (earnings normalization, BI severity, CFO transition, insider selling), the variable dividend structure, and a bull/bear framework anchored to Q2 2026 combined ratio and net premiums written growth.

| Fiscal year | Net income | Stockholders' equity | ROE |
|---|---|---|---|
| FY2023 (ended Dec 31, 2023) | $3,902.4M | $20,277.1M | 19.25% ✓ |
| FY2024 (ended Dec 31, 2024) | $8,480.0M | $25,591.0M | 33.14% ✓ |
| FY2025 (ended Dec 31, 2025) | $11,308.0M | $30,323.0M | 37.29% ✓ |
| TTM (to Mar 31, 2026) | $11,559.0M | ~$30,500M | ~37.9% |
| Year | Revenue | Net income | Net margin | Operating margin |
|---|---|---|---|---|
| FY2023 | $62,108.5M | $3,902.4M | 6.28% | 8.33% |
| FY2024 | $75,372.0M | $8,480.0M | 11.25% | 14.58% |
| FY2025 | $87,671.0M | $11,308.0M | 12.90% | 16.54% |
| Q1 2026 | $22,188.0M | $2,818.0M | 12.70% | ~16.0% |
| Company | Trailing P/E | Forward P/E | P/B | EV/EBITDA | ROE | FCF yield |
|---|---|---|---|---|---|---|
| PGR (Progressive) | 9.68x | 12.02x | 3.47x | 7.89x | 37.9% | 14.76% |
| TRV (Travelers Companies — P&C insurer, independent agents) | 8.68x | 10.48x | 1.94x | 6.70x | 25.3% | N/A |
| ALL (Allstate — personal auto/home) | 4.55x† | 7.80x | 1.80x | 4.03x | 45.2% | 21.74% |
| CB (Chubb — global P&C, specialty) | 11.01x | 11.35x | 1.64x | 9.91x | 15.4% | N/A |
| HIG (Hartford — commercial/personal/group benefits) | 8.93x | 9.36x | 1.88x | 7.07x | 22.7% | 16.70% |
| CINF (Cincinnati Financial — regional P&C, 65-yr dividend grower) | 9.02x | 17.98x‡ | 1.55x | 6.59x | 18.7% | 14.12% |
| Peer median | 8.93x | 10.48x | 1.80x | 6.70x | 22.7% | 16.70% |
| PGR vs. median | +8.4% | +14.7% | +92.8% | +17.8% | +15.2pp | −1.9pp |
| Metric | FY2023 | FY2024 | FY2025 | Q1 2026 |
|---|---|---|---|---|
| Total debt | — | — | $8,390M | $8,386M |
| Stockholders' equity | $20,277M | $25,591M | $30,323M | $32,039M |
| D/E ratio | — | — | 0.28x | 0.26x |
| Interest coverage (tax basis) | — | — | ~53x | 50.9x |
| Favorable prior-year reserve development | — | — | — | $451.0M |
このコンテンツについて、さらに観点や背景を補足しましょう。