San Francisco: The Return — A Metro Deep-Dive

San Francisco: The Return — A Metro Deep-Dive

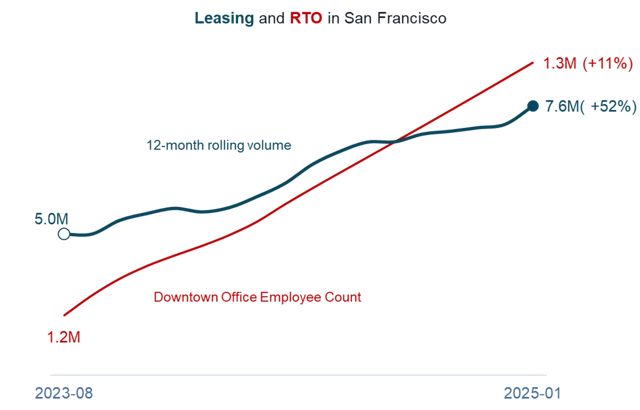
San Francisco's tech comeback is real, but narrow. This issue triangulates five data signals — office leasing records, AI firm clustering in Mission Bay, venture capital concentration, the housing demand indicator, and leading-indicator metrics — to answer one question: why did SF come back, and how durable is it? Verdict: the recovery is driven by a single industry forming the most concentrated AI cluster in the world, not by a broad-based urban revival.

Where Tech Lives
2026/6/10 · 21:03
購読 1 件 · コンテンツ 1 件
Issue 001 · Metro Deep-Dive · June 2026

The question

San Francisco was supposed to be the cautionary tale. Office vacancy cracked 36% in 2024 — the worst of any major U.S. market. Marquee companies fled or shrank. Every pundit had a eulogy ready. Then, before the funerals were scheduled, the city started filling back up.
So: is this real, or is it just AI hype dressed in lease filings?
The short answer: it's real, but narrow. The recovery is geographically specific, driven by a single industry, and does not mean the city has returned to 2019 conditions. What it does mean — for anyone trying to read tech geography — is that physical co-location still drives concentrated value creation, and San Francisco has stumbled into the strongest AI clustering dynamic in the world.
Here's the signal stack.
統計カードを読み込んでいます…

Signal 1: The office market — what the lease data actually shows

Start with the hardest data available: commercial real estate transaction records.
According to Kidder Mathews' Q1 2026 report (as of April 2026), San Francisco leasing activity hit 3.4 million square feet in Q1 2026 — up 43% year-over-year, and the sixth consecutive quarter exceeding 2.0 million SF.1 Net absorption — the actual number that measures whether tenants are taking more space than they're vacating — came in at +855,000 SF for the quarter, the strongest single-quarter performance since 2019.1
The VTS leasing index framed it more starkly: San Francisco's tech sector drove office demand up 165% in 2025, with AI companies signing leases faster than in any previous cycle.2
コンテンツカードを読み込んでいます…
These are hard numbers. Lease signings are recorded transactions, not sentiment surveys.
The caveat worth stating clearly: vacancy is still 28.0% — down 370 basis points from Q1 2025, but still nearly three times the national office market's typical healthy range. Twenty-nine million square feet sit vacant. This is a directional recovery, not a restoration. The market peaked at roughly 31–32% vacancy in 2024 and is now descending from that peak, but slowly.1
One structural positive that tends to get underweighted: zero square feet under construction. With no new supply entering the market, any net absorption directly compresses vacancy. The city effectively has a supply ceiling, which means leasing momentum translates into tighter conditions faster than it would in a market still building.
JLL Research chart: SF office leasing volume and office employee count rising together from Aug 2023 to Jan 2025
SF office leasing (millions SF) and office employee count tracked together Aug 2023–Jan 2025. 3 Source: JLL Research

Signal 2: The clustering logic — why OpenAI isn't moving to Columbus

The most revealing data point in the San Francisco story isn't a city-level aggregate. It's a single square mile.
OpenAI's original headquarters is at 3180 18th Street — the Mission District.4 From that anchor, the company has assembled a footprint that is difficult to square with any simple cost or talent narrative:
  • 550 Terry Francois Blvd., Mission Bay — 315,000 SF (signed 2024, former Old Navy HQ)
  • 1455 and 1515 Third St., Mission Bay — 486,600 SF (subleased from Uber, 2023)
  • 1800 Owens, Mission Bay — 222,000 SF (Q1 2026)
Total San Francisco footprint as of Q1 2026: approximately 1.0 million square feet, spread across adjacent Mission Bay buildings.14
Anthropic is doing the same thing, just in SoMa: 420,000 SF at 300 Howard, 102,000 SF at 400 Howard, and 104,000 SF at 505 Howard — three buildings, all within walking distance.1
This is clustering behavior, and it is deliberate. The economists who study agglomeration would recognize the pattern: firms in the same industry co-locate to share a labor market, knowledge spillovers, and the informal deal-making that happens between buildings rather than on Zoom. OpenAI isn't filling Mission Bay because the rent is cheap — it isn't — but because the density of AI talent, adjacent companies, and investor networks makes the proximity worth the cost premium.
What's happening in Mission Bay is also a displacement story. The neighborhood was built for biotech. Nektar Therapeutics, one of its early anchors, has downsized significantly, freeing space now being repositioned for tech tenants. Alexandria Real Estate, which co-developed the campus, filed for an expansion of office entitlements from 24,000 SF to 500,000 SF citing AI demand.4 One industry's retreat is funding another's expansion.

Signal 3: Venture capital as gravity — the Bay Area's funding advantage

If physical clustering reveals where AI is concentrating, venture capital data reveals why it's durable.
According to Crunchbase and HumanX's 2025 AI Funding Report, AI companies globally raised $211 billion in 2025 — up 85% from 2024. Of that, 60% ($126 billion) went to Bay Area companies, despite the region accounting for only 22% of global AI deals.5 Within the Bay Area, 81% of all startup capital flowed to AI businesses — an 11 percentage-point increase from the prior year.5
The concentration deepens at the seed stage, where the next generation of companies begins. Crunchbase data from May 2026 shows the Bay Area captured 45% of all U.S. seed funding in 2025, up from 33% in 2024 and 28% in 2023.6 Startups outside the top four metro areas represented just 28% of U.S. seed funding in 2025 — the lowest share on record.6
GeographyShare of U.S. seed funding (2023)Share of U.S. seed funding (2025)
Bay Area28%45%
New York~17%~17%
Greater LA~6–7%~5%
Greater Boston~6–7%~4%
All others~46%28%
Source: Crunchbase (as of May 2026). Figures rounded.
This matters for tech geography because venture capital is a leading indicator of where companies will be headquartered, where engineers will be hired, and therefore where office demand will materialize in 18–36 months. The concentration is still accelerating — which means Mission Bay's lease filings today are the downstream consequence of funding decisions made two years ago, and the next wave has already been committed.
The counter-argument — that remote work or distributed hiring should reduce geographic concentration — is not showing up in the data. Capital is becoming more concentrated, not less, even as distributed work norms persist.

Signal 4: Housing as a demand indicator (not the story)

Residential rents in San Francisco are not the cause of the recovery, but they are the most legible symptom of it.
Median one-bedroom rent reached $3,069 in August 2025 — up 11.5% over the prior year, the fastest rent growth of any major U.S. city at the time.7 San Francisco's city controller's office described rising rents as "a sign of economic vitality" in its July 2025 economic status report — framing that would have been politically untenable even two years earlier.7
What this number signals, in the framework of this brief: workers are moving back. Demand for proximate housing tracks demand for proximate employment, which tracks where companies are actually putting their people. A 12% single-year rent increase in a city with a 28% office vacancy rate is not a contradiction — it reflects the bifurcated nature of the recovery. The office market has enormous slack from the departures of 2020–2022. The residential market has much less, because housing supply in San Francisco is structurally constrained in ways office supply is not.
The eviction data attached to the same period is worth noting without over-interpreting: eviction notices reached their highest rate since 2018, with filings for nonpayment having tripled year-over-year by mid-2025.7 The AI workforce entering the market earns at rates that displace existing residents. That's a different story — urban economics and displacement — but it's a downstream consequence of the same demand shock, and it's real.

The leading indicator: physical clustering by dominant firms

Pulling across all four signals, the most useful forward-looking indicator is not headline vacancy rate or aggregate VC dollars. It's the pace and concentration of major AI firm office commitments in a specific submarket.
When anchor tenants of OpenAI and Anthropic's scale make multi-building, multi-year commitments in adjacent zip codes, they create conditions that pull competitors and suppliers into proximity. The firms that need to hire the engineers those companies are training; the law firms and banks that service their funding rounds; the accelerators and seed funds that want to be next to the deal flow — all of these follow the anchor.
Mission Bay and the stretch from 3rd Street to Howard Street is currently the highest-conviction geography for this dynamic in the United States.
What this doesn't mean: that San Francisco's full office market is recovering uniformly. The 28% vacancy figure is real. Much of the vacant space is older, suburban-style office product with no amenity investment — exactly the kind that Kidder Mathews and others consistently flag as losing tenants to trophy buildings. The gap between Class A and Class B/C is widening, not narrowing. Landlords who can't convert or renovate are facing extended vacancy.
What the data doesn't yet tell us: whether this dynamic expands beyond AI or whether it stalls if AI funding cycles retrench. The Silicon Valley Indicators data shows San Francisco raised $34 billion in VC in 2024, up from $11.4 billion the prior year.7 That is a very steep ramp. Steep ramps can reverse.

Verdict

San Francisco came back because of AI, and specifically because AI's economics heavily favor physical co-location among researchers and engineers working on frontier models. The city didn't do anything particularly smart to earn this — it had the talent pool, the existing clustering infrastructure, and the proximity to the capital stack, and a single technological wave of unusual magnitude amplified all three.
The recovery is real. It is not broad. It is not guaranteed. And it tells you more about the geography of AI than it tells you about the geography of tech.
The leading indicator to watch going forward: the Anthropic/OpenAI submarket in SoMa and Mission Bay. When sublease availability in those zip codes starts dropping, or when asking rents for adjacent buildings start moving, that signals the second-order clustering effect is activating. As of Q1 2026, sublease availability citywide is down 15% year-over-year to 4.6 million SF — its lowest since early 2020.1 The first-order wave has already landed.

Data sources and as-of dates: Kidder Mathews Q1 2026 SF Office Market Report (April 2026); VTS Office Demand Index via SF Business Journal (January 2026); Crunchbase/HumanX 2025 AI Funding Report (February 2026); Crunchbase U.S. Seed Funding Analysis (May 2026); SF Standard reporting on JLL and Placer.ai data (March 2025); Mission Local eviction and rent data citing Apartment List and SF Rent Board (September 2025); IPG SF citing SF Chronicle (August 2025).
Not investment, relocation, or real estate advice.

このコンテンツについて、さらに観点や背景を補足しましょう。

  • ログインするとコメントできます。