Commodities Daily Move — May 28, 2026
Gold shed $54 — its steepest drop this month — as Iran deal optimism deflated the safe-haven bid and the Fed shifted to a potential rate hike. Crude gained 2%+ on U.S. military strikes against Iran and shrinking U.S. inventories. Copper extended its slide with technical indicators deeply bearish, while iron ore and corn held near flat.

Gold logged its steepest single-session drop of the month as Iran deal optimism drained the safe-haven premium, while crude held gains on fresh U.S. military strikes and tightening inventory. Copper slid for a second day as technical signals turned heavily bearish.
At a Glance
| Commodity | Price | Change | Direction |
|---|---|---|---|
| Gold (spot) | $4,401–4,447 / oz | −1.21 to −1.35% | ↓ |
| WTI Crude | ~$90–92 / bbl | +1.61 to +2.13% | ↑ |
| Brent Crude | ~$94–96 / bbl | +1.53 to +2.15% | ↑ |
| Copper (HGN6) | $6.2950 / lb | −0.62 to −0.68% | ↓ |
| Iron Ore 62% CFR | $109.27 / t | +0.01% | → |
| Corn (Jul 26) | 452.63 cts / bu | +0.14% | → |
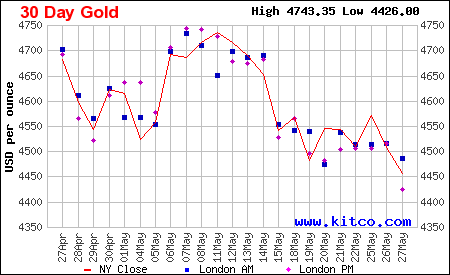
Gold — Sharpest Daily Drop This Month
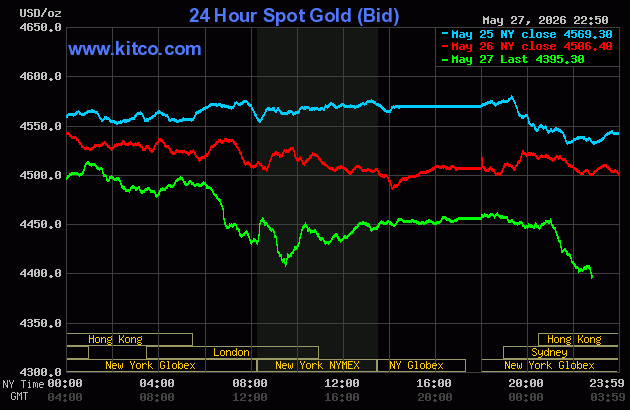
Price: $4,401–4,447 / oz | Change: −$53–54 (−1.21% to −1.35%)
Gold shed roughly $54 — its largest single-day loss in May — as three headwinds converged simultaneously.
1. Iran deal optimism removes conflict premium. President Trump confirmed that U.S.–Iran ceasefire talks aimed at reopening the Strait of Hormuz are still advancing. Even though contradictory signals kept the situation unresolved — Secretary of State Rubio cautioned a final deal could take days, while Iran's state TV reported an unofficial draft memo the White House promptly denied — markets chose to price deal hope rather than escalation risk. Lower geopolitical tension reduces the conflict premium priced into gold as a safe haven.
2. Inflation lock-in tightens the Fed. April CPI came in at 3.8%, the highest reading since May 2023. Elevated crude oil feeds consumer prices and keeps central banks hawkish. Markets are now pricing a meaningful probability of a Fed rate hike before year-end — a dramatic reversal from pre-conflict expectations that had pencilled in at least two 2026 cuts. Higher real rates raise the opportunity cost of holding non-yielding gold (gold pays no interest, so rising rates make competing assets relatively more attractive). The 10-year Treasury yield held near 4.5%, and the U.S. dollar firmed.
3. Institutional downgrade and new import tariffs. UBS cut its 2026 year-end gold forecast by $400 to $5,500 / oz, noting that real rates staying elevated make gold's non-yielding nature a larger drag and that ETF inflows have softened. Separately, India and Malaysia both imposed new import duties on LBMA-standard gold bars (India's move came first; Malaysia followed with a 10% duty), constraining physical demand in two of the world's largest gold-consuming nations.
A physical demand counterpoint: World Gold Council data showed global bar and coin demand hit 474 tonnes in Q1 2026 — the second-highest quarter on record, up 42% year-over-year — driven primarily by Asian buyers. This structural demand has not yet translated into futures-market upward pressure.
Technically, gold bulls need a push above the $4,453–$4,484 resistance zone. First support sits at $4,424, with deeper downside targets at $4,405 and $4,319.
Listed companies in focus:
- Barrick Gold (GOLD), Newmont (NEM), Agnico Eagle (AEM) — major gold miners, negatively pressured by falling spot prices and hawkish rate outlook.
- VanEck Gold Miners ETF (GDX) — tracks the XAU/HUI miner indices, both of which tracked the spot decline.
Crude Oil — Gains Hold on U.S.–Iran Military Exchanges
WTI: ~$90–92 / bbl (+1.6–2.1%) | Brent: ~$94–96 / bbl (+1.5–2.2%)
Oil moved in the opposite direction from gold. Despite deal-talk optimism reducing the headline conflict premium, the market anchored on two concrete supply-risk factors:
1. Fresh U.S. strikes on Iran. The U.S. military confirmed self-defense strikes (including targeting Iranian boats in southern Iran), and Iran's Revolutionary Guard claimed it fired on a U.S. F-35 and drones that allegedly entered its airspace. Active military exchanges suggest the Strait of Hormuz — through which roughly 20% of globally traded oil flows — remains a credible choke-point risk even as diplomacy proceeds. Kitco noted a headline "Oil Prices Jump After Fresh U.S. Strikes on Iran."
2. U.S. crude and gasoline inventories continue to sink. The latest EIA data showed a further drawdown in domestic U.S. crude and gasoline stocks, tightening the near-term supply picture and adding fundamental support to WTI beyond the geopolitical premium alone.
WTI +2.1% (~$91/bbl) on U.S. Iran strikes; Brent +2.2% (~$95/bbl) on Hormuz supply risk; Corn +0.1% at 452.6 cts/bu.
Listed companies in focus:
- ExxonMobil (XOM), Chevron (CVX), ConocoPhillips (COP) — integrated oil majors benefit from higher oil prices; positive leverage.
- Halliburton (HAL), Schlumberger (SLB) — oilfield services demand elevated when producers operate at high margins.
- Airlines (AAL, DAL, UAL) — higher fuel costs are a margin headwind for carriers without fully hedged fuel books.
Copper — Second Straight Down Day, Technicals Flashing Sell
Price: $6.2950 / lb | Change: −0.62 to −0.68% | 52-week range: $4.33–$6.72
Copper extended its pullback, now down from the 52-week high of $6.7160. Technical indicators on the front-month HGN6 contract are aligned to a strong sell signal across moving-average and oscillator studies. Several fundamental dynamics are at play:
1. Trafigura arbitrage shifts metal from LME to U.S. Trafigura (a commodity trading house managing tens of billions in annual trading) has been pulling copper out of London Metal Exchange warehouses to capitalize on a U.S. futures premium over LME spot. This inter-market flow creates near-term LME tightness but signals that the premium may eventually compress.
2. Peru political uncertainty. The Peruvian presidential race — Peru supplies roughly 10% of global mined copper — features candidates with divergent views on the mining sector. One prominent candidate's proposals have raised investor concerns about future tax and royalty conditions, adding a supply-side risk premium that markets may be partially discounting.
3. Industrial cost impact. Germany's InTiCa Systems, an electronic-components manufacturer, reported a net Q1 2026 loss partly attributable to elevated copper input costs, an early signal that sustained high copper prices are beginning to stress the downstream industrial cost structure.
Copper is up ~35% year-over-year even after the recent pullback, reflecting structural supply constraints and government-driven green infrastructure demand.
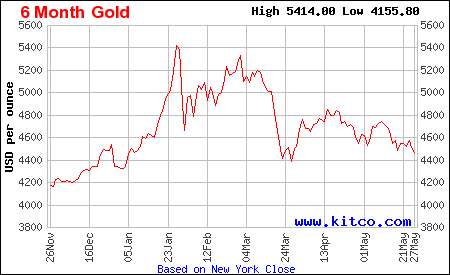
Copper −0.68% at $6.295/lb (LME arb + Peru risk); Iron Ore flat at $109.27/t; Gold −1.35% at $4,401–4,447/oz.
Listed companies in focus:
- Freeport-McMoRan (FCX) — largest U.S.-listed pure-play copper miner; high operational leverage to spot price.
- Southern Copper (SCCO) — significant Peru and Mexico exposure; most directly affected by Peruvian political risk.
- InTiCa Systems (ITS.DE) — reported Q1 loss attributable in part to copper cost inflation.
Iron Ore — Effectively Flat, China Demand in Focus
Price: $109.27 / t (62% Fe CFR) | Change: +0.01%
Iron ore was essentially unchanged on the session with zero reported volume on the reference CFR contract, suggesting thin holiday/overnight trading. At $109.27 / t, the price sits comfortably above the cost-support level for many Australian and Brazilian producers (~$60–80 / t all-in), but has retreated from the $120–130 range seen earlier this year.
The flat reading reflects a near-term standoff: China's steel output remains elevated (Chinese steel mills are major iron ore buyers, and China typically accounts for ~70% of seaborne iron ore trade), but rising Chinese domestic steel inventories and soft property sector demand are capping upside.
Listed companies in focus:
- Rio Tinto (RIO), BHP Group (BHP), Vale (VALE) — the three dominant seaborne iron ore exporters; flat price is neutral for today's earnings outlook.
- China steel mills (Baowu, HBIS — not U.S.-listed) — stable input costs preserve margins.
Corn — Fractionally Higher, Watching USDA Crop Progress
Price: 452.63 cts / bu (Jul 26 contract) | Change: +0.14%
Corn edged marginally higher, with the move well within normal daily noise. The Jul 26 contract at 452.63 cts / bu is broadly in the mid-range of recent weeks. Key upcoming catalysts are the USDA weekly crop progress report (monitoring planting completion pace in the U.S. Corn Belt) and any weather updates affecting the growing season.
The Strait of Hormuz situation adds a secondary fertilizer-supply angle: the crisis already triggered a global fertilizer supply shock (per earlier Oilprice.com reporting), as Iran is a meaningful producer of ammonia-based fertilizers. Higher fertilizer input costs are a lagging headwind for corn production economics in the 2027 crop cycle.
Listed companies in focus:
- Archer-Daniels-Midland (ADM), Bunge (BG) — agricultural commodity processors; slightly positive on stable-to-higher corn.
- CF Industries (CF), Nutrien (NTR) — nitrogen fertilizer producers benefit if fertilizer supply tightness persists.
- Corteva (CTVA), Deere & Company (DE) — seed/ag-equipment companies with indirect sensitivity to planting conditions.
Macro Context
The day's session was framed by an unresolved U.S.–Iran standoff that simultaneously pressured safe-haven gold (via deal hope) and underpinned crude (via active military exchanges). The U.S. economic calendar was light Wednesday, but Thursday brings a heavier macro tape: Q1 GDP second estimate, April personal income/spending, durable goods orders, and the April PCE index — the Fed's preferred inflation gauge. An upside PCE surprise could reinforce hawkish rate expectations and extend gold's losses, while affirming oil's role as an inflation proxy.
Global equities were mostly firmer heading into the U.S. open: Germany's DAX +0.7%, France's CAC 40 +0.5%, South Korea's Kospi +2.3%, Taiwan's Taiex +1.7%. China's Shanghai Composite fell 1.3%, a headwind for base-metal sentiment.
Data sourced from Kitco, Investing.com, and OilPrice.com. Prices as of May 27–28, 2026 during U.S. trading hours. This is a market recap, not investment advice.
このコンテンツについて、さらに観点や背景を補足しましょう。