Fastenal (NASDAQ: FAST) — the industrial vending machine company hiding in plain sight

Fastenal (NASDAQ: FAST) — the industrial vending machine company hiding in plain sight

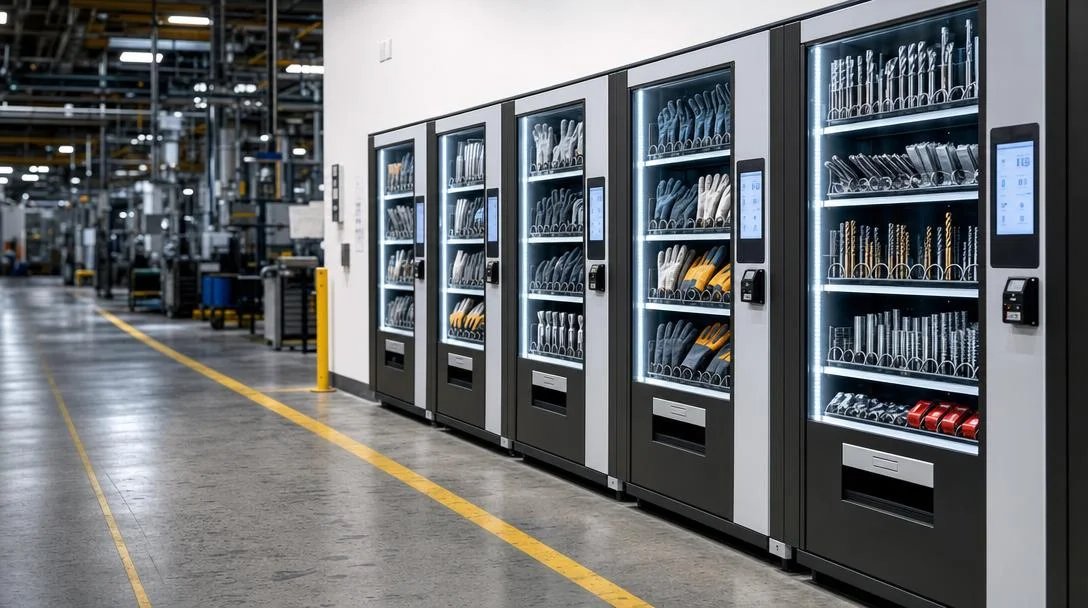
Fastenal is North America's largest specialized fastener distributor, but its real differentiator is the Onsite and FMI (Fastenal Managed Inventory) programs that embed vending machines and dedicated staff directly inside customer facilities — creating switching-cost stickiness that no catalog distributor can match. The company passes all three hard screening criteria with SEC-verified data: ROE of 35.5% / 33.0% / 33.3% across FY2023–FY2025, positive FCF in all three years ($1.26B / $0.95B / $1.05B), and a trailing P/E of ~40x that sits within Fastenal's historical 30–50x range. Key risks: premium valuation leaves no room for earnings disappointment, and industrial demand cyclicality could compress both earnings and multiples simultaneously. Q2 2026 earnings (late July) is the next catalyst.

US Stock Pick: 3-Year ROE > 15%
2026/5/26 · 2:46
購読 1 件 · コンテンツ 16 件
Current price: $43.94 (May 26, 2026) · Market cap: ~$50.5B · Sector: Industrials
Most investors picture a fastener company as a supplier of bolts and screws — a commodity business with thin margins competing purely on price. Fastenal is something more interesting. Over the past two decades it has quietly built a dense distribution network and an on-site vending and inventory management platform that now serves more than 400,000 customer locations in the U.S. and abroad. The result is a business with 33–35% return on equity, a 20% operating margin, and almost no debt — metrics that rarely coexist in industrial distribution.1
The stock has lagged its 52-week high by about 13%. That gap raises an honest question: is the current ~40x P/E a premium worth paying, or has the market correctly priced in a slowdown?

What Fastenal actually does

Fastenal began in 1967 in Winona, Minnesota, selling threaded fasteners out of a single store. Today it is North America's largest specialized fastener distributor and one of the leading distributors of safety products, cutting tools, janitorial supplies, and hydraulic components.1
The real differentiator is its Onsite and FMI (Fastenal Managed Inventory) programs. Rather than simply shipping boxes to a customer's dock, Fastenal embeds a dedicated team or a bank of vending machines directly inside a manufacturing plant, construction site, or warehouse. The customer pays only for what it consumes; Fastenal handles restocking, inventory visibility, and usage analytics. This model dramatically reduces customer procurement costs (fewer purchase orders, less emergency buying, less hoarding) while simultaneously locking in repeat purchasing through proprietary hardware and software.
By end of 2025, Fastenal had approximately 1,750 Onsite locations and roughly 110,000 vending and bin devices installed at customer facilities.1 These programs accounted for the majority of new revenue growth and represent a switching-cost moat that a catalog distributor cannot easily replicate.
Note on stock split: Fastenal completed a 2-for-1 stock split in 2025. All per-share figures in this article are post-split. Pre-split EPS of $2.00 (FY2024) became $1.00 per post-split share; pre-split adjusted FY2025 EPS is $1.09 per share post-split.

ROE track record — SEC EDGAR verified

All three ROE figures below are calculated using average stockholders' equity (beginning plus ending equity divided by two) applied to net income from SEC EDGAR XBRL annual filings — the standard convention used by financial data providers:1
Fiscal yearNet incomeAvg. stockholders' equityROE
FY2023 (ended Dec 31, 2023)$1,155.0M$3,255.8M35.5%
FY2024 (ended Dec 31, 2024)$1,150.6M$3,482.6M33.0%
FY2025 (ended Dec 31, 2025)$1,258.4M$3,779.9M33.3%
All three fiscal years clear the 15% threshold by a wide margin. The ROE stability — 33–35% across three years — reflects disciplined capital allocation rather than leverage-driven spikes. Fastenal carries almost no debt ($100M long-term as of year-end 2025), so these returns are generated entirely from operational performance.1
For context, the S&P 500 median ROE is approximately 13–15%. Fastenal's sustained 33% puts it in the top decile of industrial companies by this measure.

Free cash flow

Fastenal's FCF record is clean and consistent across all three fiscal years.
チャートを読み込んでいます…
FCF figures (operating cash flow minus capital expenditures) from SEC EDGAR:1
  • FY2023: $1,432.7M operating CF − $172.8M capex = $1,259.9M
  • FY2024: $1,173.3M operating CF − $226.5M capex = $946.8M
  • FY2025: $1,295.9M operating CF − $245.3M capex = $1,050.6M
FCF yield at the current market cap of ~$50.5B: $1,050.6M / $50,500M = 2.08%. That sits below the prevailing 10-year Treasury rate of roughly 4.3%, meaning the stock is priced for ongoing earnings growth — not for value at current levels.
The FY2024 dip in FCF ($946.8M vs. $1,259.9M in FY2023) stemmed from a softer operating cash flow year, partially driven by higher working capital requirements as Fastenal expanded its Onsite footprint. FY2025's recovery to $1,050.6M with rising capex (from $172.8M to $245.3M) shows the company is investing while maintaining solid cash generation.
Capital expenditure intensity is deliberately low — CapEx was only 3% of FY2025 revenue — reflecting the asset-light nature of the distribution model and the scalability of the vending/Onsite platform.

Revenue and earnings growth

チャートを読み込んでいます…
Revenue grew from $6.01B in FY2021 to $8.20B in FY2025 — a 5-year CAGR of 8.1%.1 FY2025's $8.20B represented 8.7% growth over FY2024, an acceleration from the 2.7% growth recorded in FY2024. That reacceleration is meaningful: FY2024 was a soft year for industrial purchasing broadly, and Fastenal's return to higher-single-digit growth in FY2025 suggests the Onsite and FMI programs continued to capture market share even in a restrained spending environment.
Net income was nearly flat in FY2024 ($1,150.6M vs. $1,155.0M in FY2023) — a dip of only 0.4% that reflected operating cost growth slightly outpacing revenue. FY2025 net income rebounded to $1,258.4M (+9.4% year-over-year), above the prior peak.1
Margin profile is the standout feature. Fastenal's gross margin has held near 45% for three consecutive years (FY2023: 45.6%, FY2024: 45.1%, FY2025: 45.0%), and its operating margin has been remarkably stable at ~20% (FY2021: 20.3%, FY2022: 20.8%, FY2023: 20.8%, FY2024: 20.0%, FY2025: 20.2%).1 For an industrial distributor, a sustained 20% operating margin is exceptional — W.W. Grainger (GWW) runs at 15.3% and MSC Industrial (MSM) at 8.5%.2
Diluted EPS on a post-split-adjusted basis grew from $1.60 (FY2021) to $2.02 (FY2023), dipped to $2.00 (FY2024), and recovered to a post-split adjusted $2.18 equivalent in FY2025 (reported $1.09 × 2 to normalize for the split).

Valuation vs. peers and history

統計カードを読み込んでいます…
At $43.94, the trailing P/E is approximately 40x (using post-split EPS of $1.09).3 Macrotrends reports the P/E at 44.70x using a slightly different trailing EPS window.4 The divergence reflects the TTM EPS calculation window — both are directionally the same.
Against sector peers, Fastenal trades at a premium:
CompanyDescriptionP/E (trailing)Forward P/EOperating margin
FASTFastenal — industrial distributor / vending platform~40x32.1x20.3%
GWWW.W. Grainger — broad-line industrial distributor33.4x24.8x15.3%
MSMMSC Industrial Direct — metalworking/MRO distributor28.7x21.7x8.5%
Sources: Finviz.32
Fastenal's trailing P/E premium over GWW (~7 turns) and MSM (~11 turns) reflects its structural margin advantage. The operating margin differential is real: FAST's 20.3% vs. GWW's 15.3% and MSM's 8.5% is not cyclical variance — it has been sustained for several years and reflects the higher-value embedded-service model versus pure catalog distribution.
Historical context: Fastenal has traded at 30–50x trailing P/E over the past decade, with the current ~40x sitting in the middle of that band. This is not a historically extreme multiple. The stock appears fairly to moderately valued relative to its own history — not cheap, not in bubble territory.
The PEG ratio of 0.323 (P/E divided by expected earnings growth rate) looks attractive, though readers should note that PEG ratios from Finviz use analyst consensus growth estimates that can shift materially quarter to quarter. Treat it as a directional indicator, not a precise metric.

Balance sheet health

Fastenal's balance sheet is among the cleanest in the industrial sector.
Total long-term debt at December 31, 2025: $100.0M.1 Against stockholders' equity of $3,943.6M, the debt-to-equity ratio is 0.025 — practically zero leverage. This compares to the industrial distribution sector average D/E of roughly 0.5–1.0x. Fastenal has reduced its long-term debt from $330M in FY2021 to $100M in FY2025, a 70% reduction over four years.
Other balance sheet metrics:
  • Current ratio: 4.85x (current assets $3,472M vs. current liabilities $715.6M) — strong near-term liquidity
  • Cash: $276.8M
  • Total assets: $5,052.9M; 78% financed by equity (equity-to-assets ratio)
  • Interest coverage: Essentially unconstrained given minimal interest expense (well below $10M annually in recent years) against $1.66B operating income1
The minimal-debt structure means Fastenal is self-funding its growth entirely from operations. The company has returned over $4.3B to shareholders via dividends over the past five years — $1,016.8M in FY2023, $893.3M in FY2024, $1,004.2M in FY2025 — funded entirely from FCF, not borrowing.

Competitive moat

リンクプレビューを読み込んでいます…
Fastenal's competitive advantage rests on two reinforcing pillars: network density and on-site service switching costs.
With roughly 3,300 branch locations across North America (most U.S. manufacturers are within a short drive of a branch), Fastenal can promise same-day or next-day delivery for emergency needs — a commitment that catalog-only or e-commerce distributors cannot consistently make.1 That last-mile density took decades to build at low individual-branch capex.
The Onsite and vending programs are structurally stickier. When Fastenal installs vending machines inside a customer's plant and assigns a dedicated service representative, it becomes embedded in the customer's production workflow. Replacing it means pulling out hardware, retraining staff, and finding an alternative supplier willing to match the service model — a high practical friction for a procurement team focused on uptime. This is why Fastenal's gross margin (45%) runs well above the typical commodity distributor (30–35%): customers pay for the service, not just the screw.
Direct competitors include W.W. Grainger (GWW) and MSC Industrial (MSM), though both operate predominantly as catalog distributors. Grainger has scale ($17B+ revenue) but significantly lower operating margins; MSC focuses on metalworking consumables and has experienced margin pressure. Fastenal's focus on Onsite penetration differentiates its growth driver from pure volume competition.

Risk factors

Valuation leaves no room for disappointment.
  • Trigger: Any quarter where revenue growth decelerates materially below 8% or operating margin slips below 19.5%
  • Magnitude: The forward P/E of 32.1x implies the market is pricing in sustained double-digit earnings growth; if growth disappoints at 5–6%, the P/E multiple would likely compress toward GWW's 25x range, implying a 20–25% downside to the stock price from current levels
  • Timeline: Next earnings report expected late July 2026
Industrial demand cyclicality.
  • Trigger: A U.S. manufacturing recession (PMI below 48 for 3+ consecutive months), reduced construction activity, or automotive sector softness — Fastenal's end markets include manufacturing, construction, and commercial/government
  • Magnitude: FY2024 showed what a mild soft patch looks like: revenue growth slowed to 2.7% and FCF fell to $946.8M. A deeper downturn could reduce earnings by 10–20% without causing structural damage, but the multiple would likely compress simultaneously (double impact)
  • Timeline: Macro indicators watched monthly; ISM Manufacturing PMI is the leading signal
Tariff and supply chain exposure.
  • Trigger: Escalation of Section 301 tariffs on imported goods from China and other Asian manufacturing hubs, where a portion of Fastenal's product catalog (cutting tools, safety equipment, janitorial supplies) is sourced
  • Magnitude: No public disclosure quantifying the % of COGS from tariff-affected imports; guidance would be the first source of detail
  • Timeline: Policy-dependent; ongoing
Onsite program deceleration.
  • Trigger: Saturation of the addressable large-manufacturer market for Onsite locations; if Onsite signings plateau, Fastenal's structural margin advantage over peers narrows
  • Magnitude: Onsite and FMI revenues are not separately broken out in the 10-K, so this risk is difficult to quantity from public filings alone; directional signal is in the segment revenue growth rate disclosed per earnings call
  • Timeline: Q2/Q3 2026 earnings calls should provide Onsite signing update
Minimal insider ownership.
  • Trigger: Not an immediate operational risk, but insider ownership at 0.20% of shares outstanding3 means management has limited direct skin in the game at current prices; this reduces the alignment signal that investors sometimes weight
  • Magnitude: No public data linking insider ownership level to operational outcomes for this company; noted as context

Near-term catalysts

Q2 2026 earnings (expected late July 2026) will reveal whether the FY2025 revenue acceleration (+8.7%) has carried into the new year. Analysts will focus on:
  • Daily sales rate growth (Fastenal typically reports daily sales trends)
  • Onsite signing pace vs. Q2 2025
  • Gross margin trajectory (45% sustained or slipping under cost pressures)
Dividend income. Fastenal paid $1.004B in dividends in FY2025, equivalent to $0.875 per post-split share. At the current $43.94 price, the trailing dividend yield is approximately 2.0%.1 The payout ratio is roughly 80% of net income — high but sustained given steady FCF. Fastenal has paid dividends every year for over 25 years; the FY2023 per-share amount represented a 43% increase over FY2022 (on a pre-split basis), including a special dividend.
Analyst consensus: The average analyst target price for FAST is approximately $47.30,3 implying about 7.7% upside from the current $43.94. The stock sits roughly 13% below its 52-week high of $50.63 and 13% above its 52-week low of $38.97.3 Short interest is 2.14% of float — low, with no crowded-short dynamic to factor in.
The key investor question is whether Fastenal can sustain earnings growth in the 8–10% range to justify the current multiple. If FY2025's return to revenue acceleration was the beginning of a multi-year Onsite-driven growth cycle, the stock looks fairly priced here. If FY2024's softness was the new normal, the premium looks hard to defend.

Cover image: AI-generated illustrative image of an industrial supply distribution facility
All financial data is sourced from SEC EDGAR XBRL filings and Finviz as noted. Analyst price targets and short interest data represent consensus as of May 2026. This article is for research purposes only and does not constitute investment advice. Verify all data independently before making investment decisions.

このコンテンツについて、さらに観点や背景を補足しましょう。

  • ログインするとコメントできます。