
Market Cap
$5.68B
TTM Revenue Growth
+86.94%
PEG Ratio
0.08 (Finviz)
Operating Cash Flow
+$1.26B TTM
Forward P/E
3.39–5.50×
EV/EBITDA
2.53–2.89×
Net Debt
−$40.5M
Next Earnings
Aug 6, 2026
B2Gold (BTG) passes all four filters: $5.68B cap, +86.94% TTM revenue, PEG 0.08, $1.26B OCF
| Filter | Threshold | Actual | Sources | Verdict |
|---|---|---|---|---|
| Market cap | < $10B | $5.68–5.74B | StockAnalysis, Finviz, Yahoo Finance | ✅ Pass |
| TTM revenue growth | > 30% | +86.94% | StockAnalysis, Finviz, Yahoo Finance, Macrotrends | ✅ Pass |
| PEG ratio | < 1.0 | 0.08 (Finviz) | Finviz primary; SA / Yahoo show n/a | ✅ Pass |
| Operating cash flow | Positive | +$1.26B TTM | StockAnalysis, Yahoo Finance | ✅ Pass |
| Quarter | Revenue | YoY growth |
|---|---|---|
| Q1 2025 | $532.1M | +15.3% |
| Q2 2025 | $692.2M | +40.5% |
| Q3 2025 | $782.95M | +74.7% |
| Q4 2025 | $1,054M | +110.9% |
| Q1 2026 | $1,159M | +117.8% |
| TTM | $3,688M | +86.9% |
| Period | Net income | Diluted EPS | Adj. EPS |
|---|---|---|---|
| Q1 2025 | — | $0.04 | — |
| Q2 2025 | — | $0.10 | — |
| Q3 2025 | — | $0.01 | — |
| Q4 2025 | — | $0.11 | $0.11 |
| Q1 2026 | $200M (attr.) | $0.14 | $0.19 |
| TTM | $544.26M | $0.38 | — |
| FY2025 | $401.91M | $0.28 | — |
| FY2024 | −$629.89M | — | — |
| Metric | BTG | Gold mining peers (selected) | Source |
|---|---|---|---|
| Trailing P/E | 10.43–11.75× | Newmont 17.50×, Agnico Eagle 26.29×, Barrick 17.85×, Kinross 18.25×, Eldorado 20.72×, Iamgold 16.28× | 1 9 |
| Forward P/E | 3.39–5.50× | Peer range ~12–16× | 1 2 3 |
| EV/EBITDA | 2.53–2.89× | Peer range ~8–12× | 1 2 |
| P/S | 1.54–1.74× | — | 1 |
| P/B | 1.53–1.59× | — | 1 |
| P/OCF | 4.52× | — | 1 |
| P/FCF | 13.02–13.17× | — | 1 2 |
| PEG | 0.08 (Finviz) / 0.13–0.16 (cross-check) | — | 2 |
| Metric | Value | Source |
|---|---|---|
| Cash & equivalents | $479.4M | 6 |
| Total debt | $519.9M (LT: $491.1M + current: $28.75M) | 10 |
| Net debt | −$40.5M (net cash) | Calculated 10 |
| Net Debt/EBITDA | −0.02× (effectively zero) | 1 |
| Debt/EBITDA | 0.26× | 1 |
| Debt/Equity | 0.14× | 1 |
| Total assets | $5,965M | 10 |
| Shareholders' equity | $3,713M | 10 |
| Current ratio | 1.19× | 1 |
| Quick ratio | 0.49–0.59× | 1 2 |
| Interest coverage | 29.69× | 1 |
| Altman Z-Score | 2.96 | 1 |
| OCF (TTM) | $1.26B | 1 11 |
| Metric | Value | Source |
|---|---|---|
| Price (Jun 18, 2026 close) | $4.30 | 2 |
| Pre-market Jun 22 | $4.27 (−0.70%) | 1 |
| 52-week high | $6.29 | 2 |
| 52-week low | $3.31 | 2 |
| Distance from 52-week high | −31.6% | Calculated |
| YTD performance | −4.66% | 1 |
| 1-year performance | +16.2–17.2% | 1 3 |
| SMA20 | −2.90% below | 2 |
| SMA50 | −7.75% below | 2 |
| SMA200 | −9.63% below | 2 |
| RSI (14-day) | 45.17 (neutral) | 2 |
| Beta | 1.30 (StockAnalysis / Yahoo, 5Y monthly) / 0.67 (Finviz) | 1 2 |
| Avg. daily volume | 21.96M (20-day, SA) / 28.89M (Finviz) | 1 2 |
| Short interest | 55.66M shares (4.18% of outstanding) | 1 |
| Days to cover | 2.25 | 1 |
| Firm | Action / Rating | Price target |
|---|---|---|
| CIBC | — | $6.50 (Feb 2026 raise) |
| Scotiabank | Sector Perform | C$8.00 (Oct 2025 raise) |
| Raymond James | Outperform (resumed Jun 30, 2025) | $4.50 (now exceeded) |
| RBC Capital | Hold (Sector Perform) | $5.75 (Jun 2026) |
| BofA Securities | Underperform (Jan 2025 downgrade) | — |
| Event | Expected timing |
|---|---|
| Fekola Regional exploitation permit | End of June 2026 — binary catalyst |
| Q2 2026 preliminary production results | Late July 2026 |
| Q2 2026 earnings | August 6, 2026 (after market close) |
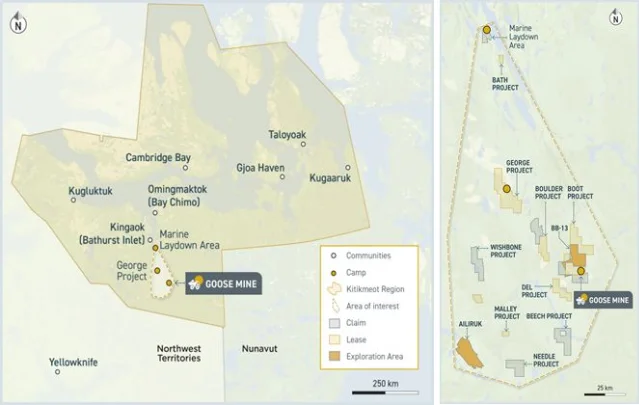
| Goose crushing circuit repairs complete | Q3 2026 |
| Goose Phase 1 capacity upgrade (3,200 tpd) | End of Q3 2026 |
| Gramalote permitting decision | ~March 2027 (12 months from Mar 2026 submission) |
| Goose Phase 2 capacity upgrade ($20–30M, 4,000 tpd) | H1 2027 |
| NCIB authorization ceiling (132.7M shares) | Through April 2, 2027 |
| Back River exploration results (2026 program) | Q4 2026 / early 2027 |
Añade más opiniones o contexto en torno a este contenido.